DIGITALY CONTROLLED WHITE NOISE GENERATOR Jan Neškudla, Josef Vedral Czech Technical University, Faculty of Electrical Engineering, Department of Measurement, Prague,
[email protected],
[email protected]
Abstract: This paper demonstrates a new method of digital generation of white noise signal with given statistical distribution. Digital pseudo-random number generator based on LFSR and a single-bit Digital/Analogue converter are used. The objective of this exploration is a testing device usable to measure parameters of Analogue/Digital converters using StepGauss test method. Also new theoretically possible way of generating uniformly distributed noise signal is shown. Keywords: white noise, digital generator, LFSR, mean value, dispersion, hysteresis, uniform, gauss, stepgauss.
Digital to Analogue converter) filter that transforms digital signal to Analogue form.
Figure 1.Basic implemented structure
I. PRINCIPLE OF DIGITAL WHITE NOISE GENERATION
II. PRINCIPLE OF CHANGE OF MEAN VALUE AND DISPERSION
This method is based on the central limit theorem. The theorem is the following. Let X1, X2, X3, ... be a sequence of random variables which are defined on the same probability space, share the same probability distribution D and are independent. Assume that both the expected value µ and the standard deviation σ of D exist and are finite. Consider the sum : Sn = X1 + ... + Xn. Then the expected value of Sn is nµ and its standard deviation is σ n½. Furthermore, informally speaking, the distribution of Sn approaches the normal distribution N(nµ,σ2n) as n approaches ∞. In order to clarify the word "approaches" in the last sentence, we standardize Sn by setting
Now will be shown the way, how to change the mean value and dispersion. The possibility of change of mean and dispersion of output signal is done by the hysteresis switch (HS) placed between LFSR and output single-bit Digital/Analogue (LP) converter. See Figure 2. The n bit parallel output from LFSR is processed by hysteresis switch, there it is converted to logical signal of ones and zeroes (binary coded signal) and by setting the low and high hysteresis limits is possible to arrange ratio of ones to zeroes (PWM – pulse width modulation) in signal D2. This binary coded signal is then processed by a single-bit Digital/Analogue converter, which is based on simple passive low-pass filter and OA is output amplifier.
Zn =
S n − nµ
σ n
(1)
Then the distribution of Zn converges towards the standard normal distribution N(0,1) as n approaches ∞ (this is convergence in distribution). For proper work it requires a good RNG (Random Number Generator), which has the same statistical distribution across whole period. In this exploration, is used Pseudo-random number generator (PRNG) based on Linear Feedback Shift Register (LFSR). It`s bitwidth is 32 bits and its period length is maximally 232 with zero suppression logic and with no additional logic (232-1). LFSR generates uniformly distributed pseudo random numbers. For basic function scheme see Figure 1. From output D1, digital binary coded signal is then processed by Low-Pass (the single-bit
Figure 2. Internal implemented structure and function
Change of the mean value and the dispersion of generated pseudo-random signal are done by proper settings of the low and high hysteresis limits. By setting them equal, so there is no hysteresis, we get simple comparator. In this case it can be changed the mean of output signal (Figure 3a. and 3b.) because the change of ratio ones to zeroes in D2 signal is done. By setting them differently it can be set dispersion of output signal (Figure 4.) because of changing duration of states (zeros to ones) in signal D2. Both the mean
value and dispersion can be set simultaneously, so it can be obtained proper distribution of output signal. Statistical parameters
Simulated change of dispersion 5 4 3 2 1 -1,0
-0,8
-0,6
-0,4
0 -0,2 -10,0
0,2
0,4
0,6
0,8
1,0
-2 mean
Figure 3a. Simulated change of mean value (0)
comparation limits standard deviation skewness
kurtosis
Figure 5. Change of statistical parameters caused by change of the mean value. Simulated in Matlab/Simulink.
III. GENERATING UNIFORMLY DISTRIBUTED WHITE NOISE SIGNAL
Figure 3b. Simulated change of mean value (0.2)
Figure 4. Simulated change of dispersion
Simulation was done in Matlab simulink and simulated data were collected and the mean value, standard deviation, the skewness and the kurtotis were computed. In Figure5. are shown values changing the mean value. We can say that the output distribution is normal if skewness is close to zero and kurtosis is close to three. To preserve normal distribution of the output signal the levels of comparison can be changed only in half of their full scale.
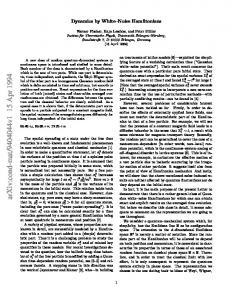
One of the methods used to generate uniformly distributed noise signal from normally distributed (Gaussian) noise signal is Step-Gauss method [3]. The problem is that you have to wait whole period of generation and setting the mean value till you can say that output signal is uniformly distributed. Our new method is to sweep (control) the mean value by other PRNG source with uniformly distributed random numbers (Figure 6.).
Figure 6. Structure of the digital uniformly distributed white noise generator.
Some special requirements have to be met compared to previous example of white noise generation. The hysteresis limits are equal so it works only like comparator. LFSR must work m-times faster then DLFSR, where DLFSR is controlled linear feetback shift register, and m is integer multiple of n. The mean block is used over against simple low-pass filter LP. Mean block produce exact mean value of input PWM signal during one period cycle of LFSR. Output is sampled by SAMPLE CLK from LFSR. These requirements are necessary for proper function of this generator and from them arises some parameters limits for this device.
The most important parameter is maximal frequency of generated band limited white noise (FBWNH) and it can be calculated by this formula (2):
FBWNH =
CLK 2n
(2)
Where CLK is system clock speed and n is bit width of LFSR. 2n is period of LFSR implemented in FPGA with additional logic for zero state suppression. Maximal frequency of generated band limited white noise (FBWNH) is limited by the bit-width of LFSR and thus it is better to use LFSR with short period e.g. 6 bits. Next problem is the whiteness of generated noise, if short period is used. To solve this problem DLFSR from simple PRNG with uniform distribution to bank of PRNGs of bit width n have to be improved. From that bank, set of uniformly distributed pseudo-random signals are produced. If each of them is used as control signal for DHS block, unique pattern of noise signal is generated. Maximal length of the pattern period is factorial of n multiplied by 2n. So minimal frequency of band limited white noise can be calculated by formula (3):
FBWNL =
CLK 2 n n!
(3)
In developed device system clock 20MHz is used and calculated band limits for maximal pseudo random pattern are follows (tab 1). n
3
4
5
6
7
FBWNH [kHz] FBWNL [kHz]
2500
1250
625
312.5
156.25
416.67
52.08
5.21
0.43
0.03
Figure 7. Detail of amplitudes distribution in output signal during 94th period of DLFSR control signal
Figure 8. Amplitudes distribution in output signal at the end of 2nd period of DLFSR control signal
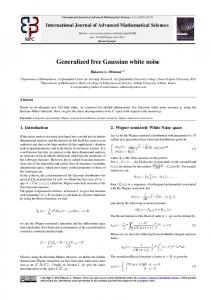
Spectrum of generated signal was calculated (Figure. 8). On the beginning of the spectrum is low drop corresponding to formula (3). For simulation DLFSR with 32 PRNGS of bit width 5 were used. Thus FBWNL = 19.53 [kHz]. Calculated FBWNL corresponds to low drop frequency in Fig. 8.
Tab 1. White noise bandwidth as function of LFSRs bit width.
The uniformity of generated output signal is guaranteed by the fact that, each generated control signal from DLFSR has uniform distribution over its period. Thus each amplitude level of output signal is presented only once per period and output signal is strictly uniformly distributed. See Figure 7. and 8.
Figure 8. Spectrum of the output uniformly distributed white noise signal.
IV. SIMULATION Some simulation tests were done in Matlab/Simulink. Followed results were achieved. Histogram tests of uniformity were performed. On the Figure 8. is shown, that after each whole period of control signal, output signal is uniformly distributed.
V. HARDWARE DESIGN For simplicity and possibility of upgrades a Field Programmable Gate Array (FPGA) Acex1K was used for the design. The LFSR and hysteresis switch are implemented in software. The AHDL programming language was used. The device has possibility to be controlled by PC over the USB interface, so a user can set hysteresis limits and start point of LFSR (i.e. SEED). The USB can also be used as power supply for the device or we can use an external power supply.
VI. MEASURED PARAMETERS AND SIGNALS
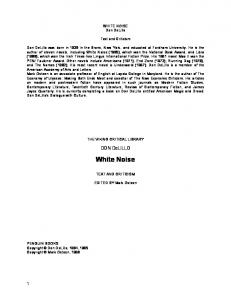
range. As we can see the change of mean is linear in whole interval of the output range. L in e a rity o f ch a n g e o f m e a n
The n bit width of digital parallel output from the LFSR is shown in Figure 9. Binary coded output of hysteresis switch is in Figure 10. In Figure 11. we can see final output noise signal with Gaussian distribution of amplitudes. The Power Spectral Density (PSD) of output signal is in Figure 12. Drop off of the PSD is caused by the low-pass filter on the output. The PSD is nearly constant (i.e. White Noise).
Output voltage [V]
3,0 2,5 2,0 1,5 1,0 y = -0,0117x + 3,0236 2 σ = 0,9994
0,5 0,0 0
50
100
150
200
250
C o m parison level
Figure 13. Measured linearity of change of mean.
VII. CONCLUSION Simulation and basic experimental measurement has shown, that this is a new simple method of generating noise signal with given statistical distribution and parameters. Figure 9. Generated pseudo random numbers (D1 in Fig 1.)
ACKNOWLEDGEMENT The research of digital noise generator was supported by the research program No. MSM6840770015 "Research of Methods and Systems for Measurement of Physical Quantities and Measured Data Processing " of the CTU in Prague sponsored by the Ministry of Education, Youth and Sports of the Czech Republic.
Figure 10. Binary signal (D2 in Fig 1.)
REFERENCES [1]
Measured values for linearity of change of mean measurement are shown in Figure 13. Parameters of measurement are the followings. Comparison levels are set to the same value so there is no hysteresis. Linearity was measurement through whole interval of the output
Vlček, Musil, Mitrych, Kovalský.: Návrh obvodů v jazycích VHDL a Verilog Sdělovací technika. 2001. no. 11.
[2]
Rukhin, A.,Soto J, Nechvatal. M. Smid.: et al. A Statistical Test Suite for the Validation of Random Number Generators and PseudoRandom Number Generators for Cryptographic Applications. http://csrc.nist.gov/rng/SP800-22b.pdf
[3]
Holub J., Vedral J.: Stochastic testing of ADC – Step-Gauss method. Computer Standards & interfaces 26 (2004) 251-257.
[4]
Vedral, J. Holub, J.: Testing of ADCS with Noise Signal. In IMSTW Cannes 2005. Cannes: IEEE Computer Society, 2005.
[5]
Holub, J. Neškudla, J. Vedral, J.: Measurements of ADCs Effective Resolution. In ADDA 2005 - The 5th IEE International Conference on Advanced A/D and D/A Conversion Techniques and their Applications. Limerick: The IEE Measurement, Sensors, Instrumentation and NDT Professional Network , 2005, p. 255-257. ISBN 0-86341542-3.
Figure 11. Generated output signal with Gaussian distribution of amplitudes (A1 in Fig 1.)
Figure 12. PSD of generated output sigma
Figure 9. PSD of generated output sigma