Hindawi Publishing Corporation Advances in Operations Research Volume 2014, Article ID 397675, 9 pages http://dx.doi.org/10.1155/2014/397675
Research Article Disaggregation of Statistical Livestock Data Using the Entropy Approach António Xavier,1 Maria de Belém Costa Freitas,1 and Rui Fragoso2,3,4 1
Faculdade de Ciˆencias e Tecnologias, Universidade do Algarve, Edif´ıcio 8, 8005-139 Faro, Portugal ´ Universidade de Evora (UE), Centro de Estudos e Formac¸a˜ o Avanc¸ada em Gest˜ao e Economia Tecnologias, ´ 7000-809 Evora, Portugal 3 ´ ´ Department of Management, Universidade de Evora, 7000-809 Evora, Portugal 4 ´ ´ Instituto de Ciˆencias Agr´arias e Ambientais Mediterrˆaneas, Universidade de Evora, 7000-809 Evora, Portugal 2
Correspondence should be addressed to Ant´onio Xavier;
[email protected] Received 30 January 2014; Accepted 2 May 2014; Published 3 June 2014 Academic Editor: Konstantina Skouri Copyright © 2014 Ant´onio Xavier et al. This is an open access article distributed under the Creative Commons Attribution License, which permits unrestricted use, distribution, and reproduction in any medium, provided the original work is properly cited. A process of agricultural data disaggregation is developed to address the lack of updated disaggregated data concerning main livestock categories at subregional and county level in the Alentejo Region, southern Portugal. The model developed considers that the number of livestock units is a function of the agricultural and forest occupation, and data concerning the existing agricultural and forest occupation, as well as the conversion of livestock numbers into normal heads, are needed in order to find this relation. The weight of each livestock class is estimated using a dynamic process based on a generalized maximum entropy model and on a crossentropy minimization model, which comprises two stages. The model was applied to the county of Castelo de Vide and their results were validated in cross reference to real data from different sources.
1. Introduction Disaggregated statistical information is necessary to have a correct analysis of spatial patterns inside each country, but data on agricultural and forest occupation and production are frequently found only at national and subnational level [1–4], and oftentimes this problem does not have an appropriate and accurate solution. In Portugal, southern Europe, apart from the general lack of data on agricultural and forest occupation, there is a need for up-to-date data on livestock numbers [2]. Only the General Agricultural Census (GAC), conducted by the National Institute of Statistics (NIS) every 10 years, features information at disaggregated level by subregion, county, and parish. The other information sources display information merely according to agrarian regions and NUTS II [5, 6]. Even the different agents operating in the territory do not have more detailed data, and only the health veterinary entities have some more accurate data for nowadays, which is not accessible to all.
However, planning and devising of a clear and sustainable rural development policy call for the availability of disaggregated information [4], at least when it comes to the numbers of livestock intended for breeding, mainly in regions where these variables have a great importance for the farmers’ income. After the entrance of Portugal into the European Union, the Alentejo region, southern Portugal, has come under the influence of different policies and as a consequence there are several inland rural areas with problems and in decline, as well as the extensification of agricultural activities [7]. In this region, the importance of livestock breeding activity is unquestionable [8]. A particular county where there is a tendency towards demographic decrease is Castelo de Vide located in the NUTS II of Alto Alentejo. Several teams from the Uni´ versity of Evora have performed depth studies and identified this county as a case study about the decline process of the inland counties of the NUTS II of Alto Alentejo. Here, there is a need for data on extensive livestock for
2
Advances in Operations Research N
N
N
Alto Alentejo Nisa Castelo de Vide Gaviao
Marvao Crato
Alentejo Central
Portalegre Alter do Chao
Ponte de Sor
Arronches Avis
Alentejo Litoral
Baixo Alentejo
50
Monforte
Mora
100
0 10 20
Campo Maior
Elvas
(km)
(km) 0
Fronteira
(km)
40
60
80
0 5 10
20
30
40
Al j Alentejo
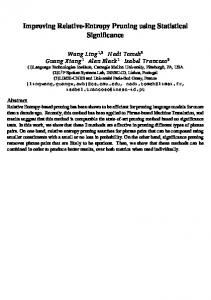
Figure 1: The model’s application area.
breeding to enable a correct analysis of the current state of affairs and the implementation of development policies, which may contribute to the increase of the farms’ income. Therefore, methodologies for estimating livestock data are relevant, namely, in rural areas where there is a tendency towards the decline of agricultural activity, livestock breeding and local economy. Thus, a methodology to obtain disaggregated information on livestock units is proposed in this paper, focusing especially on the forecast of the main categories of livestock units intended for breeding, as well as total livestock units. In order to develop such a methodology, one has considered the previous studies carried out and different methodologies that may be adapted to this area and which are quite few. Fragoso et al. [2] presented a way of calculating the main livestock species intended for breeding. The authors used a conversion process of the livestock into normal heads and followed the evolution of the aggregate based on the historical pattern. Thus, they simply made the data follow the aggregate variation rate with some adaptations. This procedure is very simple but may lead to some mistakes. Other studies carried out for the Alentejo region, namely, by the state entities, do not use a suitable disaggregation level or present incomplete information. In spite of the above referred, there are some studies carried out for land use disaggregation based on entropy in the Alentejo Region, which allowed a good disaggregation of information [2, 9]. There are also some international studies that use methodologies based on the entropy approach for estimating livestock data. Some of these are presented next. Jongeneel [10] used a nonstationary Markov model approach, where the transition probabilities are explained by a set of exogenous (policy) variables. Karantininis [11] applied a generalized cross entropy instrumental variables estimator to recover the nonstationary transition probability matrix for the Danish pork industry. Tonini and Jongeneel [12] analyzed the evolution of the dairy farm structure of Poland during the postsocialist period and applied a generalized
cross entropy Markov chain approach which incorporated prior information for estimation. Therefore, the key question is to be able to adapt such studies in order to allow not only a good added value to data calculation, but also a dynamic calculation process of the livestock data, since there are some indicators of a possibility of this methodology providing good results for solving the problem, and allowing the possibility of predicting future trends. The study was applied to the Alentejo Region where livestock were disaggregated, in the first step for the subregion of Alto Alentejo and then in the second step for its county of Castelo de Vide. The following maps show the location of the application area (Figure 1). In addition to this introduction, the paper is organized in more three parts. The second part includes the material and methods, which describe the disaggregation problem and the methodological approach developed for estimating the number of livestock units. The third part is concerned with the presentation and discussion of results. Finally, the concluding remarks are included in the last part.
2. Material and Methods 2.1. The Disaggregation Problem. The intent is to obtain disaggregated data on the main livestock categories at county level for 2005 and also to obtain a historical sequence of data. So, for addressing this problem it must be considered that in the Alentejo region the number of livestock units is closely linked with the agricultural and forest areas, since the livestock are breeding mainly in extensive systems based on pastures under Mediterranean forest, seeded or spontaneous. The information from the disaggregated units (counties and subregions) is available only for the first 𝑟 periods (𝑟 < 𝑇), that is 1989 and 1999. Therefore, the information disaggregation problem can be formulated as follows: 𝐸𝑝 (𝑡) = ∑ 𝐸𝑃𝑖 (𝑡) . 𝐵𝑖 ⊂𝐴 𝑥
(1)
Advances in Operations Research
3
The aim is to obtain from the known variable 𝐸𝑝𝑥 (𝑡) the data in 𝐸𝑝𝑖 (𝑡), which is the target variable related to the livestock activities (𝑝) at the disaggregated level (𝑖) in a given moment (𝑡). The matrix 𝐴 𝑥 represents the aggregated unit 𝑥 and it is necessary to determine 𝐸𝑝𝑖 ∀𝑝, 𝑖 and 𝑡, for the subunits 𝐵𝑖 at the moment (𝑡), for which there is no available information at the disaggregated level (𝑖). As it was referred before, the number of livestock units is connected to the agricultural and forest occupation at the disaggregated level (𝑆𝑘𝑖 (𝑡)) or, in its absence, to the data at the aggregate level (𝑆𝑘 (𝑡)). The aim is to find the livestock distribution at disaggregated level, knowing that it is a function of agricultural and forest occupation in that moment: 𝐸𝑃𝑖 (𝑡) = 𝑓 [𝑆𝑘𝑖 (𝑡)]
with 𝑡 = 1, 2, . . . , 𝑇,
(2)
where 𝐸𝑃𝑖 (𝑡) represents the number of livestock units 𝑝 in territorial unit 𝑖 at the moment 𝑡 and 𝑆𝑘𝑖 (𝑡) is the agricultural or forest occupation 𝑘 in territorial unit 𝑖 at the moment 𝑡. Therefore, it is assumed that this is a direct relation with the land uses, namely, pastures. However, the number of livestock units is bounded by the following relation: 𝐸𝑃𝑖 (𝑡) ≤ 𝐶V𝑖𝑘 (𝑡)
∀𝑖, 𝑘, 𝑡 = 𝑟 + 1, . . . , 𝑇.
(3)
According to that, the composition of livestock must respect the predefined rules of heading (𝐶V) as a function of agricultural and forest occupation 𝑘 at the moment 𝑡, that is, for the total physical area necessary to breeding livestock. These values should be also subjected to the following restriction: 𝐸𝑃 (𝑡) =
𝐼
∑ 𝐸𝑃𝑖 (𝑡) , 𝑖=𝑖
Table 1: The indexes of conversion into normal heads. Livestock type Bovine Bovines over 2 years Other bovines Suines Reproducer females >50 kg Other suines >20 kg Sheep Goats Equines
Conversion index 1 0.6 0.5 0.3 0.15 0.15 1
(Source: GPAA).
Each territorial unit (region, subregion, and county) has a well-determined relation between NH and the agricultural and forest occupation. This relation is obtained calculating the number of NH for each predominant livestock class in the area and establishing the relation between the number of NH and agricultural and forest occupation, namely, forage crops and permanent pastures. So, the number of effective livestock intended for breeding 𝑝 in NH, in territorial unit 𝑖, at the moment 𝑡 can be calculated as follows: 𝐸NH𝑖𝑝 (𝑡) = 𝐸𝑝𝑖 (𝑡) × 𝐼NH𝑝 ,
(5)
where INH is the conversion index from livestock class 𝑝 into NH. On the other hand, the relation between livestock numbers in NH and agricultural and forest occupation is determined by 𝑃
∀𝑝, 𝑡 = 𝑟 + 1, . . . , 𝑇.
(4)
This restriction demands that the number of livestock units from a certain class at an aggregate level must be equal to the sum of that class in all disaggregated territorial units. That is, the sum of the number of livestock units 𝑝 in all disaggregated units 𝑖 at the moment 𝑡 must be equal to the respective aggregated value. 2.2. The Estimation of Livestock’s Normal Heads. The number of livestock units is a function of farms’ land occupation and hence there are coefficients that indicate this relation considering that each livestock class has different requirements in terms of feeding and, therefore, the necessity for a wider or smaller area. The conversion of different livestock categories into normal heads (NH) is a useful tool for considering those aspects. Normal head is a common livestock measure that allows dealing in the same units with different categories of livestock in function of species and ages. There is a legal table of conversion (Portaria no. 229-A/200 of 6 March 2008, [5]). For instance, according to that table a sheep over 1 year is equal to 0.15 NH and a bovine over 2 years is equal to 1 NH. In order to better understand this measure, Table 1 presents the main conversion indexes for the different species according to their age.
𝑅𝑝𝑘 = ( ∑ 𝐸NH𝑖𝑝 (𝑡)) ÷ 𝑆𝑘𝑖 ,
(6)
𝑝=1
where 𝑅 is the relation between total livestock and 𝑘 agricultural and forest occupation in territorial unit 𝑖. These values can then be transferred to a period 𝑡 + 1 as follows: 𝑠𝐸NH𝑖 (𝑡 + 1) = 𝑅𝑝𝑘 × 𝑆𝑘𝑖 (𝑡 + 1) .
(7)
It is also possible to define sustainability limits on the number of NH per agricultural and forest occupation with specific additional information. 2.3. The Estimation of Livestock’s Percentage Weight by Class. Until this point, the methodology proposed allows us to estimate the total number of breeding livestock in (NH), but it does not allow us to calculate the percentage weight of each class. This leads us to search for a methodology that is able to estimate this type of data. Howitt and Reynaud [13, 14] and Fragoso et al. [2] applied entropy methodology considering Markov processes in order to estimate the land uses weight. The studies about maximum entropy of Good [15] and Golan et al. [16] and the ones related to Markov processes and maximum entropy previously referred to livestock were also considered. Based on the methodology of Howitt and Reynaud [13, 14] and Fragoso et al. [2], we propose an analytical framework developed in the following three steps.
4
Advances in Operations Research (1) Convert the data of each livestock breeding class into NH, for the years in which information is available. (2) Disaggregate the data from a database created at aggregate level, based on the theory of maximum entropy and calculate the livestock weight in 𝑡 + 1, . . . , 𝑇. (3) Redistribute livestock numbers in NH according to estimated proportions and convert into animal numbers.
We assume that a sequence of livestock can be characterized by a first-order Markov process, considering 𝑃𝑟 decision states corresponding to 𝑃𝑟 possible strategies, indexed by 𝑗 ∈ {1, . . . 𝐽} with 𝐽 = 𝑃𝑟 . Assuming a second-order Markov process, the probability of moving from any decision state 𝑗 ∈ {1, . . . , 𝑝𝑟 } in the year 𝑡 − 1 to any decision state 𝑗 ∈ {1, . . . , 𝑝𝑟 } in the year 𝑡 can be calculated by multiplying the respective probabilities 𝐸NH𝑝𝑟𝑝𝑖 (𝑡 − 1) × 𝐸NH𝑝𝑟𝑝𝑖 (𝑡). This product of probabilities can be associated with a 𝑇𝑗𝑗𝑖 matrix of (𝑃𝑟 × 𝑃𝑟 ) dimension, which is called probability transition matrix [2, 13, 14]. Therefore, the creation of the prior information at the aggregated level is presented now. The dynamic process of livestock’s percentage weight estimation in NH, at aggregate level, is obtained based on the estimation of the probability transition matrix at aggregate level 𝑇𝑗𝑗 , using the generalized maximum entropy (GME) approach [16]. To fulfil this objective the following maximum entropy model, inspired in Howitt and Reynaud [13] and Fragoso et al. [2], was adapted to the aims of this work and the Alentejo region conditions: 𝐽
max 𝑇,𝑒
𝐽
𝑀
𝐻 (𝑇, 𝑒) = − ∑ ∑ ∑ 𝑇𝑗𝑗 𝑚 ⋅ log (𝑇𝑗𝑗 𝑚 ) 𝑗=1 𝑗 =1 𝑚=1 𝐽
This optimization program aims to maximize the entropy of the probability distribution {𝑇𝑗𝑗 1 , . . . , 𝑇𝑗𝑗 𝑀} ∀𝑗 and 𝑗 and {𝑒𝑗 1 , . . . , 𝑒𝑗 𝑁} ∀𝑗 and 𝑡, taking into account the conditionals determined by restrictions. Equation (9) defines the dynamic process of livestock numbers in NH. Equation (10) determines that the sum of transition probabilities in any Markov state is equal to 1. In the same way, (11) and (12) guaranty that the values of the variables of {𝑇𝑗𝑗 1 , . . . , 𝑇𝑗𝑗 𝑀} and {𝑒𝑗 1 , . . . , 𝑒𝑗 𝑁} are defined as a probability distribution, and between 0 and 1, thus respecting the formalism of Golan et al. [16]. According to Golan et al. [16] it is necessary to define a parameter 𝑤 = {𝑤1 , . . . , 𝑤𝑀} of 𝑀 ≥ 2 points with 𝑧1 = 0 and 𝑧𝑀 = 1 and with a {𝑇𝑗𝑗 1 , . . . 𝑇𝑗𝑗 𝑀} probability distribution. For errors 𝑒𝑗 (𝑡) we proceed in the same way reparameterizing the error through a support vector V = {V1 , . . . , V𝑁} with 𝑁 ≥ 2 points, so that errors are then defined in {𝑒𝑗 1 (𝑡), . . . , 𝑒𝑗 𝑁(𝑡)} as follows: 𝑁
𝑒𝑗 (𝑡) = ∑ V𝑛 ⋅ 𝑒𝑗 𝑛 (𝑡) .
Therefore, knowing the 𝑇𝑗𝑗 probability distribution we can easily create a database of information at aggregate level, which will later be used in the estimation process of probability transition matrixes at disaggregated level for calculating the number of livestock units. The formalization of the first step in the disaggregation process can be given through the following cross-entropy minimization program where the previously estimated transition matrix is used as prior information: 𝐻 (𝑇𝑖 , 𝑒) min 𝑖 𝑇 ,𝑒
𝐼
𝑁 𝑇−1
𝑃
⋅ log (𝑒𝑗 𝑛 (𝑡)) ,
𝑚=1
𝑀
∀𝑗 , 𝑡,
∀𝑗,
𝑗 =1 𝑚=1 𝑀
∑ 𝑇𝑗𝑗 𝑚 = 1,
𝑚=1 𝑁
∑ 𝑒𝑗 𝑛 (𝑡) = 1,
𝑛=1
𝐽
= ∑ ∑ ∑ 𝑞𝑗𝑖 (𝑡) ⋅ 𝑇𝑗𝑗𝑖 (𝑡) ⋅ 𝑠NH𝑖
𝑖=1 𝑗=1 𝑗 ∈𝜓
(9) 𝐽
𝑇
Subject to: 𝐸NH𝑝 (𝑡 + 1)
𝑛=1
∑ ∑ 𝑤𝑚 ⋅ 𝑇𝑗𝑗 𝑚 = 1
)
𝑝=1 𝑛=1 𝑡=𝑟+1
𝐼
+ ∑ V𝑛 ⋅ 𝑒𝑗 𝑛 (𝑡) ,
̂𝑗𝑗 𝑇
(14)
Subject to: 𝑄𝑗 (𝑡 + 1) = ∑ 𝑄𝑗 (𝑡) . ∑ 𝑤𝑚 ⋅ 𝑇𝑗𝑗 𝑚 𝑁
𝑁
𝑇𝑗𝑗𝑖
+ ∑ ∑ ∑ 𝑒𝑝𝑛 (𝑡) ⋅ log (𝑒𝑝𝑛 (𝑡)) ,
(8)
𝑗=1
𝐽
𝑖=1 𝑗=1 𝑗 =1
𝑗 =1 𝑛=1 𝑡=𝑟
𝑀
𝐽
= ∑ ∑ ∑ 𝑇𝑗𝑗𝑖 ⋅ log (
− ∑ ∑ ∑ 𝑒𝑗 𝑛 (𝑡)
𝐽
(13)
𝑛=1
𝑁
+ ∑ 𝜁𝑛 ⋅ 𝑒𝑝𝑛 (𝑡) ∀𝑝 = 1, . . . , 𝑃, 𝑛=1
(10) 𝐽
𝑇𝑗𝑗 ∈ [0, 1] ∀𝑗, 𝑗 ,
∑ 𝑇𝑗𝑗𝑖 = 1,
(11)
𝑗 =1 𝑁
𝑒𝑗 𝑛 ∈ [0, 1] ∀𝑗 , 𝑡.
(15)
∑ 𝑒𝑝𝑛 (𝑡) = 1,
(12)
𝑛=1
𝑇𝑗𝑗𝑖 ∈ [0, 1] ∀𝑗, 𝑗
(16)
𝑒𝑝𝑛 (𝑡) ∈ [0, 1] , ∀𝑝, 𝑡 (17)
Advances in Operations Research
5
in which {𝜁1 , . . . , 𝜁𝑁} with 𝑁 ≥ 2 points is the support vector associated with the {𝑒𝑝1 , . . . , 𝑒𝑝𝑁} probabilities of the error vector. This optimization model minimizes the cross-entropy of transition probability distribution and the entropy of probability distribution of errors (14) subjected to restrictions (15)–(17). Equation (15) is a data consistency restriction that guaranties the compatibility of information at aggregate level with disaggregated information and states that the sum of all the disaggregated values plus the error must be equal to the aggregate. The last two equations assure that 𝑇𝑗𝑗𝑖 and 𝑒𝑝𝑛 respect the properties of a probability distribution; that is, their sum is equal to 1. In our case, at the county disaggregation level, the aim is to obtain livestock data specifically for the county of Castelo de Vide. Thus, instead of going for the simultaneous disaggregation of information in all counties of Alto Alentejo’s NUT III, one may also choose the direct disaggregation of data regarding the county of Castelo de Vide. In order to do that, one may rewrite (15) as follows:
Disaggregation levels
Level I
NUTS II or Agrarian regions
Level II
NUTS III-subregions
Level III
Counties-Castelo de Vide
Figure 2: The territorial disaggregation levels.
coefficient limits. If a set of explanatory variables is available, it can be used and it will solve this problem. If not, one may take the premise that the year variation rate follows the livestock intended for breeding rate as follows:
𝐽
𝐸NH𝑝𝑟𝑝 (𝑡 + 1) = ∑ ∑ 𝑞𝑗𝑖 (𝑡) ⋅ 𝑇𝑗𝑗𝑖 𝑗=1 𝑗 ∈𝜓
(18)
𝑁
+ ∑ 𝜁𝑛 ⋅ 𝑒𝑝𝑛 (𝑡)
∀𝑝, 𝑡,
𝑛=1
where 𝐸NH𝑝𝑟𝑝 (𝑡 + 1) is the livestock’s percentage weight of the aggregate 𝑝. This is useful because it enables addressing situations in which we only have data on some territorial units comprising an aggregate and can materialize a second variant of the model proposed. ̂ 𝑖 one may reproduce So, from the estimations of matrix 𝑇 𝑗𝑗 the percentage of livestock numbers 𝑝 in NH at the moment 𝑡 + 1 as follows: 𝐽
𝐸NH𝑝𝑟𝑝𝑖 (𝑡 + 1) = ∑ ∑ 𝑞𝑗𝑖 (𝑡) ⋅ 𝑇𝑗𝑗𝑖 (𝑡) .
(19)
𝑗=1 𝑗 ∈𝜓
𝐸NH𝑖𝑝 (𝑡 + 1) = 𝐸NH𝑝𝑟𝑝𝑖 (𝑡 + 1) ⋅ 𝑠NH𝑖 .
(20)
Afterwards, the number of NH can easily be converted into real number of animals by means of the inverted use of each conversion index: 𝐸NH𝑖𝑝 (𝑡 + 1) 𝐼NH𝑝
= ((
𝐸NH𝑖𝑝 (𝑡 + 𝑥) 𝐸NH𝑖𝑝
(1/𝑥)
)
) − 1,
(22)
⃗ 𝑖 is the year variation rate of total livestock 𝑝 in which ∇𝐸𝑡 𝑝 and 𝑥 is the number of years after 𝑡 year. This method is based on strong assumptions and its application requires the opinion of experts. It should be applied only when we do not have a stable weight for each of the units to be disaggregated. In our case we may assume that the model may be applied in a simultaneous disaggregation process, where there is only the need to use the entropy process presented above and calculate the livestock numbers of specie 𝑝 for unit 𝑖, as follows: 𝐸𝑝𝑖 (𝑡 + 1) = 𝐸𝑝𝑟𝑝𝑖 (𝑡 + 1) ⋅ 𝐸𝑝𝑖 .
(23)
3. Results and Discussion
2.4. The Estimation of Livestock Number. Assuming that the number of NH in relation to land agricultural and forest occupation has already been calculated for having livestock number, one may simply make its redistribution into the NH percentage weight calculated as follows:
𝐸𝑝𝑖 (𝑡 + 1) =
⃗ 𝑖 ∇𝐸𝑡 𝑝
,
(21)
where INH is the conversion index of livestock effective 𝑝 into NH. Finally, if we want to estimate total livestock number, the data conversion in NH cannot be made due to the NH
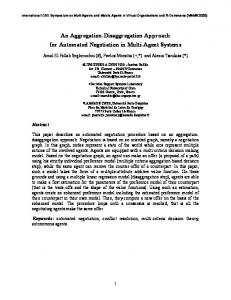
In order to obtain data on livestock for the county of Castelo de Vide, it was necessary to implement the disaggregation process in two stages. Figure 2 presents the disaggregation levels from I (for which there is available information), to II (subregions), and to III (the counties’ level). The application of the proposed methodology to Portuguese data implied also some adaptations. The first one is due to the almost complete lack of data on the classes of conversion into NH in the GAC of 1989, which makes the application of the methodology be only done correctly after 1999, despite the fact that its application to the 1990s can be made with partial inclusion of livestock intended for breeding. The second point is the existence of limited data in certain classes of land occupation. This makes it impossible to carry out a correct simultaneous disaggregation process for the Alto Alentejo’s counties and allows for only the application of a direct disaggregation process to the breeding livestock.
6
Advances in Operations Research
Table 2: Estimated livestock intended for breeding in Castelo de Vide. Animal/year Bovines of 1 to 2 years Bovines over 2 years Sheep Goats
2003 342 2833 7111 857
2005 371 2862 6625 808
(Source: model results).
A third consideration is related to the conversion into NH. The relation between livestock breeding and the agricultural and forest occupation cannot be made when calculating the total number of livestock units (including younger animals) due to the conversion limits. However, similar methodologies can be used to calculate the percentage weight of each animal, supposing that the evolution of the total number of animals follows the same pattern more than breeding livestock. Given these considerations, the following implementation lines of the model were used: (1) direct disaggregation of breeding livestock for the county of Castelo de Vide considering 2 years (2003 and 2005), (2) direct disaggregation of breeding livestock for the county of Castelo de Vide considering a historical sequence, (3) simultaneous disaggregation of the total number of livestock in the subregions (NUTS III) of the Alentejo region, and (4) direct disaggregation of the total number of animals’ proportions and their further conversion into number of animals for the county of Castelo de Vide. In the application of the model different support limits of parameters and error had to be defined. Based on previous studies, it was established the parameter 𝑤 can be defined with 𝑀 = 3 points, being therefore considered as 𝑤 = {0, 0.5, 1} for all models. In order to establish the limits of error components, the Pukelsheim’s three-sigma rule recommended by Golan et al. [16] was used and we selected the value of the limits that presented better improvements in the results during the calibration process, following the empirical findings of previous studies [2, 9]. In the estimation process of the number of NH, regarding the livestock intended for breeding in 2003 and 2005, the following limits V = {−1, 0, 1} to the disaggregation level of the subregion of Alto Alentejo (NUTS III) and the county of Castelo de Vide were assumed. For the other breeding livestock disaggregation model, V = {−2, 0, 2} was considered at the first disaggregation level and V = {−5, 0, 5} at the second disaggregation level. On the procedure of reconstructing historical series and total livestock numbers of all categories, the limits V = {−0.7, 0.7} in the simultaneous disaggregation process and V = {−1, 0, 1} in the direct disaggregation process were considered. The results are presented next, following the lines of implementation presented before. The main livestock classes considered in the county of Castelo de Vide for the first model’s implementation line were bovine cattle, sheep, and goats (Table 2). However, the need to convert breeding livestock into NH has led to consider
different divisions regarding bovine cattle, such as bovines of 1 to 2 years of age and bovines over 2 years of age. In the second model’s line of implementation aimed to calculate partial estimations of breeding livestock and to obtain the historical reconstruction of predominant livestock, one considered 𝑡 = 7 years and only cows over 2 years of age in regard to bovine cattle, due to lack of data. Livestock numbers were calculated, using data from 1989 (Table 3). The third implementation line, which allowed the disaggregation of data simultaneously for the different subregions, includes the following livestock types: cows over 2 or more years of age; other bovines, sheep and goats; and a series of 𝑡 = 7 years (Table 4). It allowed disaggregating correctly the numbers of the different types of livestock, which were obtained directly from the model of cross-entropy minimization (14) to (17). The fourth line of implementation of the model, which aimed to calculate the total proportions of livestock, considered cows over 2 or more years of age; other bovines, sheep and goats; and a series of 𝑡 = 7 years (Tables 5 and 6). 3.1. Validation. The results’ validation was made based on crossreference with statistical data, using the opinion of experts and technicians from the Portuguese Ministry of Agriculture with a good knowledge of the area of application and on the calculation of the weighted prescription absolute deviation (WPAD) which measures the estimation deviations from real statistics data from the 1999 GAC. The WPAD was calculated considering the absolute deviation at the disaggregated level for each livestock specie and class, considering the total deviation for the disaggregated territorial units: 𝑖 𝑦𝑝 − 𝑦̂𝑝𝑖 , WPAD𝑖𝑝 = 𝑦𝑝𝑖 𝑦𝑝𝑖
𝑝
WPAD𝑖 = ∑ WPAD𝑖𝑝 (24) 𝑝=1
and at aggregate level according to the aggregation of disaggregated units: 𝐼
WPAD = ∑ 𝑖=1
𝑠𝑖 ⋅ WPAD𝑖 , 𝑆
(25)
where 𝑦̂𝑝𝑖 is the estimated livestock number 𝑝 at disaggregated territorial level 𝑖, 𝑦𝑝𝑖 is the respective observed value from the available statistics, and 𝑠𝑖 /𝑆 is a ratio that allows weighing the WPADi according to the representativeness of disaggregated unit 𝑖 in the aggregate. The 𝑊𝑃𝐴D𝑖𝑝 expresses the true importance of the percentage deviation in each livestock class regarding the observed values (PAD) weighed by its true importance at disaggregated level 𝑖. The WPAD𝑖 corresponds to the sum of 𝑊𝑃𝐴D𝑖𝑝 values by livestock number 𝑝, which allows giving the idea of the real total deviation for the values of the unit 𝑖. The WPAD corresponds to the weighted sum of the WPAD𝑖 by the weight of each unit 𝑖 regarding the total value or aggregate. In the first implementation line, the procedures for the estimation of livestock intended for breeding in the county of
Advances in Operations Research
7
Table 3: Estimated historical data of livestock intended for breeding in Castelo de Vide. Animal/year Cows over 2 years Sheep Goats
1993 2223 8763 2306
1995 2337 8364 2420
1997 2395 7641 2498
1999 2498 7888 2609
2003 2529 7389 2678
2005 2585 6659 2819
(Source: model results).
Table 4: The number of livestock estimated for each of the Alentejo’s subregions. Sub-reg AL
AA
AC
BA
Animal/year Cows over 2 years Other bovines Sheep Goats Cows over 2 years Other bovines Sheep Goats Cows over 2 years Other bovines Sheep Goats Cows over 2 years Other bovines Sheep Goats
1993 28268 21644 179618 17372 37397 27587 304412 39252 49929 39271 421675 25420 23052 18182 445558 34769
1995 31141 25202 180408 15101 41563 32405 308444 34429 55082 45789 424054 22124 25764 21479 454103 30672
1997 35006 21911 181575 15929 46753 28190 309809 36343 62253 40022 426898 23458 29119 18776 457018 32535
1999 41437 29734 200462 14918 55957 38676 345219 34420 74023 54548 471786 22061 35162 25993 513064 31097
2003 42275 36036 185408 10777 58030 47641 323374 25274 76205 66705 437254 16071 37077 32561 486988 23226
2005 46558 35631 165832 8314 64842 47793 291845 19780 85054 66846 392328 12555 42378 33415 447089 18603
AL-Alentejo litoral subregion; Alto Alentejo subregion; Alentejo Central subregion; Baixo Alentejo subregion. (Source: model results).
Castelo de Vide are close to the opinion of experts consulted, showing also trends that can be observed in this county. In the second implementation line, the model aiming to estimate part of the breeding livestock was validated for 1999 by comparison with the data from the GAC of 1999. This analysis showed that the model produced satisfactory data, since the WPADi is below 15%, which is a threshold usually recommended by some authors, such as Fragoso et al. [2] or Hazell and Norton [17]. Following this criteria for the PAD𝑖𝑝 , only the data on breeding goats are not valid. The simultaneous disaggregation process of livestock developed in the third line of implementation was only applied to the Alentejo’s subregions and presented values that are very close to the reality, since the WPAD is only 6% in 1999. In terms of WPADi only Alentejo Central stands out with an 8.11 percentage and the percentage in Alto Alentejo is about 3.16. Finally, in the last line of implementation of the model presented, the direct disaggregation procedures have shown a reliable disaggregation of the proportions of total livestock effective in Castelo de Vide. The PAD𝑖𝑝 values for Castelo de Vide are very low for sheep (12%), which is the predominant livestock category. All the other categories show PAD𝑖𝑝 values under 15%, with exception of the cows with 2 or more years
of age that present a 30% PAD𝑖𝑝 . It was obtained an acceptable WPADi for Castelo de Vide with 14.6%, above the thresholds recommended by Fragoso et al. [2]. 3.1.1. The Disaggregation Informational Gain. The heterogeneity of the information calculated was measured through the disaggregation informational gain (DIG) used by Howitt and Reynaud [13, 14]. According to the authors the measure of information gain from disaggregation should have the following properties: “(i) the measure of potential gain increases monotonically with the heterogeneity of the disaggregated sample; (ii) the gain from disaggregating a uniform set of samples is zero; (iii) the measure is invariant to changes in the number of disaggregated samples and the variability of the aggregated sample; (iv) the measure has an informationtheoretic interpretation” [14]. The DIG is based on the cross entropy between the observed values of breeding livestock at aggregated and disaggregated level and on the cross entropy between the breeding livestock estimated by the model and the observed values. The DIG measure increases as the units’ posterior distributions become closer to the true distributions. In the case of perfect disaggregation, the DIG is equal to 1. This measure may, however, be subjected to some critics,
8
Advances in Operations Research Table 5: Proportion of total livestock numbers estimated in Castelo de Vide.
Animal/year Cows over 2 years Other bovines Sheep Goats
1993 0.128 0.075 0.655 0.142
1995 0.134 0.083 0.665 0.117
1997 0.148 0.073 0.658 0.121
1999 0.15 0.085 0.667 0.097
2003 0.154 0.105 0.669 0.071
2005 0.177 0.111 0.653 0.059
(Source: model results).
Table 6: Livestock numbers in Castelo de Vide. Animal/year Cows over 2 years Other bovines Sheep Goats
t2003 1934 1319 8402 892
t2005 2128 1334 7849 709
(Source: model results).
considering the fact that a model with considerable errors might cause negative values. The formula can be presented as follows: DIG = 1 −
∑𝐼𝑖=1 ∑𝑃𝑝=1 𝐸̂𝑝𝑖 ⋅ ln (𝐸̂𝑝𝑖 /𝐸𝑝𝑖 ) ∑𝐼𝑖=1
∑𝑃𝑝=1
𝐸𝑝 ⋅ ln (𝐸𝑝 /𝐸𝑝𝑖 )
=1−
𝐶𝐸̂ , 𝐶𝐸
(26)
where 𝐸̂𝑝𝑖 are the estimated shares of livestock 𝑝 in unit 𝑖 and 𝐸𝑝𝑖 are the real shares on the disaggregated unit 𝑖, and 𝐸𝑝 is the aggregated share of livestock 𝑝. The same informational measure can be defined for each of the disaggregated units: 𝑝
DIG = 1 −
∑𝑝=1 𝐸̂𝑝𝑖 ⋅ In ( 𝐸̂𝑝𝑖 /𝐸𝑝𝑖 ) 𝑝
∑𝑝=1 𝐸𝑝 ⋅ In ( 𝐸𝑝 /𝐸𝑝𝑖 )
.
(27)
Due to the nature of DIG and its line of use in previous studies [14], it was only applied to the third line of implementation of the model: the simultaneous disaggregation process. Here, the DIG revealed a percentage of recovered information of around 60.3%. This is a very satisfactory level of recovered information which overcomes the levels obtained by Fragoso et al. [2] for the Alentejo area. The DIGi revealed also very satisfactory results: the best one was obtained in Alentejo Litoral with 78%, which is followed closely by Baixo Alentejo with 75%. The other two subregions revealed values near the 60%: Alto Alentejo and Alentejo Central presented 59% and 57%, respectively.
4. Concluding Remarks The methodology used enables us to solve the problem of lack of data regarding the main categories of breeding livestock with satisfactory results. It was possible to demonstrate that dynamic methodologies based on Howitt and Reynaud [13, 14], which initially were applied to the data disaggregation of agricultural occupation, are flexible enough to be applied with adaptations, to other types of data and still obtain satisfactory results. However, there are some recommendations that should be made for future studies in this area.
The proposed model was applied using a direct disaggregation process for the county of Castelo de Vide due to the lack of data about land uses. However, if there are valid data regarding several land uses, including the relation between them and livestock, they should be inserted in future studies. This will imply better development of the land use disaggregation model, but it also may give the chance of developing a combined approach, considering the simultaneous disaggregation of the livestock breeding in extensive systems and the main land uses. This is a considerable challenge, since the studies carried out until now showed unsatisfactory results in several cases. A future application of the methodology proposed should also consider variations in the relation between agricultural and forest occupation and the number of livestock NH through time, as well as the application to a set of counties or territorial units. Taking into account these issues, we envisage the development of this methodology in a more complex way, with the inclusion of new databases, since in spite of its simplicity it allows us to obtain relevant information regarding animal production and management. This methodology could have an important role, considering that some regulations and policy measures may influence the livestock breeding activity, hence leading to change its relation with agricultural and forest occupation. A good knowledge of the real situation will allow providing the ability of better understanding the consequences under different scenarios.
Conflict of Interests The authors declare that there is no conflict of interests regarding the publication of this paper.
Acknowledgment The authors gratefully acknowledge partial financial support from FCT, program POCTI.
References [1] R. Chakir, “Spatial downscaling of agricultural land-use data: An econometric approach using cross entropy,” Land Economics, vol. 85, no. 2, pp. 238–251, 2009. [2] R. Fragoso, M. D. B. Martins, and M. R. V. Lucas, “Generate disaggregated soil allocation data using a Minimum Cross Entropy Model,” WSEAS Transactions on Environment and Development, vol. 4, no. 9, pp. 756–766, 2008.
Advances in Operations Research [3] L. You, S. Wood, and U. Wood-Sichra, “Generating Global Crop Distribution Maps: From Census to Grid,” Contributed paper prepared for presentation at the International Association of Agricultural Economists Conference, International Association of Agricultural Economists, Gold Coast, Australia, August 2006. [4] L. You, S. Wood, U. Wood-Sichra, and J. Chamberlin, “Generating plausible crop distribution maps for sub-saharan Africa using a spatial allocation model,” Information Development, vol. 23, no. 2-3, pp. 151–159, 2007. [5] INE-Instituto Nacional de Estat´ıstica, Inqu´erito a` Estrutura das Explorac¸o˜ es Agr´ıcolas, INE, Lisbon, Portugal, 2006. [6] INE-Instituto Nacional de Estat´ıstica, Estat´ısticas Agr´ıcolas, INE, Lisbon, Portugal, 2007. [7] M. Carvalho and M. Godinho, A Nova reforma da Pol´ıtica Agr´ıcola Comum e suas consequˆencias num sistema agr´ıcola mediterrˆaneo de Portugal (The New Common Agricultural Policy Reform and its implications in a mediterranean agricultural system of Portugal), 2004, http://www.sober.org.br/. [8] DRAPAl, Direcc¸a˜o Regional de Agricultura e Pescas do Alentejo, Programa de Desenvolvimento Rural-Alentejo (Alentejo Rural Development Programme), DRAPAL, 2007. [9] M. B. Martins, R. Fragoso, and A. Xavier, “Spatial disaggregation of agricultural data in Castelo de Vide, Alentejo, Portugal: an approach based on maximum entropy,” JP Journal of Biostatistics, vol. 5, no. 1, pp. 1–16, 2011. [10] R. Jongeneel, “An analysis of the impact of alternative EU dairy policies on the size distribution of dutch dairy farms: an information based approach to the non-stationary Markov chain model,” in Proceedings of the 10th Congress of the European Association of Agricultural Economists, Exploring the Diversity in the European Agri-Food-System, European Association of Agricultural Economists, Saragoc¸a, Spain, August 2002. [11] K. Karantininis, Information Based Estimators for the NonStationary Transition Probability Matrix: An Application to the Danish Pork Industry, Unit of Economics Working Papers, The Royal Agricultural University of Copenhagen, 2001. [12] A. Tonini and R. Jongeneel, “Modelling the Dairy Farm Size Distribution in Poland Using an Instrumental Variable Generalized Cross Entropy Markov Approach,” Paper prepared for presentation at IAAE—104th EAAE Seminar Agricultural Economics and Transition: What was expected, what we observed, the lessons learned, European Association of Agricultural Economists, Corvinus University of Budapest (CUB), Budapest, Hungary September 2007. [13] R. Howitt and A. Reynaud, “Spatial Disaggregation of production data by maximum entropy,” in Proccedings of the 10th Congress of the European Association of Agricultural Economists, Exploring the diversity in the European Agri-Food-System, European Association of Agricultural Economists, Saragoc¸a, Spain, August 2002. [14] R. Howitt and A. Reynaud, “Spatial disaggregation of agricultural production data using maximum entropy,” European Review of Agricultural Economics, vol. 30, no. 3, pp. 359–387, 2003. [15] I. Good, “Maximum entropy for hypothesis formulation, especially for multidimensional contingency tables,” The Annals of Mathematical Statistics, vol. 34, no. 3, pp. 911–934, 1963. [16] A. Golan, G. Judge, and D. Miller, Maximum Entropy Econometrics: Robust Estimation with Limited Data, John Wiley & Sons, NewYork, NY, USA, 1996.
9 [17] P. Hazell and R. Norton, Mathematical Programming for Economic Analysis in Agriculture, Macmillan, New York, NY, USA, 1986.
Advances in
Operations Research Hindawi Publishing Corporation http://www.hindawi.com
Volume 2014
Advances in
Decision Sciences Hindawi Publishing Corporation http://www.hindawi.com
Volume 2014
Journal of
Applied Mathematics
Algebra
Hindawi Publishing Corporation http://www.hindawi.com
Hindawi Publishing Corporation http://www.hindawi.com
Volume 2014
Journal of
Probability and Statistics Volume 2014
The Scientific World Journal Hindawi Publishing Corporation http://www.hindawi.com
Hindawi Publishing Corporation http://www.hindawi.com
Volume 2014
International Journal of
Differential Equations Hindawi Publishing Corporation http://www.hindawi.com
Volume 2014
Volume 2014
Submit your manuscripts at http://www.hindawi.com International Journal of
Advances in
Combinatorics Hindawi Publishing Corporation http://www.hindawi.com
Mathematical Physics Hindawi Publishing Corporation http://www.hindawi.com
Volume 2014
Journal of
Complex Analysis Hindawi Publishing Corporation http://www.hindawi.com
Volume 2014
International Journal of Mathematics and Mathematical Sciences
Mathematical Problems in Engineering
Journal of
Mathematics Hindawi Publishing Corporation http://www.hindawi.com
Volume 2014
Hindawi Publishing Corporation http://www.hindawi.com
Volume 2014
Volume 2014
Hindawi Publishing Corporation http://www.hindawi.com
Volume 2014
Discrete Mathematics
Journal of
Volume 2014
Hindawi Publishing Corporation http://www.hindawi.com
Discrete Dynamics in Nature and Society
Journal of
Function Spaces Hindawi Publishing Corporation http://www.hindawi.com
Abstract and Applied Analysis
Volume 2014
Hindawi Publishing Corporation http://www.hindawi.com
Volume 2014
Hindawi Publishing Corporation http://www.hindawi.com
Volume 2014
International Journal of
Journal of
Stochastic Analysis
Optimization
Hindawi Publishing Corporation http://www.hindawi.com
Hindawi Publishing Corporation http://www.hindawi.com
Volume 2014
Volume 2014