2014 ASE BIGDATA/SOCIALCOM/CYBERSECURITY Conference, Stanford University, May 27-31, 2014
Discovering Community Structure in Dynamic Social Networks using the Correlation Density Rank Zeynab Bahrami Bidoni 1, Roy George2 Department of Computer and Information Systems Clark Atlanta University, Atlanta, GA
[email protected] 1;
[email protected] 2
changing organizational structure, such as who is becoming more powerful or the shifting of the power structure.
Abstract Recent research has produced advances in the understanding of communities within a dynamic social network. A “community” in this context is defined as a subgraph with a higher internal density and a lower crossing density with respect to other subgraphs. In this paper, we describe a novel and efficient distance based ranking algorithm, called the “Correlation Density Rank” (CDR), which is utilized to derive the community tree from the social network and to develop a tree learning algorithm that is employed to construct an evolving community tree. Also, we present an evolution graph of the organizational structure, through which new insights into the dynamic network may be obtained. The experiments, conducted on a datasets, both synthetic and real, demonstrate the feasibility and applicability of the framework. Keywords: Dynamic social network; Organizational structure; Community discovery; Evolution analysis; Web ranking; Crawling; Correlation Density Rank.
1. Introduction Community detection is an important research issue in social network analysis (SNA), where the objective is to recognize related sets of members such that intra-community associations are denser than inter-communities associations [110]. Researchers have presented various methods to extract communities from a Social Network (SN) data. . In particular, discovering the organizational structure of communities in an SN has been identified as an interesting but challenging problem [11,12] Examples of important applications include characterizing potential candidates for viral marketing, finding members of criminal groups, discovering affinity groups, etc. [12] While there has been research on finding key members in an SN [11-15] the results have limited power to supply a complete view of the organizational structure. In the real world, social networks are constantly changing and evolving. New members may join the network, existing members may quit from the network, and associations among members constantly change over time. Therefore, the approach should be capable of supporting the exploration of organizational structure dynamically. Some earlier research has provided approaches to detecting communities from a dynamic social network [16-19] These approaches discover changes of communities in an SN, but do not answer questions related to
©ASE 2014
In the workflow area, organization mining has also been the focus of past research [20-22]. The workflow area research has emphasized the exploration of organizational structure in the unit from event logs of information systems. Research efforts [23-25] have also addressed determining the hierarchy in an SN, where hierarchy has a similarity to an organizational structure. In this paper we use the notion of a community tree data structure to represent organizational structure and its evolution. This approach is similar to that presented by Qui and Lin [26] where the ranking of nodes is based on PageRank algorithm with iteration complexity of the order of logN [27]. However, the technique presented here has no iteration complexity and is not susceptible to network anomalies [28] such as spider-traps, dead-ends, etc. and the “rich-get-richer” problem [29]. Consequently, the approach in this paper is algorithmically efficient and produces communities and organizational structures with better accuracy. We propose a novel density measure, the Correlation Density Rank (CDR), as the basis of community and organizational structure detection. We apply a density based method to describe the relationship between nodes linked by edges. In comparison with other earlier Density based algorithms [30-32], this approach offers several advantages (1) the CDR is a generalized formulation, which permits the weighting of different correlation types, . (2) a more realistic solution where with important neighbors have more priority than lesser ones is employed, and (3) optimization of the CDR is easier, since the number of parameters needed for tuning is smaller. The contributions of this paper are as follows: (1) Developing an algorithm to derive the community tree from the SN. (2) Developing a tree learning algorithm to generate the evolving community trees. (3) Proposing an approach for representing the evolution of the organizational structure based on the evolving community trees. The rest of the paper is organized as follows. Section 2 introduces the concept of community tree and proposes an approach for deriving the community tree from a static social network. Section 3 presents the methods for analyzing the evolution of organizational structure in a dynamic SN. Section 4 provides the experimental results. Section 5 offers concluding remarks.
ISBN: 978-1-62561-000-3
1
2014 ASE BIGDATA/SOCIALCOM/CYBERSECURITY Conference, Stanford University, May 27-31, 2014
2. Discovering the organizational structure in a static social network 2.1 Organization structure of a network Song and Van [33] developed a definition of organizational model, where the organizational model consists of organizational units (e.g. functional units), roles (e.g. duty), originators, and relationships (e.g., hierarchy). In this paper, we assume that the organizational structure of an SN is a hierarchy that represents communities (or units) and subordinations of members in the SN. However, the derived hierarchical organizational structure of an SN is not necessarily reflected in a real-world organization [26]. For instance, there exists real organizations that are cannot be characterized as an academic network, nor in a blogosphere. In this case for a network formed by e-mail communications, we may not be able to exactly determine to what extent the relationships can be mapped to the real-world organizational structure. Therefore, in deriving the organizational relationships, subordination describes the relationship between two members where the leader is the most likely and more important destination of information flow starting from the subordinate. i.e., the subordinate has a closest interaction with the leader in comparison with others while the leader has a higher possibility of attracting interaction with the nodes across the entire network in comparison to the subordinate nodes. The importance of members in the SN, is depicted through a score, the m-Score, which is equivalent to CDR value of a member. The m-Score value of a member would be its certainty on attracting interaction with all nodes through whole network. The higher the score is, the more important the member is. We use a data structure, called the community tree, to represent the SN organizational structure. Definition 1. (Community Tree): Let N n1,..., n k be a collection of members in an SN, CT is a tree, and NULL is the root of the tree, and every member in N is referred to as a node in the tree. Each member ni in CT it has a unique parent node
n j where m-Score ( n j ) > m-Score ( ni ). If the parent node of
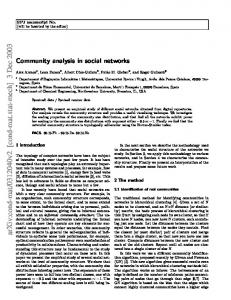
ni is the root node NULL, ni is called a core of the tree. A core and its descendants compose a community. To derive the organizational structure, we calculate the mScore for every member and then attempt to find the immediate leader of every member in a network. Further, we construct the community tree using m-Score and subordinations. After having constructed the SN community tree, we can discover communities and obtain the SN organizational structure. An example of a community tree is illustrated in Fig. 1 where node 1 and node 5 are cores of community 1 and community 2, respectively.
This research is funded in part by the Army Research Laboratory under Grant No: W911NF-12-2-0067 and Army Research Office under Grant Number W911NF-11-1-0168. Any opinions, findings, conclusions or recommendations expressed here are those of the author(s) and do not necessarily reflect the views of the sponsor.
©ASE 2014
Figure 1. An example of a community tree [26].
SN may be regarded as a graph indicating information flows among members. The relationship of SN members can be obtained by analyzing information flows [34]. The process of determining SN information flow is similar to a random walk on a graph [35,36]. Given a graph and a starting point, the starting point's neighbor is selected at random, and the next start point is moved to this neighbor then a neighbor of this new start point is selected again at random and so on. The random sequence of points generated in this process is a random walk on the graph. The expected lengths of random walks on the graph, can be used to derive randomized shortest paths (RSP) dissimilarity [37,38]. The RSP dissimilarity, which has its foundation in statistical physics, may be used to compute the shortest path distance for all pairs of nodes of a graph in closed form. Recently [39] has generalized distance from the RSP framework based on the Helmholtz free energy between two states of a thermodynamic system with a distance measure, the free energy distance. We employ the RSP measurement method in [39] as the distance between nodes, but with one major difference: we consider customized initial cost for edges such that, along with finding shortest path between nodes. The random walker intelligently selects the most important neighbor resulting in lower cost and smaller distance. Combining RSP with m-Score of every node, we can find an immediate leader for every member in an SN (see section 2.3). The SN community tree is derived in this way. Our framework includes the following steps to derive the community tree: a) Employ the novel “Correlation Density Rank” method to ranking nodes as the m-Score for every node in an SN; and, b) Combine RSP with m-Score of every node to derive a community tree. 2.2 Calculating m-Score To calculate the m-Score for every node, we need to investigate each node's importance in a network. Those nodes that link many important nodes are also themselves important. Such a process is very similar to PageRank based algorithms [40]. PageRank is a link analysis algorithm that produces a global “importance” ranking for every web page by analyzing
ISBN: 978-1-62561-000-3
2
2014 ASE BIGDATA/SOCIALCOM/CYBERSECURITY Conference, Stanford University, May 27-31, 2014
links among web pages. A fast and efficient page ranking mechanism for web crawling and retrieval remains a challenging issue. Recently, several link based ranking algorithms like PageRank, HITS, OPIC and etc. [27] have been proposed. We propose a novel method, Correlation Density Rank, based on finding more frequent and influential RSP. The CDR considers the entropy of distance between nodes as punishment and is used to compute ranks of nodes. Hence, there will be a larger traffic amongst shortest path of nodes, if the distance becomes smaller. As proved in [41], if the distance between i and j was less than the distance between i and k, then, i’s rank effect on j is more than on k, in other words, the probability that a random surfer reach j from i is more than the probability to reach k. Therefore, the objective is to minimize punishment so that a node with less distance entropy to have a higher rank. The Shannon entropy is a measurement of system uncertainty [42]. The larger the Shannon entropy is, the more uncertainty the system will be. If the CDR value of a node in complex network is the smallest, then the uncertainty of its distance distribution from other nodes is the greatest. On the contrary, while the CDR value of a node in complex network is very high, then the uncertainty of its distance distribution from other nodes is the smallest. Moreover, the more popular nodes are, the more linkages other nodes tend to have to them or are linked to by them. The proposed algorithm is analogous to the weighted PageRank algorithm [43], assigning larger rank values to more important (popular) nodes instead of dividing the rank value of a node evenly among its out-link nodes. We assign each out-link node a value proportional to its popularity (its number of in-links and out-links). The popularity from the number of in-links and out-links is recorded as W ijin and W ijout , respectively.
On j
W ijout
Op
p R ( ni )
Where O n j and O p represent the number of out-links of node n j and node p, respectively. R( ni ) denotes the reference node list of node ni . These equations has two exceptions, first, if node n j is a dead-end (which may be easily determined from the frequency matrix), we let W ijout that is a very small number less than 1. Second, W ijout , W ijin 1 , that means R( ni )={ n j } we add
to sum of the reference nodes’
frequency out/in-link. An algorithm for calculating the mScore of members in a social network is described as follows. Algorithm 1. Calculating m-Score for members: Correlation Density Rank (CDR) Input: social network G Out: vector of m-Score for all members R 1.
Initialize cost distance matrix C
C [ i , j ] lo g
(1 e x p ( f ij ))
1 w
in out ij w ij
(The logarithm of (1 exp( f ij )) based on (1 w ijinw ijout ) ) 2.
W ijin is the weight of link between node ni and n j
Finding the matrix of RSP dissimilarities by employ the algorithm of [43]: { W ← P ref exp( C ) 1
calculated based on the number of in-links of node n j and the
Z ← I W (Note that I W 1 I
number of in-links of all reference nodes of node ni .
S ← Z C W Z (Z )
I nj
W ijin
Where I n j and I p represent the number of frequency inlinks of node n j and node p, respectively. R( ni ) denotes the reference node list of node ni .
2
W
3
...)
C ← S ed sT T R S P ← C (1 )C
Ip
p R ( ni )
0 1
}
3.
M ← Normalize matrix R S P on rows
4.
For each node ni ( 1 i k ) compute the entropy of related row from matrix M: 1 k Ei ← M ij Ln (M ij ) Lnk j 1
W ijout is the weight of link between node ni and n j calculated based on the number of frequency out-links of node n j and the number of out-links of all reference nodes of node
di ← 1 Ei Ri ← d i
ni . 5.
©ASE 2014
W W
k i 1
di
Return R
ISBN: 978-1-62561-000-3
3
2014 ASE BIGDATA/SOCIALCOM/CYBERSECURITY Conference, Stanford University, May 27-31, 2014
Where f ij is the number of frequency from node ni to node
n j . if f ij 0 , let C [i , j ] or a very big number. P ref is the transition probability matrix that Pijref is equal to the rate of f ij divided by sum of frequency between node ni and all its references nodes. k is the number of members in social network (or nodes on G). The parameters , and are input values determined by user. controls the effect of frequency on the cost function which restrict cost ratio with respect to our defined infinite constant. β is the influence of the cost on the walker’s selection of a path, and is equal to inverse of temperature at Helmholtz free energy in thermodynamical system [39]. is the weight factor by which the leadership status of members will be distinguished by the amount of contact density comes in or goes out. Also, in step 2, d s diag (S ) is the vector of diagonal elements of S, and e is the identity matrix. Note that A ◦ B and A ÷ B are elementwise product and division, respectively. For calculating step 2, we use the easier way of computing the matrix Z [38]. The values of Ri ( 1 i k ) indicate the final m-Scores of members in the social network. 2.3 Deriving the Community Tree The m-Score of every member is combined with the normalized RSP matrix (M) on the graph to derive the community tree from an SN. The RSP matrix helps us to find the most likely and closest interaction for each node, and mScores determine whether there is the leadership relation between two nodes with closest interaction. Algorithm 2. Deriving Community Tree: CT_Deriving Input: Social network G Output: Community Tree CT 1. CT← [null,…,null] 2. R ← Correlation Density Rank (G); 3. For each member ni {
node of node i. After all the operations end, we obtain a community tree CT represented in an array where CT[i] indicates the parent node of node i. A null value of CT[i] indicates that there is no the immediate leader of node i. Hence node i is the core of community. If a node does not have both immediate leader and belongingness, is called private node. Node i and its descendent compose a community. The mScore of each member shows the member's importance in the community. The parent of each node is its immediate leader. 3. Exploring evolution of the organizational structure in a dynamic social network In Section 2, we develop the algorithms to derive a static community tree from a static SN. However, the static community tree does not do a good job in presenting the evolution of the organizational structure in the dynamic SN, because it does not consider intra time-step evolutions. To present the evolution of organizational structure in a dynamic SN, we aggregate the change of an SN during different time periods, and then derive community trees. We further construct the evolving community tree from the two closest community trees. Hence, the evolving community tree can accurately present evolution of organizational structure over time. The Best-first search algorithm explores a graph by expanding the most promising node chosen according to a specified rule [44]. Motivated by the idea of the Best-first search, [26] uses tree edit distance [45] (defined as the least cost of edit operation to change a tree to another tree) as a measure of distance (similarity) between the two trees. We propose a new algorithm to derive the evolving community tree with more efficiency and less complexity than previous ways. Because constructing community tree in our idea is based on RSP, we only need to compute linear combination of RSP of two static community trees and use the new RSP to drive evolving CT using algorithm (2) without any iteration. However, [26] generated a collection of candidate evolving community trees and then chose the candidate having the minimum ES score (by means of scoring function, which measures distance errors among evolving CT, previous period CT and current period CT) as a solution of each iteration. 3.1 Tree learning algorithm We propose a tree learning algorithm to derive an evolving community tree from two static community trees. The constructing process is as follows:
k← arg j min (M ij )
(1) Obtain a collection of members in the evolving community tree N ce N pre N cs where N pre and N cs are
if R[k] > R[i] CT[i] ← k } 4. Return CT
collections of members in the previous time period static community tree and current time periods one respectively;
Initiating a random walks at node i, we can find ending node j with the most likely correlation density, from the normalized RSP matrix M, by starting. If the m-Score of node j is much greater than that of node i, we regard j as the parent
(2) Compute the RSP for all pair members in the evolving community tree, where α is a smoothing factor, RSP ceRSP (1 ) RSP . For those members that pre cs
©ASE 2014
ISBN: 978-1-62561-000-3
4
2014 ASE BIGDATA/SOCIALCOM/CYBERSECURITY Conference, Stanford University, May 27-31, 2014
appear in the evolving community tree but not in the current community tree, if their m-scores are less than a threshold , we regard them as retired members and remove them from the evolving community tree; (3) According to the definition of algorithm 1, having matrix, we can compute Rce , M ce matrices. Then, by applying them into Algorithm 2, we construct the evolving community tree. RSP ce
Algorithm 3. Learning evolving ECT_Learning RSP Input: RSP matrices RpreSP , cs
community
tree:
c i 1 is the evolving entity of ci . We say c1 ,...,c n is a lifeline of the community c1 . Community c k C is called the entity of the life-line. A life-line depicts an evolving process of one community in the dynamic SN. Definition
3.
(supporter):
Given
a
life-line
CL c1,c 2 ,...,c n , we call the members as supporters of CL if they appear in CL not less than δ times with n . In Definition 3, is a parameter set by the user. If there is a life-line CL c1,c 2 ,c3 ,c 4 and 3 , that means only members appearing in the life-line not less than 3 times are supporters of CL . Exploring life-lines in the evolution graph and their supporters helps to better understand dynamic social networks. For example, we can discover the backbone of criminal group or detect loyal members in a forum over time.
Output: Evolving community tree CT e 1.
N ce N pre N cs
2.
RSP ceRSP (1 ) RSP pre cs
3.
N ce N ce n i N ce N cs m score (n i )
4. 5. 6.
Do step 3,4 of algorithm 1 to find Rce , M ce Employ algorithm2 to find CT ce Return CT ce
3.2 Exploring dynamic social network After deriving a series of evolving community trees, we exploit these trees to discover the evolution path of the organizational structure and to study the properties of the dynamic SN. We can consider four types of relationships among communities to generate an evolution graph that represent evolution of the organizational structure. Fig. 2 provides examples to illustrate the relationships among communities [26].
Definition 4. (Activeness of community): Let node p be the core of community c , we use the m -Score of p to indicate the activeness of community c . Activeness of community is a metric for the extent to which associations occur among members of the community over one period of time. We can use Activeness of community to reveal hot communities, which may reflect on-going hot topics in the forum or new activities in a criminal group. 4. Experiments In order to implement our approach, first, we consider a small dynamic, synthetic network (Fig. 3) during five time intervals.
Figure 2. Relationships between communities.
Combing evolution graph and dynamic SN properties, we can obtain insights into the dynamic SN. Definitions 2–4 define key properties of the dynamic SN [26]. Definition 2. (life-line): Let C c1 ,...,c n be a collection of communities. For each community c i C with i n ,
©ASE 2014
Figure 3. A small dynamic network with frequency contacts between nodes
ISBN: 978-1-62561-000-3
5
2014 ASE BIGDATA/SOCIALCOM/CYBERSECURITY Conference, Stanford University, May 27-31, 2014
After employing algorithms 1 and 2, we find static community trees for each periods of time separately that shown in Fig. 4 The arrows indicate leadership, and The parameters let 0.1, 0.001, 0.5, 0.01, 0.7 .
Now, in this stage, we have information about leadership during each periods of time separately that is not enough for the complete analysis. So, with the purpose of achieve a good understanding of the network’s changing trends during intra time-step evolutions, we employ algorithms 3 to drive the evolving community trees shown in Fig. 6.
Figure 6. The evolving community trees for the synthetic network
The analysis of outputs clarifies some events that were happened during time:
Figure 4. Static community trees for each periods of time separately.
Also, the trend of member’s activity in Fig. 5 May be seen.
0.35 0.3 Activity
0.25
A
0.2
B
0.15
C
0.1
D
0.05
E
0 0
2 4 periods of time
6 Figure 7. Evolution of communities for the synthetic network.
Figure 5. Evolving member’s activity for the synthetic network
©ASE 2014
a) From T1 to T2, the leader of member E changes from C to B. b) From T2 to T3, leader of members A and E change from B to D. c) From T3 to T4, 1) splitting on B, C. 2) evolving between C, D. 3) emerging the core D related to members B, E. d) From T4 to T5, splitting on member E.
Fig. 7 Shows the evolution map of communities in which Community that its core is D has most stability (number of
ISBN: 978-1-62561-000-3
6
2014 ASE BIGDATA/SOCIALCOM/CYBERSECURITY Conference, Stanford University, May 27-31, 2014
supporters divided by the size, named stability. Size is the average number of members in each community in life-lines.) among all communities and its supporters are members B and C. While the straightforward application of this method is in social networks, this technique is appropriate for all type of complex networks, and the type of network does not influence the results. We have used the real frequency data from a computer network of 288 nodes to evaluate this approach. Data for a period of 100 seconds, divided into 10 equal periods of 10 seconds each, is used to construct evolving community trees and draw evolution map of communities they are. After employing algorithms 1, 2 and 3, we have reached evolving community trees as shown in Appendix. The arrows indicate hierarchical leadership between nodes, and the parameters let 0.1, 0.001, 0.5, 0.01, 0.7 .
and a real world datasets, and produce good results. The experiments show that the framework can well present the organizational structure of a social network. We obtained experimentally the following insights: (1) those communities with long life-line and great stability likely correspond to a real organization; and (2) the cores in an organizational structure, in general, are either the leaders of the organization or the agents of these leaders. Although it is possible that the organizational structure discovered from a social network is not perfectly in line with the real world organization, the approach described here helps reach new understandings of the organization based on the power of attracting information flow and the interaction closeness.
References [1]
[2]
[3]
[4]
[5] [6] [7]
Figure 8. Evolution of communities for the real data set.
Fig. 8 Shows the evolution map of communities, in which the community that its core is node 82 has 185 size, longer lifeline (30 second) and the largest stability with amount of 0.7 among all communities. As expected, the algorithm identifies routers and hubs as the cores of communities.
[8]
[9]
[10]
5. Conclusions Exploring organizational structure in a dynamic social network has a broad range of applications, such as monitoring gang activities, fraud detection, and improving performance of viral marketing. In this paper, we present our research effort in extracting organizational structure from such data to obtain a better understanding of the social network. We formalize a community tree data structure for the purpose of representing the social network organizational structure, and propose a framework to explore the dynamic behavior of the participants of the community. The framework is composed of three main parts: (1) defining the “Correlation Density Rank”, to rank the nodes to acquire a community tree from the static social network; and, (2) a tree learning algorithm, which employs the tree edit distance as a scoring function, to generate the evolving community tree; These algorithms were applied to a synthetic
©ASE 2014
[11]
[12]
[13] [14]
[15]
[16]
Chekuri, C.S., et al. Experimental study of minimum cut algorithms. in Proceedings of the eighth annual ACM-SIAM symposium on Discrete algorithms. 1997. Society for Industrial and Applied Mathematics. Ding, C.H., et al. A min-max cut algorithm for graph partitioning and data clustering. in Data Mining, 2001. ICDM 2001, Proceedings IEEE International Conference on. 2001. IEEE. Hagen, L. and A.B. Kahng, New spectral methods for ratio cut partitioning and clustering. Computer-aided design of integrated circuits and systems, ieee transactions on, 1992. 11(9): p. 1074-1085. Long, B., et al. Community learning by graph approximation. in Data Mining, 2007. ICDM 2007. Seventh IEEE International Conference on. 2007. IEEE. Newman, M.E., Fast algorithm for detecting community structure in networks. Physical review E, 2004. 69(6): p. 066133. Newman, M.E. and M. Girvan, Finding and evaluating community structure in networks. Physical review E, 2004. 69(2): p. 026113. Shi, J. and J. Malik, Normalized cuts and image segmentation. Pattern Analysis and Machine Intelligence, IEEE Transactions on, 2000. 22(8): p. 888-905. Wu, A.Y., M. Garland, and J. Han. Mining scale-free networks using geodesic clustering. in Proceedings of the tenth ACM SIGKDD international conference on Knowledge discovery and data mining. 2004. ACM. Xu, X., et al. SCAN: a structural clustering algorithm for networks. in Proceedings of the 13th ACM SIGKDD international conference on Knowledge discovery and data mining. 2007. ACM. Zhou, D., et al. Probabilistic models for discovering e-communities. in Proceedings of the 15th international conference on World Wide Web. 2006. ACM. Goyal, A., F. Bonchi, and L.V. Lakshmanan. Discovering leaders from community actions. in Proceedings of the 17th ACM conference on Information and knowledge management. 2008. ACM. Xu, J.J. and H. Chen, CrimeNet explorer: a framework for criminal network knowledge discovery. ACM Transactions on Information Systems (TOIS), 2005. 23(2): p. 201-226. Carley, K.M., et al., Toward an interoperable dynamic network analysis toolkit. Decision Support Systems, 2007. 43(4): p. 1324-1347. [14]. Ma, H., et al. Mining social networks using heat diffusion processes for marketing candidates selection. in Proceedings of the 17th ACM conference on Information and knowledge management. 2008. ACM. Xu, J.J. and H. Chen, Fighting organized crimes: using shortest-path algorithms to identify associations in criminal networks. Decision Support Systems, 2004. 38(3): p. 473-487. Kumar, R., J. Novak, and A. Tomkins, Structure and evolution of online social networks, in Link mining: models, algorithms, and applications. 2010, Springer. p. 337-357.
ISBN: 978-1-62561-000-3
7
2014 ASE BIGDATA/SOCIALCOM/CYBERSECURITY Conference, Stanford University, May 27-31, 2014 [17] Tang, L., et al. Community evolution in dynamic multi-mode networks. in Proceedings of the 14th ACM SIGKDD international conference on Knowledge discovery and data mining. 2008. ACM. [18] Tantipathananandh, C., T. Berger-Wolf, and D. Kempe. A framework for community identification in dynamic social networks. in Proceedings of the 13th ACM SIGKDD international conference on Knowledge discovery and data mining. 2007. ACM. [19] [19]. Zhou, D., et al. Discovering temporal communities from social network documents. in Data Mining, 2007. ICDM 2007. Seventh IEEE International Conference on. 2007. IEEE. [20] Bertino, E., E. Ferrari, and V. Atluri, The specification and enforcement of authorization constraints in workflow management systems. ACM Transactions on Information and System Security (TISSEC), 1999. 2(1): p. 65-104. [21] Song, M. and W.M. van der Aalst, Towards comprehensive support for organizational mining. Decision Support Systems, 2008. 46(1): p. 300317. [22] Zur Muehlen, M., Organizational management in workflow applications–issues and perspectives. Information Technology and Management, 2004. 5(3-4): p. 271-291. [23] Clauset, A., C. Moore, and M.E. Newman, Hierarchical structure and the prediction of missing links in networks. Nature, 2008. 453(7191): p. 98-101. [24] Grobelnik, M., D. Mladenic, and B. Fortuna, Semantic technology for capturing communication inside an organization. Internet Computing, IEEE, 2009. 13(4): p. 59-67. [25] Li, H., et al. Scalable community discovery on textual data with relations. in Proceedings of the 17th ACM conference on Information and knowledge management. 2008. ACM. [26] Qiu, J. and Z. Lin, A framework for exploring organizational structure in dynamic social networks. Decision Support Systems, 2011. 51(4): p. 760-771. [27] Singh, A.K. and P. Ravi Kumar, A comparative study of page ranking algorithms for information retrieval. International journal of electrical and computer engineering, 2009. 4(7): p. 469-480. [28] Rajaraman, A. and J.D. Ullman, Mining of massive datasets. 2012: Cambridge University Press. [29] Cho, J., S. Roy, and R.E. Adams. Page quality: In search of an unbiased web ranking. in Proceedings of the 2005 ACM SIGMOD international conference on Management of data. 2005. ACM. [30] Jin, Hong, Shuliang Wang, and Chenyang Li. "Community detection in complex networks by density-based clustering." Physica A: Statistical Mechanics and its Applications 392.19 (2013): 4606-4618. [31] Qi, X., et al., Optimal local community detection in social networks based on density drop of subgraphs. Pattern Recognition Letters, 2014. 36: p. 46-53. [32] Gong, M., et al., Novel heuristic density-based method for community detection in networks. Physica A: Statistical Mechanics and its Applications, 2014. 403: p. 71-84. [33] Song, M. and W.M. van der Aalst, Towards comprehensive support for organizational mining. Decision Support Systems, 2008. 46(1): p. 300317. [34] Gruhl, D., et al. Information diffusion through blogspace. in Proceedings of the 13th international conference on World Wide Web. 2004. ACM. [35] Craswell, N. and M. Szummer. Random walks on the click graph. in Proceedings of the 30th annual international ACM SIGIR conference on Research and development in information retrieval. 2007. ACM. [36] Lovász, L., Random walks on graphs: A survey. Combinatorics, Paul erdos is eighty, 1993. 2(1): p. 1-46. [37] Yen, L., et al. A family of dissimilarity measures between nodes generalizing both the shortest-path and the commute-time distances. in Proceedings of the 14th ACM SIGKDD international conference on Knowledge discovery and data mining. 2008. ACM. [38] Saerens, M., et al., Randomized shortest-path problems: Two related models. Neural Computation, 2009. 21(8): p. 2363-2404. [39] Kivimäki, I., M. Shimbo, and M. Saerens, Developments in the theory of randomized shortest paths with a comparison of graph node distances.
©ASE 2014
[40]
[41]
[42]
[43]
[44] [45]
Physica A: Statistical Mechanics and its Applications, 2014. 393: p. 600-616. Brin, S. and L. Page, The anatomy of a large-scale hypertextual Web search engine. Computer networks and ISDN systems, 1998. 30(1): p. 107-117. Zareh Bidoki, A.M. and N. Yazdani, DistanceRank: An intelligent ranking algorithm for web pages. Information Processing & Management, 2008. 44(2): p. 877-892. Anand, K. and G. Bianconi, Entropy measures for networks: Toward an information theory of complex topologies. Physical Review E, 2009. 80(4): p. 045102. Xing, W. and A. Ghorbani. Weighted pagerank algorithm. in Communication Networks and Services Research, 2004. Proceedings. Second Annual Conference on. 2004. IEEE. Pearl, J., Heuristics: intelligent search strategies for computer problem solving. 1984. Bille, P., A survey on tree edit distance and related problems. Theoretical computer science, 2005. 337(1): p. 217-239.
ISBN: 978-1-62561-000-3
8
2014 ASE BIGDATA/SOCIALCOM/CYBERSECURITY Conference, Stanford University, May 27-31, 2014
Appendix
35 08 2
99
55 3 1
00 2
159
214
44
79
154
266
55
225
7 1
194
215
28
12
224
1
72
178
36
75
14
66
252
81
237
96 1
24
260
112
13 69
162
101
32
7 4
243
57
272 83 108
55
2 72
232
48 1
11 4
24
129
203
260
111 20
84
267
77 2
129
23
137
162
14
140
89
68 222
61 1 219
175
138
81
150
50
255
25
213
207
61
101
144
24
18 83
39
15 2
21 4 34
63 1
1 2
119 67
44
20 5 93 19 2
17
14 3
71
25 0
164
32
82
35
42 1
78
24 8
6 5
75
1 48
275
2 42
26 5 1 25
178
40 51
68
4 5 22
27 5
40 1
26
12
169
9 7
22 9
59
49 2
52
228
32 1
55 2 18 5
15 6
273
159
27 2 5 4
158
204
35
114 03 1
71 2
2 15
11 5
28 1
36 2
87
268
18 6
24 1
175
72
41
23 4
21 2
23 7
67
2 22
6
15 9
2 56
136
140
269
153
116 35
16
97 1
18
103
78 164
38
24 3
4 2 59 114
99 127
107
16 1
19
67
37
3
33
63 1
41
38 206
230 53
244
14
217
256
232
129
124
98 1
263
120
18 4
243
200 54
85
2 1
166
187
17 5
115
18
14 8
183
41 2
158
63
238
188 4 8
246
8
119
192 37 2
40 52 1
27 0
211
94
266 132
268
10
0 8
236
30
146 176
274
21 0
72
144
142
57 1
6 2
229
79
61
26 3
257
46
142
174
141
2 9
5 9
234 245
6 3
4 5
45
207
102
24 4 1
12 0
194
6 8
0 5
65
30
8
56
55
39 47 1
77 253
2 61
80
67
242 276
16 48
133
2 6
222
63
105
62 205
173
25 2
9
22
249
187
195
NU LL 76
95
164
26 7 258
73
3
81
252
185
251
224
57
55 2 13 9
220 87
11 5
78
19 3
124
11
26
93 165
75 2
247
209 178
17 4
2 04
53
200
10 9
30 2
143
19 6
38
83
64 2
153
15 4
19
79
227
203
87 93
242
213 276
15 6
23 16
130 27 1
115
23 0 1 66
57
216
14 2
242
3 89
11 29
1 65
84 22 0
66
25 4 13 3
86 71
83
248
15
90 179
228 215
138
128
3 1
34 1
169
104 262
135 150
77
202
99
5 9
233 221
229
110
58
11 7 211
1 27
73 87
1 52
25 249 238 17
12 7 21 184
20 5
22 3 14
272
31
6 2
66 91
99
2 21 18 8
1 32 31
1 86
108
44 177
196
51
21
62
219
262
125
97
37 270
25 7
20 7 11 7
76 2 74 11 1
1 58
2 53
1 36 20 2
2 13
58
20
2 69
98 1
75 201
47
59 2
25 6 240
146
1 63
69
27 135 02 1
239
16 0
228 14 1
206
23 2
212
119 8 6
260
271 41 131
104
29
155
1 38 88
25 8 16 1
68
1 08
1 40
79 215 155
191
181 253
7
26 5
63
227
32
105 20 38
2 25 13 1
13 9
24 0
67
262
01 2
2 35
24 7
61
11 9
1 78
2 50 10 5
12 9
186 18 2
204 173
82 248 74 144
74
14 1
19 1
24 9 7
17 3
10 1 14 3
25 9
26 7
82
2 31
91
10 4
17 3
64 2
24 5
2 48
23 3
55 257 270
NUL L
22 7 18
2 29 10 2
2 32
11 7
47 1
22
2 73
94 19 4
42 1 23 1
154
30
18 0
67 1
6 35 2
195
34
60 2 38
11 0
31 2
20
66 1
1 8
37 1
231
145
59 1 26 1
160
82 76
254
34 1
2 14
1
118
70
225
8
224
139 218 200
185
2 62
21 8
97
9 8
29
20 19 165
70
NUL L 8 4 9 1
209
15 7
12
95 32
19 2
17 2
54 2 71
52
13
22 3 179
16 2
25 0
53 1
112
186
147 87
188
28
14 2 99
1 83
76 89 1
61
91 101
88 136 11
191
151
15
42 65
19 8 2 77
1 79
2 11 10
2 09
70
65 2 16
114
17
1 23 14 5
47
1 12
27 6 15 6
1 28
93
1 69
265 22 6
167
46 1
1 95
10 2
21 3
52 2
26 6 1 55
75 2
10
234 25 30 1 22 1
233
245 40
06 1 236
54 1 30 13
23
45 2
60 172
189
141
86
1 16 1 37
1 24
2 39
74
2 52
2 43
14 7
5 6 134
20 1
2 60
9
4 9
27 4
72
1 75 24
21 5
180
88 1
07 1
50
36
240 20 1
157
1 13
18
19 9
80
1 81
18 9
85
1 93
1 87
26 4
51
26 3
1 64
48
25 20 3
97
1 62
28
2 68
2 08
56 1 00 5 1
76
2 46
22 3
1 35
39
243
172
155
52
11
238
40 77
20 5 8
16 69
9 8
11 109
221 13
91
1 50
1 09 63
92 15
62
136
41 1
15 73
209 50
245
2 9
54
1 20 193
90
26
2 10
20 7
8 4 41 2
84 1
10 6
19 7
12 5
60
199 160
223
138
53
NUL L 17
30 27
15 4
263
176 65 1
80
11
74
254
25 1
247
0 3
29
8 2
203 27 6
23 8
9 1
124
18 9 19 8
212 206
6
37 53 2
112
7
194 247
8
267
17 4
20 0
43 137
39 58 2
25 1
17 9
91 1
16 2 1 4
130
269
237
225
3 2
0 7
47 31 1
32 2 88
217
190 81 1
44 2
23 1 266
161
05 1
7
15 3
10 51 1
233
239 23 5
120 18 2
42 2 18
16 2
183
13
146
77
46 2
10 2 22
269 19 3 26 1 20
110 9
17 4
48 1
12
108 72
189
135
21
18 7
45 1
42
270
244
204 23 0
10 4
95
167
247
41
259 16
71
236
152
22 1 75 204 222
75
38
101
63
69
94
50
239
259
133
25 6
50 1
116 6
21
10 3
81
94
120
196
16
15
186
68
100
31
8 7
62 2
224
229
265 210 264 107
46 110
241
231
95 1
3 7
185
140
163
39
32
254 104
139
77
129
166
266
218
45
23 9
11
180
253
9
191 219
105 195
240 217 19 4
155
198
21 91
71 128
138
6 4
127
84
114
261
136
69
22
117 220
237
8
137 112
70 125
208 225
181
89
73 52
133
25
273
83
179 40
113 159 274
275
257 29
9
6
1
183 154
139 130
169 84
233
20 2
251 28
82
158
143
33
46
176
7
58 33
272 10
207
36
21 0 31
197
118 109 177
44
246
85 208
213 78 09 1
86
212 35
102
100
206
18 22 8
19 3
90
147
235
92 66 199
6 5
203 261
18 7
57
23 113
156
177
111
18 4
227 18 1
110
0 6
148
169 175
45
259
192
46
161 19 2
250
65
163 16
65
178
56
51
143
85
223
145
3
202
197
277
176
60
131
183
209
74
258
160 22 0
132
08 1
256
13
17 255 37
44 2
64 1
20 2
103
1 76 1 57
19 214 184
180
1 67 1 85 2 40
1 80
31
47
53 196
15 2
2 55
27 0
92 205
258
74 2 11 2
22
85 135
48
58
52
264
58
107
0 8
197
34 2
173 125 117
10 6 2 71
97 260
10
156 158
167 273
51
10 3
1 46 100
21 2
231
257
1 34
192 NUL L
90
128 41 2
271
2 36
22 7 26 7
33
248
160
22 4
57 90
53
230
1 77 34 2
86
144
88
68 2
11 8
269
131 1 6
37
14
249
2 51
1 07 33
172
15 3 23 1
165
123
172
2 06
268
145
263
97
20 8
119 62
124 33 1
276 6
199
36
174 250
93
150 246
Time Period 1
Evolving between Time Periods 1 and 2
235
Evolving between Time Periods 2 and 3
Evolving between Time Periods 3 and 4
Evolving between Time Periods 4 and 5
1 43
198
172 6
97
213 203
209
205
11 6
181 173 3 8
2 41
200
202 89
196 8
77
165
243
1 40
146
11 7
3 9
11
59
1 29
25 275
16
56
86 228
156
100
189
1 47 18
237 15 194
272
99
80
29
165
165
23
27 7
87
198
56
63 8
146
26 4
1 48
10 7
43
23 9
232 1 12
144
143
54
200
118
1 83
35
89
36 135
23 9
24 3
145 86
127
NU LL
88
174
36
1 45
2 9
158
103
3
63
225
257 93
19 4
10
108
2 31
150
111
40
02 2
176
191
160 174 2 33
8 6
53
138
1 4 2 11
30
74
48
274
230
17
172
131
160
50
66
2 46
24 8
19 7
13 3 2 06
16
2 14
17 7
42
141
1 65
44 91
21
13 0
178 12
1 20
13 9
15 2
55
2 73
57
10 5
1 36
34
22 4
195 26 8 209
74
14 6
274
229
270
14 3
210 22 6
203
212
104
21 7
42
169
86
164 103
135
190 11 5
1 32
60
166
106 72
56
15 1
79
240
1 85
236
39
75
21 6
25 134
116
2 75
38
3
40
184
227
115
17
2 54 13 1
19
43
1 81 262
22 8
9
110
94
274 1 11
25 2
15
128 1 57
60
2 29
200
19 7
99
2 49
145
142
225
138 124
154 2 21
238 202
20 1
242
29
37 6
2 31
1 53 193
2 43 1 80
10
1 94
1 66
128
271
13
183
76 80 33
12 9
158
11 2
31
78
24 2
40
144
253 1 50
155
2 45
58
20 5
23 6
8
41
71
1 86 141
95
25 6
132
234
55
218
187
268
88
137
25 7
1 92
198 11 8
67 251
54
196 24 4
79 2 32
157
1 59
238
184
224 210
18 8
40
53
91 231
117
63
1 93
243
185 17 4
208
160
46
152 85
87
99
230
10 6
65
21 6 23
109 24 0
1 24 200
2 33 1 23 28
94
267
3
22 7
100 161
10
163
244
87
179
2 20
25
276 22 7
140
48
159
276 181
275 26 6
1 27 92
1 65
66
21 1 108 103
12
123 173
8
2 62
93
172 50
191
70 1
239
20
161
69 101
15 6
207
26 264 82
30
1 31
209
255
258
61
1 73 100
11 3
267 2 61 163
213 72
1 72
25
24 1
90 125
13
62
73
270
10 7 26 5
2 66 52
19 9
2 50
83
81 84
47
27 7
79 7
2 54
13 35
57
195 18 7
1 69
1 62
17 6
147
32
56 51
1 77 1 40
1 73
34
99
15 3
27 2
14 1 14 2 75 2 30
10 2
11 1
93
164 259 68
3
211
260
53
21 0
2 69
154
74
18
18 3
184 43
97
61 1 75
1 50 28
191 46
2 51
2 48
50 97
21 8
224
14 8
13 3 12 7
1 01 1 39
75
45 260
54 21
191
232
123
16 2
110
1 29 53
12
31
2 09
12 4
8 4
21 5
2 35
1 78
19
1 20 14 1
13 0
2 01 68
237
18 0 18
26 2 1 42
60
1 60
21 8
8 5 20
0 28
47 74
220
24 6
55
148
8
17 5
27 5
17
20
101 192
22
222
47 109
92 44
10
11 9
39
114
1 46
2 19
174
26 3
2 03 24 5
20 6
37
61
62
38
219
14
18 9
175 77
33
150
20 5
208 2 11
218
89
NU LL
119
37
1 38
255 27 6
6
15 8
186
200
78 04 2
113
75
19 8
248
156
45
230
19 2
2 63
2 44 83
76 48
26 6
116
214
18 1
1 79 133
229
86
141
52
89 250
155
114
21 5 2 61
84
1 18 15 6
81
212 128
10
242
203
124 211 69
193
76 5 1 7
72
119
44 255
3
41 3 8
73 197
95 4 3
161
197 7 5 41
178
6 17
59 2 10 7
177
183
46 234 1 89
147
258
125
261 254
2 37
129
2 08 219
222
85 66 13
1 23
227
1 25 1
65 1 80 15 3
1 07
22
190
65
151
153 207
26
73
12 11 1 36 2
65 240
162 18 7
87
38 77
72 137
254
154 209
238
2 23
60 164
73 1 216
86 1 57
71
1 55
135 195
40 1
185 264
7
79
10
23 3
2 04
134
163 241 184
266 26 5
233
1 5
244
31
41
2 53
40 166
13
177
53 2
08 1 101
11 9
80 1 11 2
21
20
19 6
262
120
37
2 3
260
130 243
27 0
25
268
0 5
45 2 67
4 5
80
8 2
5 8
127
9
0 9
162 148
4 1
256
102
8 7
269 117
9 124
37
112
252
201
178 33
154
110
97
251
109
1 9
221
159
207 1 86 204 118
133
66
38
199
19 260
179 79
85
12 9
137 8 4 102
9 0 267
179
44
83 70
22 1
21 71
39
273
2 24 7 8 69
245 73 68 238
60
244
188
214
15 5
26 2
253
130 225 259 92
77
23
33
129
90
52 94
193
113 229
146
1 43
1 04
13 7
221
26 5
1 72
120 220
23 2 246
207 80
19
67
2 34 261
81
21
102
2 57
67 69
27 1
32
152 81 57
19 3
82
259
135
8
212
1 15
245
2 22
26 7
35
11 5 266
167
1 05
218
1 04
53
23 7
143
103
185
54
223
76
80
2 48 252
257
2 47
13 5
187
128 1 66
1 44
31 12 5
247
113
241 2 50
36
215 86
263 250
164
105
272
93
9 5 277
114 236
16 7
2 35
21 4
264
13 1
26 4
46
116
32 159
32 219
235
270
55
1 99
21 5
23 203
2 06
223
NULL
2 50
242
206
1 37
142 78
28
27 2
13 9
242 13 0
1 33
177 17 6
191
11
1 04
153 36
2 49 51
258
154 85
90
92
204
70
N ULL
247 142
110
22 8 2 04
221
65
194
35
74
263
239
240
12
14
62
24 7
22
13 2
186 89 30
91 1 96
26
251 95
230
70
222
84 214
14 8
192
18 0
17
29
71
2 02
26 0
63
39
1 95
9 47
238 71
48
119 7
105
118
225
2 63 256
252
108 58
82
2 39
2 34
42
27 2
6 69
2 31
11 1
1 79 162
13 4
10 3 21 2
160
131
254 101
52
22 18 9
1 56
255
14 7
253
51 24 9
2 59
25 2 208
2 41 2 25
144
50 1 12 5
16
83
23 1 97
11 1 99 35
19
105
93
94 145
66
19 4 50
277
33
210 16 9
36
195 223
31
267
205
115
67
6 2
15 2 231
14 7
0 7 246 N ULL
232
68
213
81
1 25
102
112
2 35
233
44 1
228
26 8 27 4
18 7
206
26
76
18 215
261
265 276
20
1 98 55 2 97
139 62
234
72
47
63
18 9
16 3
145 2 8
159 104 223
183
2 46
18 178
248
10 9
15
57
2 02
2 36 142
11 6
24 7
1 276
220
249
274
41
55
22 4 1 85
24 77
2 28
227
88
1 64
12 8
74 1
46
192
85
1 61 7 8 16 167
95
113
16
181
249
123 235
20 73
117
2 77
1 96
22 2
91 2 70
56
199
28
210
258
75
265 27 1
9
69 2
2 8
257
88
17 6
20 7
92
11
26
107
2 37 1 08
240
1 09
30
21 6 94
22 9
58
5 2 15
17
1 66
20 5
227 30 256 99
144
15
21 3
100 139
12 0
16 7
269
155
2 56
163
1
61
212
1 00
15 2 161
Evolving between Time Periods 5 and 6
©ASE 2014
140
84
176
167
26 9 61
Evolving between Time Periods 6 and 7
Evolving between Time Periods 7 and 8 The evolving community trees
ISBN: 978-1-62561-000-3
2 19
Evolving between Time Periods 8 and 9
1 14
Evolving between Time Periods 9 and 10
9