has focussed on discovering and exploiting co-change [30] and on reconstructing fine-grained ..... reporting system, and collaborate using a dedicated devel- oper mailing list. ... Web Application Server, Websphere. The other system is ...
Discovering New Change Patterns in Object-Oriented Systems Stephane Vaucher, Houari Sahraoui and Jean Vaucher GEODES, Universit´e de Montr´eal CP 6128 succ Centre-Ville Montr´eal, QC, H3C 3J7 Canada Email: {vauchers,sahraouh,vaucher}@iro.umontreal.ca
Abstract Modern software has to evolve to meet the needs of stakeholders; but the nature and scope of this evolution is difficult to anticipate and manage. In this paper, we examine techniques which can discover interesting patterns of evolution in large object-oriented systems. To locate patterns, we use clustering to group together classes which change in the same manner at the same time. Then, we use dynamic time warping to find if a group of classes is similar to another when we ignore the exact moment when changes occur. Groups that exhibit distinctive evolution properties are potential candidates for new evolution patterns. Finally, the pertinence and usefulness of the candidates is determined by perusal of the release notes and the architecture. In a study of two industrial open-source libraries, we discovered four new types of change patterns. These new patterns are useful in that they can be associated with welldefined maintenance activities such as restructurings and bug-fixes.
1. Introduction It is now generally accepted that the effort of maintaining and evolving software surpasses the cost of creating new applications [2, 14]. Because software must constantly evolve to meet the needs of stakeholders, understanding the nature and distribution of change is important to the management of ongoing maintenance. When the high cost of evolution was first recognised over thirty years ago [1], little was known about how software changes. Much has improved since then and lately research has focused on the identification and detection of change patterns, archetypal trends in the way software components evolve [25, 3]. The majority of the work in this area has focussed on discovering and exploiting co-change [30] and on reconstructing fine-grained changes in software systems [7, 8, 16]. Co-change occurs when different parts of
a system are changed at the same time. This work provides an answer to the question: “If this changes, what else changes?”, useful information for maintainers changing an existing code base. Change reconstruction consist of comparing two versions of a program and identifying what types of changes occured, often refactorings. Other significant change patterns of interest can be described by observing how classes change over the evolution of a system. Such patterns include classes that grow very quickly and idle (or dead) classes. Rules to detect these classes have been defined and applied [25]. Other as yet unidentified patterns could be useful if they could be identified and found to be related to maintenance activities. To this end, we decided to use clustering on change histories of classes in large deployed systems. Clustering groups classes with a similar change history, and each group implicitly represents a potential change pattern. This technique is however sensitive to noise in input and fortuitous coincidences. Consequently, many discovered groups are not useful, but the effort in verifying the quality of the grouping is relatively small compared to the cost at analysing change in separate classes. Many researchers have based their work on detailed information available only within a development environment, such as error logs and transactions from systems like CVS. However, outside stakeholders generally do not have access to this information. Outsiders include users who subcontract the development and maintenance of systems, managers who may want to evaluate - independently - the quality of development, and newcomers who must acquire knowledge of a system before they can extend it. We work from the perspective of such outsiders. Since documentation may be missing or incorrect, in this situation, the only reliable source of information is the different versions of the systems. Our objective is to provide a flexible technique to extract change patterns from software releases and verify how this can be used to guide software maintenance efforts. We test our approach on the evolution of two opensource libraries which have the same characteristics as com-
mercial software: they are relatively large, they are used in many commercial products, and have both evolved for more than five years. Potential patterns are extracted by the clustering and are analysed both internally, looking at the classes contained, and externally using release notes. Finally, we use dynamic time-warping to compare the different groups. This technique detects cases when a pattern repeats itself at a different moment in time. In this study, we managed to identify four distinct change patterns and we could use this information to improve our understanding of the evolution of both systems. The remainder of this paper is organized as follows. The following section presents previous work on change patterns. Then, Section 3 describes the different types of change that we use and how we extract them from the successive versions of a system. The identification technique of groups of classes having similar evolution is presented in Section 4. Section 5 describes and analyse groups of classes found in a exploratory study of two systems. Section 6 discusses our results and their applicability to help understand a code base. Finally, concluding remarks are given in Section 7.
2
Related Work
In recent years, much research has focussed on understanding evolution and change in software. Two important aspects are the definition of change patterns and their detection or recovery in existing systems. In this section, we will provide an overview of related work. Arguably the first catalog of change comes from the study on refactorings [9]. Refactoring is a particular type of change which restructures a system without affecting its external behaviour. Detection of these refactorings has been done using change in software metrics [6], multicriteria matching[12, 17], and by using and structural differences in design [27]. A comprehensive list of available techniques is published in [15]. Apart from refactoring, co-change patterns are a wellresearched problem which seeks to identify entities that change at the same time [30]. Often this is done by scanning version control systems for files that are checked-in either in the same transaction or within a small time window. This information can then be used by developers to identify hidden links between files. This was done using association rule mining [28, 30] and dynamic time-warping [3]. Others have used this information to help understand a code base. Gˆırba et al. [11] propose the use the co-change of metrics to define patterns. In OO systems, method, class and package level metrics are used. For example, they define “parallel complexity” as a pattern affecting a set of methods that change in complexity at the same time. Some patterns like shotgun surgery are sign of bad quality. To locate these
patterns, they use formal concept analysis. Other change patterns are defined by Lanza et Ducasse [19] who propose the use of an evolution matrix to identify changes in metrics representative of distinctive change patterns. More recently, Xing et al. in [25] and [26] propose a design differentiation algorithm to do the same. In the first paper, they present simple characterisations like “active class”, i.e. a class that changes a lot, and “idle class”, i.e. a class that changes very little. In the second paper, they use changes in design to classify class evolutions into groups like “rapidly developing”. They rely on these classifications to analyse the evolution of an open-source library. Their work is one of the few that underlines the problem of origin analysis. The majority of the approaches above require detailed auxiliary information in addition to the code versions. For example, co-change discovery often identifies pairs of classes changed together, but it generally requires access to the version control system, making it a useful tool for developers, but a poor one from a management perspective. When a company outsources the maintenance of software systems, it needs to characterise the general change patterns in the system to judge the quality of the maintenance. Furthermore, in this case, the detailed input required is not generally available. We differ from previous work by using clustering on change history and seeking to mine change patterns affecting significant groups of classes without a priori definitions. Every system is unique, both in terms of the skills and the experience of its developers, and in terms of its environment (e.g. technological). It is therefore reasonable to assume it contain some particular evolution patterns which cannot be known beforehand. It is for is this reason why we propose the use of clustering algorithms to identify groups of classes changing is similar ways.
3. Modelling Change The history of classes in a system is modelled as a sequence of versions as defined in [10]. Every version of a class is associated with its equivalent in the next version. The difference (change) between every successive version of a class is measured and is combined into an evolution blueprint which represents the complete change history of the class. Generally, a class existing at version i is associated with the class in version i + 1 that has the same name and the same package. However, when there is a name change or a move (package change), building coherent histories is not obvious. This problem is called origin analysis [24]. We align classes using information retrieval techniques as described in Section 3.1. For every class evolution, its level of change is calculated
using two measures of change: relative implementation change, IC (Section 3.2) and relative functional changes, FC (Section 3.3). All changes to a class are included in a vector that defines its evolution blueprint. For a system with n versions, a class contains n − 1 implementation changes and n − 1 functional changes as follows: Blueprint = (IC1−>2 , ..., ICn−1−>n , F C1−2 , ..., F Cn−1−>n ).
Blueprints are then used both to characterise a change profile of individual classes as well as the changes in patterns.
3.1. Origin Analysis Origin analysis is the process of deciding if, between two different versions of a system, a new program entity is really new, or if it a renamed, moved or somewhat changed version of an entity in the previous version [24, 12]. A comparison of different techniques is presented in [15]. Details of our technique, while interesting, are beyond the scope of the present paper as they are not central to the thrust of the present paper. Suffice it to say that we used a computer-assisted approach similar to that of Godfrey et al. [12], combined with information retrieval techniques to locate candidates most closely matching missing classes. Details of the technique and a comparison with existing work will be reported elsewhere.
3.2. Implementation change Implementation change is defined as the change in the code between two consecutive versions of a class. First of all, methods in consecutive versions of a class are aligned by signature. Then, a Levenshtein edit distance [20] measures the differences by counting the number of added, removed and modified instructions between every pair of method, as shown in Equation 1). dist(mi , mi+1 ) = instr. added + instr. removed + instr. chg (1)
Total change in a class is measured as the sum of the changes in its methods (Equation 2). When a method is absent in either version, it is treated like a method containing no instructions. Relative change is calculated by normalising absolute change by the maximum size of class.
IC(Ci , Ci+1 ) =
P
(mi ,mi+1 )∈(Ci ,Ci+1 )
dist(mi , mi+1 )
M AX(Size(Ci ), Size(Ci+1 ))
(2) The classic algorithm for the Levensthein edit distance was implemented within the PTIDEJ reengineering toolkit [13]. Since the toolkit works primarily on byte-code,
this metric calculates change in byte-code. This would allow the metric to be used even without having access to the source code of releases.
3.3. Functional change There exist many ways to quantify functional change. In object-oriented systems, we can think of using added methods or classes. From the perspective of an external user, functional change is often viewed as a change to the API since the public interface of a class defines the functionality it offers to other classes. It is for this reason that we use the relative change in the public interface of a class as a measure of functional change (FC). It is defined as the number of added or removed public methods divided by the maximum size of the public interface, as shown in Equation 3. In this equation, I(Ci ) is the set of local and inherited methods in the public interface of a class C at version i and \ is the set difference operator. F C(Ci , Ci+1 ) =
|(I(Ci ) ∪ I(Ci+1 )) \ (I(Ci ) ∩ I(Ci+1 ))| M AX(|I(Ci )|, |I(Ci+1 )|)
(3)
4. Locating Patterns To find potential patterns, we use clustering, an automatic learning technique, to extract groups of similarly evolving classes to identify patterns. The classes they contain are analysed according to their size, their maturity and their rate of change to verify if they are a pattern of interest. Finally, these groups are compared with one another in a time independent manner using dynamic time-warping. This section presents the clustering technique and the timecomparison algorithm.
4.1. Clustering Changes Clustering is an unsupervised learning technique which means that it relies solely on the attribute distribution to groups things. This is often used when there are either no well defined groupings or when groupings are highly volatile like buying trends on shopping sites. In software engineering, it has been employed for example to identify fault-prone modules [29] and more recently to reorganise the code [21]. To locate change patterns, we apply clustering to the change blueprints of classes. We propose the use of XMeans (eXtended kMeans) clustering [22] to identify change patterns. This algorithm distributes the input items into k distinct clusters and returns the centroid of each cluster. In our case, our blueprints (see
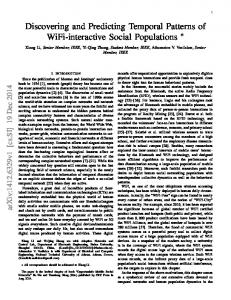
Figure 1. Clustering example
Section 3) are used as input, so the algorithm returns a distinct centroid corresponding to the change blueprint for every cluster. Classes are finally grouped together according to their Euclidean distance to the nearest cluster center. Figure 1 illustrates1 the clustering process. In this example, the points are class blueprints containing one evolution, (IC, F C), while the squares are the cluster centers. The clustering algorithm finds cluster centers (using data means), then it verifies their distribution and iteratively recalculates new centers. The iterative process is shown by the squares becoming increasingly light. There are two advantages with using this technique. First, it can deal with missing change values (for the version when a class doesn’t exist). Any missing value is simply not considered in distance calculations. This is very important since classes appear and disappear regularly. Secondly, unlike KMeans, it is able to evaluate the number of clusters needed, removing the need to provide k as an input parameter.
Figure 2. DTW example
In this example, the beginning of the t is lengthened to match with the subsequence (0, 0, 0, 1) of s. Then, the final 0 in s is lined up with the trailing 0s in t. The total distance between the sequences is of 4.
5. Exploratory Study This section describes how the proposed technique can be applied to the study of two industrial systems.
5.1. Objective The objective of this exploratory study is to validate the usefulness of the proposed technique to understand an evolving code base. Specifically, we are interested in discovering what types of patterns emerge from industrial systems and what kind of information they can provide to help manage their evolution.
4.2. Time-independent Cluster Analysis
5.2. Systems Studied
The XMeans algorithm does not treat change blueprints as time series; rather it considers each entry in the blueprint vector to be an independent attribute. Therefore, it cannot find similar patterns of change that recur at different times for different classes. To recognize these, we propose to use dynamic time-warping (DTW) [18] to compare the different clusters uncovered by XMeans. Dynamic time-warping is a technique used to measure shape similarity between a pair of sequences. This technique was recently used by Bouktif et al. [3] to find classes changing more or less at the same moment. When comparing sequences, DTW is allowed to stretch (warp) the sequences to achieve optimal matching. This technique cannot be applied directly to class blueprints since they often contain missing versions. We can however apply it to the cluster centers which provide a complete evolution blueprint. Figure 2 illustrate an example of an alignment between two sequences s = (0, 0, 0, 1, 4, 0) and t = (1, 2, 4, 0, 0, 0).
Two open-source systems were picked for this study: Xerces2 and JFreeChart3 . They were selected because of their popularity, maturity and difference in styles of development. Both are bundled in a multitude of commercial products meaning that this analysis should be representative of the study of real commercial systems. Xerces is a XML parser that follows multiple specifications defined by the w3c4 . Changes to these standards are a major cause of change in the system. Its development process is relatively rigorous: the developers use a bug reporting system, and collaborate using a dedicated developer mailing list. Most developers are paid by companies to work on the project. In particular, this library is used in the Java Runtime Environment provided by Sun and in IBM’s Web Application Server, Websphere. The other system is JFreeChart, a popular chart building framework. It is developed incrementally following a
1 Figure created using applet http://home.dei.polimi.it/matteucc/Clustering
2 http://xerces.apache.org/xerces-j/ 3 http://www.jfree.org/jfreechart/ 4 http://www.w3.org/
System Xerces JFreeChart
Versions 36 36
First Version 1.0.1 (12/31/1999) 0.5.6 (12/01/2000)
Last Version 2.9.0 (11/22/2006) 1.0.6 (06/19/2007)
Initial size 210 classes 48 classes
Final size 518 classes 790 classes
Class blueprints 690 blueprints 1469 blueprints
Table 1. Descriptive data “Release early, release often” approach [23]. By providing new functionality quickly, users are more likely to provide insightful feedback and help with debugging. This is worthwhile when there are few developers and a large user base. The project has its own discussion forum as well as some bug-reporting facilities provided by Sourceforge5 , the project host. It is reported that the library is used by over 40,000 developers and the primary developer works as a consultant for users of this library. Available released versions were downloaded from both websites. The developers use a three number system like M.m.b. M is a major version number, m is the minor version number and b is the micro release number, or a bug-fix version. How developers use this scheme is more often than not subjective. Generally speaking, a new major version of a library means that it has changed significantly and will not likely be compatible with the previous version. A new minor version improves what exists, but shouldn’t break backwards compatibility. Finally a bug-fix version should only correct bugs and should be a drop-in replacement. Moreover, JFreeChart followed a numbering strategy popular in open-source development. Before the developers decide on a stable design, they use a major version of 0. Hence the first version available to us was 0.5.6. The growth of the systems is presented in Table 1. Over the course of the last seven years and 35 version changes, Xerces has more than doubled in size while JFreeChart has grown from 48 to 800 classes. In this period, many classes have been removed, added and refactored. In total, we have gathered 690 and 1469 class evolutions histories respectively for Xerces and JFreeChart.
5.3. Cluster Description The XMeans clustering algorithm found a total of 11 clusters in Xerces and 12 in JFreeChart. The descriptions of the clusters are presented in Tables 2 and 3. For every cluster, the tables show the number of classes it contains, the probability of a change in these classes and the average number of versions they exist. The number of classes indicates the size of the cluster, an indication of its relative importance to the total change in the system. The probability of change is the total number of versions where a change (either functional or implementation) has occurred in its classes divided by the total number of versions where 5 http://www.sf.net
Cluster X1 X2 X3 X4 X5 X6 X7 X8 X9 X10 X11 All
# of classes 9 (1%) 14 (2%) 23 (3%) 28 (4%) 96 (14%) 35 (5%) *377 (55%) 13 (2%) 55 (8%) 10 (1%) 30 (4%) 690 (100%)
Change rate 22% 35% 27% 37% 25% *48% 22% *48% 23% 38% 23% 26%
Versions 17 19 17 *36 *35 18 13 16 27 *34 24 19
Table 2. Xerces Clusters Cluster J1 J2 J3 J4 J5 J6 J7 J8 J9 J10 J11 J12 All
# of classes 18 (1%) 15 (1%) 3 (0.2%) 12 (1%) 7 (0.4%) 26 (2%) 18 (1%) 128 (9%) *843 (57%) *348 (23%) 8 (0.5%) 43 (3%) 1469 (100%)
Rate of change *68% *67% 17% 38% 23% 34% *71% *48% 17% 19% 35% 19% 25%
Versions 20 20 7 9 10 9 20 12 7 17 22 22 11
Table 3. JFreeChart clusters classes exist. Finally, the number of versions of a cluster is a sign of its maturity and this means that it provides changes in many versions to learn the clusters, making it more cohesive. A cluster with short-lived classes might be more sensitive to random co-occurrences. Information concerning the general change in the systems is also provided in the table. Both systems have a similar change rate of about 25%. JFreeChart has more shortlived classes due to the fact it grew by a factor of 10 and most classes were not present in the first versions.
5.4. Cluster Analysis Our analysis of the clusters will focus on clusters that are significantly different from the others. First, two clusters are much larger than the others and contain the majority of
occurred, yet in 2 out of the three clusters, these changes did not occur in major releases.
Figure 3. Large clusters classes in their respective systems. Then, we look at the clusters containing frequently changing classes. Finally, we look at the long-lived clusters that are composed of mature classes. For each group, we analyse pairs of similar clusters using DTW. The analysis is accompanied by figures giving the average rates of change of classes contained in the clusters. These rates of change have been discretisized to an integer value [0, 4] to minimise visual clutter. To discretisize change, we applied clustering to the values of all different change rates (IC and FC separately), forcing it to create 5 different groups. A value of zero holds an average change of [0, 0.01]% while a value of 4 indicates a change rate of over 15%. Large Clusters. In both systems, there are very large clusters that contain most of the existing classes. Typical are the clusters X7 (Xerces) and J9 (from JFreeChart) whose change histories are shown in Figure 3. More often than not, these classes are grouped together because they do not change much. There are however some spikes of medium level activity. In particular, we can see two such spikes in JFreeChart and one in Xerces. In J9, the first spike corresponds to a massive renaming of the system packages which caused changes in most classes and the second coincides with the release of the first stable version of the library (version 1.0.0). The changes in Xerces occurred at version (2.3.0), which ended the implementation of new specifications. These seem to be system-wide punctual changes affecting most classes regardless of their role or functionality. The identification of these important maintenance versions is not as obvious as it may seem. For example, average change rate for the system could not have provided a maintainer this information because often intense local changes result in higher overall change rates. Instead, identifying lower levels of change spread throughout the system are useful. Furthermore, when evaluating the modifications in a new version of a system, maintainers start off by considering the numbering scheme. In both systems, some major changes
Frequently changed clusters Other clusters that stand out are those that change significantly more than the others. A few reasons might explain why some classes are modified regularly. Sometimes the code is badly structured and needs to be refactored, and sometimes the developers set up the system so that these classes are extension points for all future enhancements. In either case, these classes warrant inspection. In our case, the active clusters are X6, X8, J1, J2 and, J7. With X8, whose change blueprint is shown in Figure 4(a), we can see that there is a high level of change throughout the first half of the life of the system; then none for the second half. Examination of the cluster shows that it contains all the classes from a particular package. The available documentation indicates that this package was a constant source of problems and if there is no change in the second half, it is because the developers removed the package, presumably due to the high maintenance cost. In JFreeChart, J7 is the most active cluster. Its change blueprint is presented in Figure 4(b). All of the classes are changed in the first versions and a few were removed. Study of the code and documentation shows that some classes are designed to be extension points. For example, we find two classes called JFreeChart and ChartFactory. These are used by users of the library to create charts. Whenever a new chart type is implemented in the library, a new method is added. A co-changing test class JFreeChartTest is also present in the cluster. The characteristics of clusters J1, J2 and X6 are discussed later in this section. Maturity Analysis. When many versions of classes are available, the groupings returned by the clustering should be more significant. We have a few clusters noticeably more mature than the others like X4, X5 in Xerces. These classes define the document object model (DOM) for XML, WML and HTML documents and follow a series of specifications by the W3C. That stability explains the longevity of the classes in the cluster. Matching clusters. In the next phase, we look for more subtle change patterns by using dynamic time warping to see which of these clusters evolve in similar ways at siome point in their life; either in terms of implementation or functionality or both. The first interesting pairings that we found are (J1, J2) and the (X4, X5). These show similar changes in their interfaces, yet seem to evolve differently in implementation. They contain important classes in their respective systems. As such, the developers used inheritance to organise the
(a) Xerces : cluster only exists until version 2.0.0
Figure 5. Rendering classes in JFreeChart (b) JFreeChart
Figure 4. Usual suspects code. These pairs of clusters were found to be similar because of the nature of our FC metric which measures the change in the public method of a class. However, inheritance is used differently in both systems and the two pairs show different ways code can be structured in a co-evolution pattern. In JFreechart, functionality is distributed at every level and the two clusters (J1 and J2) contain two different types of classes that can render charts. These classes share a common base class as shown in Figure 5 and consequently interface change is mostly shared. On the other hand, the effort in maintaining the different types of classes (implementation change) is different. The difference between J1 and J2 is that they render different types of data. At every level in the inheritance tree, some functionality is implemented. In J2, changes regularly drop off after major changes while in J1, these major changes are followed by small implementation changes: these are bug-fixes. On a final note, all of the rendering classes were grouped in these two clusters. X4 and X5 change like the J1 and J2 pair, but they differ because they implement different levels of the inheritance tree (Figure 6). X4 holds the shared superclasses and common functionality for all documents object models implementations while X5 contains small classes with no specialisation code. This is similar to the use of some frameworks where the base classes contain the vast majority of functionality. In this a case, the upper, reusable levels of code account for 6 levels of inheritance. Our approach grouped together all appropriate classes that structure XML document elements, both generic and specific (HTML and WML), but ignored factory and utility classes which were contained in the same packages. As with (J1, J2), (X4, X5) shows
Figure 6. DOM classes in Xerces
cyclical activity where functional change drops off after a significant change in the code. There are similarities between the evolution of X1 and X8. Both X1 and X8 contain classes responsible for validating DTDs, but X8 has the classes that were used in the first version of the system and that were replaced. X1 contains most of these new classes. The classes that were ignored either didn’t change (located in cluster X7), or either had a different role (factory classes). X1 and X8 are presented in Figure 7 both show a clear stabilisation pattern. When the classes are added to the system, they change a lot, and then stabilise.
5.5. Patterns Found From the results presented in the previous section, we consider that four different patterns were located:
notes are not available and potentially correct an incorrect version number.
Figure 7. Two stabilisation clusters - Xerces • The first is a pattern of frequent and substantial change. We name classes in this group usual suspects because they are likely to come under review whenever change is considered. Clusters X10 and J7 are typical examples. This pattern is not necessarily a sign of poor quality; in JFreeChart, it corresponds to classes that are meant to change regularly; • Code stabilisation (X1,X8) occurs when newly introduced code require a few versions before remaining stable then become idle. This occurred was observed in both major versions of Xerces; • Punctual changes (X7,J9) are one-time changes that affect a large number of unrelated classes. This can indicate the severity of a version change; • Common concerns (X4,X5,J1,J2) are long-lived classes that co-evolve since they all implement the same concern.
6. Discussion In this work, we used clustering to group classes according to their evolution history. These groups were analysed to identify interesting change patterns. We now discuss how this information can be used to manage maintenance efforts and how this compares with other techniques available. Are system-level changes detected? Recovering the knowledge of past system-level changes can help understand how the software evolved in key moments of its existence. Such changes include modifications of the underlying platform (e.g. OS, programming language) and modifications to the system architecture. These can result in one-time changes affecting normally unrelated classes. We found that the largest clusters identified major system-level changes in both systems, precisely a major version change in Xerces and code reorganisation in JFreeChart. We believe that knowing the effect of a previous system-level change can help estimate the cost of implementing a similar change in the future. This can also be used to judge the importance of a new release when release
Can change patterns indicate the focus of developers? Users are often interested in knowing the reason justifying a new version of a particular system to decide whether it is worthwhile to upgrade or not. This is generally detailed in release notes. Operating without this information, we found that the peaks of activity characterising the DOM classes in Xerces corresponded to changes in the specification which were the primary reasons for many new versions. Since most versions of JFreeChart are unstable, pre-version 0 releases, they contain many different types of changes, making it more difficult to identify the focus of developers from documentation. Can the history of a system help identify concerns? When a new version focuses on improving a specific part of a system, the clustering algorithm was able to identify some key concerns such as the rendering classes in JFreeChart and the document model for Xerces. These concerns were mostly identified due to similar changes in the interfaces of the classes. These were detected as common concerns. Other work using evolution to identify concerns includes [4, 5]. Can the proposed technique deal with a rapidly growing system? Since the technique proposed does not use a detailed input like a log from a versioning system, it requires a significant number of versions for co-evolving classes to correctly identify cluster centers. When cohesive groups are identified, new, young classes are easily assigned to the same clusters. This was observed with the rendering classes of JFreeChart. In JFreeChart, classes were gradually added to the system to provide new chart types, yet the clustering algorithm joined these new classes with the long-lived classes in the appropriate clusters. Figure 8, we present the growth of clusters J1 and J2, clusters containing the rendering classes described earlier. The clusters contain mostly classes that didn’t exist at the beginning of the development, yet they were all correctly grouped together. We have observed that very few co-changing versions are necessary for new classes to join existing clusters. Can this technique be used with any methodology? Unlike Xerces, JFreeChart uses a “release often, release early” strategy favoured in agile methodologies. Many important parts of JFreeChart were regularly modified before the first major version release. This high-level of activity causes noise when changes affect large parts of the system.
7
Figure 8. Growth (# classes) of J1 and J2 This is noticeable by the drop in activity in the detected concerns after the release of the first version. Can code be organised to minimise the cost of change? We chose to use clustering in order to identify previously unknown or system-specific patterns. Some patterns emerged because different parts of the systems are organised in such a way as to minimise the cost of maintenance. This was the case with the common concerns in both systems since the organisation of their classes reflected the desire of developers to properly factor code. This allowed developers to evolve the system in a structured and predictable manner. Limitations. There are a few limitations to our observations. First, the detection technique itself has some weaknesses since it considers the changes between pairs of versions as independent. Obviously this is not the case since we noted that there are cause-effect relationships between changes. Nevertheless, this did not prevent the clustering from locating patterns, and by using DTW, we could identify cases where similar patterns happen at different moments in time. Another problem comes from the presence of noisy data like short-lived classes. Short-lived classes provide little information to the clustering algorithm when it searches for potential patterns. These classes could be analysed separately, or even ignored. The same can be said about the types of versions analysed. Some versions like those affecting only one class might be so small that they should be ignored. In this first exploratory study, we decided to include all data, but we plan on verifying how to best select data in future work. A final point is that the age of a class is relative to the system version and not to the class version. This means that the first change metric contained in any evolution blueprint of a class corresponds to the first versions of the system, not to the first version of the class. This allows the clustering technique to locate system-level changes like major version changes, but it might miss other types of patterns.
Conclusion
In this paper, we show how clustering can be used to identify change patterns in evolving systems. Our approach relies on the only reliable information available to external stakeholders: the different versions of source code. In an exploratory study, this technique was tested on two mature industrial open-source systems. From the resulting clusters found, we could identify four change patterns. Here is a summary of the patterns identified: • The usual suspects are classes that are frequently changed by large amounts. We found that it can correspond to key classes providing extension points; • Code stabilisation occurs when new classes introduced in a system require a few versions before becoming stable. This was detected in a minor concern; • Punctual changes are classes that are grouped together because of a change in a specific version. When these groups are large and contain unrelated classes, they can identify system-level changes; • Common concern affects groups of classes implementing a same concern. These classes are grouped together because they co-change heavily. We also discussed how these patterns could help manage maintenance efforts. In particular, we found that: • Important system-level changes were identified in large clusters, this can be used to judge the importance of a specific version and possibly correct version numbers; • Classes implementing key concerns were identified if they were co-evolving for a relatively long-time; • Software can be organised to manage change. In the study, we found that inheritance was used by developers to reuse code and manage the complexity of changing both systems. In the near future, we plan on extending this work by studying additional systems to identify more, different change patterns. We also plan on trying out new change metrics which could allow us to uncover new types of patterns or identify our patterns more effectively. Our ultimate goal is however to see how this evolution information can be included in an industrial quality model. To this effect, we are currently working with a quality assurance team in a large company which needs tools to judge the quality of outsourced software systems.
References [1] L. A. Belady and M. M. Lehman. A model of large program development. IBM Systems Journal, 15(3):225–252, 1976. [2] D. Bell. Software Engineering: A Programming Approach. Addison-Wesley Longman Publishing Co., Inc., Boston, MA, USA, 2000. [3] S. Bouktif, Y.-G. Gu´eh´eneuc, and G. Antoniol. Extracting change-patterns from CVS repositories. In Proceedings of the 13th Working Conference on Reverse Engineering, pages 221–230, Washington, DC, USA, 2006. IEEE Computer Society. [4] G. Canfora, L. Cerulo, and M. D. Penta. On the use of line co-change for identifying crosscutting concern code. icsm, 0:213–222, 2006. [5] B. Dagenais, S. Breu, F. W. Warr, and M. P. Robillard. Inferring structural patterns for concern traceability in evolving software. In Proceedings of the 22nd International Conference on Automated Software Engineering, pages 254–263, New York, NY, USA, 2007. ACM. [6] S. Demeyer, S. Ducasse, and O. Nierstrasz. Finding refactorings via change metrics. SIGPLAN Not., 35(10):166–177, 2000. [7] D. Dig, C. Comertoglu, D. Marinov, and R. Johnson. Automated detection of refactorings in evolving components. In D. Thomas, editor, ECOOP, volume 4067 of Lecture Notes in Computer Science, pages 404–428. Springer, 2006. [8] B. Fluri, M. Wuersch, M. PInzger, and H. Gall. Change distilling:tree differencing for fine-grained source code change extraction. IEEE Transactions on Software Engineering, 33(11):725–743, 2007. [9] M. Fowler. Refactoring: improving the design of existing code. Addison-Wesley Longman Publishing Co., Inc., Boston, MA, USA, 1999. [10] T. Gˆırba and S. Ducasse. Modeling history to analyze software evolution. Journal of Software Maintenance: Research and Practice, 18(3):207–236, 2006. [11] T. Gˆırba, S. Ducasse, A. Kuhn, R. Marinescu, and R. Daniel. Using concept analysis to detect co-change patterns. In Proceedings of the 9t h International Workshop on Principles of Software Evolution, pages 83–89, New York, NY, USA, 2007. ACM. [12] M. W. Godfrey and L. Zou. Using origin analysis to detect merging and splitting of source code entities. IEEE Transactions on Software Engineering, 31(2):166–181, 2005. [13] Y.-G. Gu´eh´eneuc and H. Albin-Amiot. Recovering binary class relationships: putting icing on the uml cake. SIGPLAN Not., 39(10):301–314, 2004. [14] D. Hamlet and J. Maybee. The Engineering of Software: A Technical Guide for the Individual. Addison-Wesley Longman Publishing Co., Inc., Boston, MA, USA, 2000. [15] M. Kim and D. Notkin. Program element matching for multi-version program analyses. In MSR ’06: Proceedings of the 2006 international workshop on Mining software repositories, pages 58–64, New York, NY, USA, 2006. ACM. [16] M. Kim, D. Notkin, and D. Grossman. Automatic inference of structural changes for matching across program versions.
[17]
[18]
[19]
[20]
[21]
[22]
[23]
[24]
[25]
[26]
[27]
[28]
[29]
[30]
In ICSE ’07: Proceedings of the 29th international conference on Software Engineering, pages 333–343, Washington, DC, USA, 2007. IEEE Computer Society. S. Kim, K. Pan, and J. Whitehead, E.J. When functions change their names: automatic detection of origin relationships. Reverse Engineering, 12th Working Conference on, pages 10 pp.–, 7-11 Nov. 2005. J. B. Kruskall and M. Liberman. The symmetric time warping algorithm: From continuous to discrete. Time Warps, String Edits and Macromolecules, 1983. M. Lanza and S. Ducasse. Understanding software evolution using a combination of software visualization and software metrics. In Proceedings of Langages et Mod`eles a` Objets (LMO 2002), pages 135–149, Paris, 2002. Lavoisier. V. Levenshtein. Binary codes capable of correcting deletions, insertions, and reversals. Journal of Soviet Physics Doklady, 10(8):707–710, feb 1966. O. Maqbool and H. Babri. Hierarchical clustering for software architecture recovery. IEEE Transactions on Software Engineering, 33(11):759–780, 2007. D. Pelleg and A. W. Moore. X-means: Extending k-means with efficient estimation of the number of clusters. In Proceedings of the 17t h International Conference on Machine Learning, pages 727–734, San Francisco, CA, USA, 2000. Morgan Kaufmann Publishers Inc. E. S. Raymond. The cathedral and the bazaar: musings on Linux and open source by an accidental revolutionary. O’Reilly & Associates, Inc., Sebastopol, CA, USA, 2001. Q. Tu and M. W. Godfrey. An integrated approach for studying architectural evolution. In IWPC ’02: Proceedings of the 10th International Workshop on Program Comprehension, page 127, Washington, DC, USA, 2002. IEEE Computer Society. Z. Xing and E. Stroulia. Understanding class evolution in object-oriented software. In Proceeding of the 12th International Workshop on Program Comprehension, volume 00, page 34, Los Alamitos, CA, USA, 2004. IEEE Computer Society. Z. Xing and E. Stroulia. Analyzing the evolutionary history of the logical design of object-oriented software. IEEE Transactions on Software Engineering, 31(10):850–868, 2005. Z. Xing and E. Stroulia. Refactoring detection based on umldiff change-facts queries. Reverse Engineering, 2006. WCRE ’06. 13th Working Conference on, pages 263–274, Oct. 2006. A. T. T. Ying, R. Ng, and M. C. Chu-Carroll. Predicting source code changes by mining change history. IEEE Trans. Softw. Eng., 30(9):574–586, 2004. Member-Gail C. Murphy. S. Zhong, T. M. Khoshgoftaar, and N. Seliya. Analyzing software measurement data with clustering techniques. IEEE Intelligent Systems, 19(2):20–27, 2004. T. Zimmermann, P. Weissgerber, S. Diehl, and A. Zeller. Mining version histories to guide software changes. IEEE Transactions on Software Engineering, 31(6):429–445, 2005.