Mar 9, 2015 - V. Zabalza, e-mail: victor.zabalza@le.ac.uk. E [TeV]. -4 ...... 36 Obserwatorium Astronomiczne, Uniwersytet Jagiellonski, ul. Orla. 171, 30-244 ...
c
ESO 2015
Astronomy & Astrophysics manuscript no. hessj1018-var March 11, 2015
arXiv:1503.02711v1 [astro-ph.HE] 9 Mar 2015
Discovery of variable VHE γ-ray emission from the binary system 1FGL J1018.6–5856 H.E.S.S. Collaboration, A. Abramowski1 , F. Aharonian2, 3, 4 , F. Ait Benkhali2 , A.G. Akhperjanian5, 4 , E.O. Angüner6 , M. Backes7 , A. Balzer8 , Y. Becherini9 , J. Becker Tjus10 , D. Berge11 , S. Bernhard12 , K. Bernlöhr2 , E. Birsin6 , R. Blackwell13 , M. Böttcher14 , C. Boisson15 , J. Bolmont16 , P. Bordas2 , J. Bregeon17 , F. Brun18 , P. Brun18 , M. Bryan8 , T. Bulik19 , J. Carr20 , S. Casanova21, 2 , N. Chakraborty2 , R. Chalme-Calvet16 , R.C.G. Chaves17, 22 , A, Chen23 , M. Chrétien16 , S. Colafrancesco23 , G. Cologna24 , J. Conrad25, 26 , C. Couturier16 , Y. Cui27 , I.D. Davids14, 7 , B. Degrange28 , C. Deil2 , P. deWilt13 , A. Djannati-Ataï29 , W. Domainko2 , A. Donath2 , L.O’C. Drury3 , G. Dubus30 , K. Dutson31 , J. Dyks32 , M. Dyrda21 , T. Edwards2 , K. Egberts33 , P. Eger2 , J.-P. Ernenwein20 , P. Espigat29 , C. Farnier25 , S. Fegan28 , F. Feinstein17 , M.V. Fernandes1 , D. Fernandez17 , A. Fiasson34 , G. Fontaine28 , A. Förster2 , M. Füßling35 , S. Gabici29 , M. Gajdus6 , Y.A. Gallant17 , T. Garrigoux16 , G. Giavitto35 , B. Giebels28 , J.F. Glicenstein18 , D. Gottschall27 , A. Goyal36 , M.-H. Grondin37 , M. Grudzi´nska19 , D. Hadasch12 , S. Häffner38 , J. Hahn2 , J. Hawkes13 , G. Heinzelmann1 , G. Henri30 , G. Hermann2 , O. Hervet15 , A. Hillert2 , J.A. Hinton2, 31 , W. Hofmann2 , P. Hofverberg2 , C. Hoischen33 , M. Holler28 , D. Horns1 , A. Ivascenko14 , A. Jacholkowska16 , C. Jahn38 , M. Jamrozy36 , M. Janiak32 , F. Jankowsky24 , I. Jung-Richardt38 , M.A. Kastendieck1 , K. Katarzy´nski39 , U. Katz38 , D. Kerszberg16 , B. Khélifi29 , M. Kieffer16 , S. Klepser35 , D. Klochkov27 , W. Klu´zniak32 , D. Kolitzus12 , Nu. Komin23 , K. Kosack18 , S. Krakau10 , F. Krayzel34 , P.P. Krüger14 , H. Laffon37 , G. Lamanna34 , J. Lau13 , J. Lefaucheur29 , V. Lefranc18 , A. Lemière29 , M. Lemoine-Goumard37 , J.-P. Lenain16 , T. Lohse6 , A. Lopatin38 , C.-C. Lu2 , R. Lui2 , V. Marandon2 , A. Marcowith17 , C. Mariaud28 , R. Marx2 , G. Maurin34 , N. Maxted17 , M. Mayer6 , P.J. Meintjes40 , U. Menzler10 , M. Meyer25 , A.M.W. Mitchell2 , R. Moderski32 , M. Mohamed24 , K. Morå25 , E. Moulin18 , T. Murach6 , M. de Naurois28 , J. Niemiec21 , L. Oakes6 , H. Odaka2 , S. Öttl12 , S. Ohm35 , E. de Oña Wilhelmi2, 43 , B. Opitz1 , M. Ostrowski36 , I. Oya35 , M. Panter2 , R.D. Parsons2 , M. Paz Arribas6 , N.W. Pekeur14 , G. Pelletier30 , P.-O. Petrucci30 , B. Peyaud18 , S. Pita29 , H. Poon2 , H. Prokoph9 , G. Pühlhofer27 , M. Punch29 , A. Quirrenbach24 , S. Raab38 , I. Reichardt29 , A. Reimer12 , O. Reimer12 , M. Renaud17 , R. de los Reyes2 , F. Rieger2, 41 , C. Romoli3 , S. Rosier-Lees34 , G. Rowell13 , B. Rudak32 , C.B. Rulten15 , V. Sahakian5, 4 , D. Salek42 , D.A. Sanchez34 , A. Santangelo27 , M. Sasaki27 , R. Schlickeiser10 , F. Schüssler18 , A. Schulz35 , U. Schwanke6 , S. Schwemmer24 , A.S. Seyffert14 , R. Simoni8 , H. Sol15 , F. Spanier14 , G. Spengler25 , F. Spies1 , Ł. Stawarz36 , R. Steenkamp7 , C. Stegmann33, 35 , F. Stinzing38 , K. Stycz35 , I. Sushch14 , J.-P. Tavernet16 , T. Tavernier29 , A.M. Taylor3 , R. Terrier29 , M. Tluczykont1 , C. Trichard34 , K. Valerius38 , J. van der Walt14 , C. van Eldik38 , B. van Soelen40 , G. Vasileiadis17 , J. Veh38 , C. Venter14 , A. Viana2 , P. Vincent16 , J. Vink8 , F. Voisin13 , H.J. Völk2 , T. Vuillaume30 , S.J. Wagner24 , P. Wagner6 , R.M. Wagner25 , M. Weidinger10 , Q. Weitzel2 , R. White31 , A. Wierzcholska24, 21 , P. Willmann38 , A. Wörnlein38 , D. Wouters18 , R. Yang2 , V. Zabalza31 , D. Zaborov28 , 36 ˙ M. Zacharias24 , A.A. Zdziarski32 , A. Zech15 , F. Zefi28 , and N. Zywucka (Affiliations can be found after the references) ABSTRACT
Re-observations with the H.E.S.S. telescope array of the very-high-energy (VHE) source HESS J1018–589 A coincident with the Fermi-LAT γ-ray binary 1FGL J1018.6–5856 have resulted in a source detection significance of more than 9σ, and the detection of variability (χ2 /ν of 238.3/155) in the emitted γ-ray flux. This variability confirms the association of HESS J1018–589 A with the high-energy γ-ray binary detected by Fermi-LAT, and also confirms the point-like source as a new very-high-energy binary system. The spectrum of HESS J1018–589 A is best fit with a power-law function with photon index Γ = 2.20 ± 0.14stat ± 0.2sys . Emission is detected up to ∼20 TeV. The mean differential flux level is (2.9 ± 0.4) × 10−13 TeV−1 cm−2 s−1 at 1 TeV, equivalent to ∼1% of the flux from the Crab Nebula at the same energy. Variability is clearly detected in the night-by-night lightcurve. When folded on the orbital period of 16.58 days, the rebinned lightcurve peaks in phase with the observed X-ray and high-energy phaseograms. The fit of the H.E.S.S. phaseogram to a constant flux provides evidence of periodicity at the level of Nσ > 3σ. The shape of the VHE phaseogram and measured spectrum suggest a low inclination, low eccentricity system with a modest impact from VHE γ-ray absorption due to pair production (τ . 1 at 300 GeV). Key words. gamma rays: stars; X-rays: binaries; stars: individual: 1FGL J1018.6–5856; acceleration of particles; radiation mechanisms: non-thermal
Article number, page 1 of 6
1. Introduction The region around the supernova remnant (SNR) SNR G284.3– 1.8 (Milne et al. 1989) shows two clearly distinct regions of very-high-energy (VHE; E>100 GeV) gamma-ray emission (Abramowski et al. 2012); an extended emission named HESS J1018–589 B likely associated with the pulsar wind nebula (PWN) powered by the bright pulsar PSR J1016–5857 (Camilo et al. 2001, 2004), and the point-like source HESS J1018–589 A. The latter is positionally coincident with 1FGL J1018.6–5856, a point-like high-energy gamma-ray (HE; 100 MeV0.35 TeV) [10−12 cm−2 s−1 ]
H.E.S.S. Collaboration: Variable VHE emission from 1FGL J1018.6–5856
0.8 0.6
0
20
40
60
80
100
120
0.4
140
Run Number
0.2
Fig. 2. Lightcurve of the integral flux above 0.35 TeV in a 0.1◦ region centered on HESS J1018–589 A binned by observation run, corresponding to approximately 30 minutes of observation time per bin. The dashed horizontal line shows the mean integral flux.
0.0 2.5 2.0 1.5 1.0 0.5
−13
−1
−2 −1
flux normalisation is N0 = (2.9 ± 0.4stat ) × 10 TeV cm s at 1 TeV. The systematic error on the normalisation constant N0 is estimated to be 20% (Aharonian et al. 2006). The better statistics allow for a better determination of the spectral features of the point-like source compared with the one presented in Abramowski et al. (2012), including a clearer separation from HESS J1018–589 B. The nearby source introduces a maximum of 30% contamination on HESS J1018–589 A, although above 1 TeV, thanks to the better PSF, less than 10% contamination was calculated from a simultaneous fit of the two sources. The light curve of the source above 0.35 TeV, binned by observation run (approximately 30 minutes of observation time), is shown in Fig. 2. The best-fit mean flux level above 0.35 TeV is marked with a dashed gray line. The lightcurve displays clear variability, with a χ2 /ν of 238.3/155 (corresponding to 4.3σ) using a likelihood ratio test with a constant flux as null hypothesis. To investigate the periodicity of the source, the data were folded with the 16.58 day period found in the HE γ-ray observations (Fig. 3, top panel) using the reference time of Tmax =55403.3 MJD as phase 0 (Ackermann et al. 2012) in a single trial. The number of bins in the phaseogram was selected to obtain a significance of at least 1σ in each phase bin. For comparison, the same phaseogram is also shown for HESS J1023– 589, a nearby bright γ-ray source expected to be constant. The flux variation along the orbit shows a similar behaviour when comparing it with the Fermi-LAT flux integrated between 1 and 10 GeV (Fig. 3, middle panel). An increase of the flux towards phase 0 is observed, with a χ2 /ν of 22.7/7 (3.1σ) when fitting the histogram to a constant flux, providing evidence of periodicity at the a priori selected period. Unfortunately, the uneven sampling and large timespan of the observations did not allow for an independent determination of the periodicity from the VHE γ-ray data using a Lomb-Scargle test (Scargle 1982), since the equivalent frequency is ∼8 times larger than the sample Nyquist frequency. Finally spectral modulation was examined by deriving the photon spectrum for observations in the 0.2 to 0.6 phase range (motivated by the Fermi-LAT observations) and comparing it with the one derived at the maximum of the emission in the complementary phase range. No spectral modulation was found within the photon index errors (∆Γ = 0.36 ± 0.43) although it should be noted that the data statistics in the 0.2 to 0.6 phase range are insufficient (3σ
Fermi-LAT (1–10 GeV)
Fermi-LAT (0.1–1 GeV)
0.0 5 4
2011 2012 2013
Swift-XRT
3 2 1 0 0.0
0.2
0.4
0.6
0.8
1.0
1.2
1.4
1.6
1.8
2.0
Orbital Phase
Fig. 3. VHE, HE, and X-ray fluxes of 1FGL J1018.6–5856 folded with the orbital period of P=16.58 d. Two orbits are shown for clarity. Top: VHE integral flux above 0.35 TeV measure by H.E.S.S. (red circles). For comparison, a scaled lightcurve from the nearby bright source HESS J1023-589 is shown in gray. Middle top and middle bottom: Fermi-LAT lightcurve between 1 and 10 GeV (solid blue squares) and between 0.1 and 1 GeV (open blue squares; Ackermann et al. 2012). Bottom: X-ray 0.3–10 keV count rate lightcurve from 67 Swift-XRT observations in 2011 (green), 2012 (blue), and 2013 (red).
detection) to firmly conclude a lack of variation in the spectrum at different orbital phases. In order to compare the VHE orbital modulation with the behaviour of the source at X-ray energies, 67 Swift-XRT observations of 1FGL J1018.6–5856, performed between 2011 and 2013 and with a median observation time of 2.2 ksec, were analysed. Early subsets of these observations were presented previously by Ackermann et al. (2012) and An et al. (2013). Cleaned event files were obtained using xrtpipeline from HEAasoft v6.15.1. For each observation, source count rates were extracted from a 1 arcmin circular region around the nominal position of 1FGL J1018.6–5856, and background count rates extracted from a nearby region of the same size devoid of sources. The resulting count rate lightcurve, folded with the orbital period, is shown in the bottom panel of Figure 3. The phaseogram displays a sharp peak around phase 0, matching the location of the maximum in the VHE and HE phaseograms. There is an additional sinusoidal component with a maximum around phase 0.3 and with lower amplitude than the sharp peak at phase 0. Article number, page 3 of 6
A&A proofs: manuscript no. hessj1018-var
3. Discussion
Article number, page 4 of 6
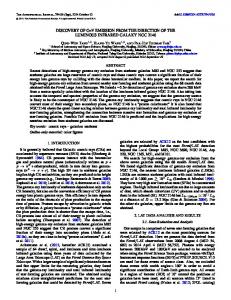
hτ300 i=3.4, α=3.1 hτ300 i=1.0, α=2.5 hτ300 i=0.0, α=2.3
10−10
E 2 dN/dE [erg cm−2 s−1 ]
The flux variability and periodical behaviour of HESS J1018– 589 A suggest the identification of the VHE source with the γ-ray binary 1FGL J1018.6–5856. It therefore becomes the fifth binary system, along with LS 5039 (Aharonian et al. 2005a), LS I +61 303 (Albert et al. 2006), PSR B1259–63 (Aharonian et al. 2005b) and HESS J0632+057 (Acciari et al. 2009) detected at VHE during multiple orbits, in addition to the hint of a flaring episode from the X-ray binary Cygnus X-1 (Albert et al. 2007). When folded with the modulation period found at other wavelengths, the rebinned VHE lightcurve shows a modulation, significant at the 3.1σ level, in phase with the HE γ-ray lightcurve. The phaseogram (Fig. 3) shows a similar behaviour (within the limited statistics) to the high-energy lightcurve of 1FGL J1018.6–5856 showing a flux increasing simultaneously to the one occurring in the HE and X-ray counterpart. Despite the different orbital behaviour at different wavelengths, the stars in the γ-ray binaries 1FGL J1018.6–5856 and LS 5039 are thought to be very similar, with spectral types of O6V((f)) and O6.5V((f)), respectively (Ackermann et al. 2012; Clark et al. 2001). Unfortunately, the orbital parameters of HESS J1018–589 A are not yet known and only limited conclusions can be drawn on the relation between the compact object and the massive star. Both binary systems are composed of an almost identical massive star and a compact object orbiting around it on a timescale of days. The four-times larger period of 1FGL J1018.6– 5856 implies a factor ∼2.5 larger semi-major axis than in LS 5039, and the low amplitude of the flux modulation observed by FermiLAT, of the order of 25%, can be interpreted as a sign of a loweccentricity orbit. Although the spectral index variability at HE γ-ray is at odds with anisotropic IC being the only source of flux variability, such low modulation amplitude would be difficult to realize under the widely changing conditions of an eccentric orbit. The behaviour of HESS J1018–589 A at different orbital phases is mimicked in X-rays, HE, and VHE, showing in all cases a maximum flux near phase 0. There is a second sinusoidal component that peaks at phase 0.3 and appears in radio (Ackermann et al. 2012) and X-rays (Fig. 3, bottom panel), as well as a hint in the 0.1 to 1 GeV Fermi-LAT lightcurve peaking at phase 0.5 (Fig. 3, middle-bottom panel), but it is not observed (with the current statistics) at higher energies. However, in LS 5039 the VHE flux is correlated to the X-ray flux but anti-correlated to the HE flux (Aharonian et al. 2005a; Takahashi et al. 2009; Hoffmann et al. 2009; Hadasch et al. 2012). The HE spectral energy distributions (SEDs) of the two binary systems are remarkably similar in shape and flux (see Fig. 1), although it should be noted that the systems are believed to be located at different distances: whereas LS 5039 is ∼2.5 kpc away, 1FGL J1018.6–5856 is believed to be located at 5±2 kpc, derived from the interstellar absorption lines of the companion (Ackermann et al. 2012). At VHE, LS 5039 shows a clear spectral modulation at different orbital phases, with a mean luminosity between 1 and 10 TeV of ∼ 1033 (d2.5 kpc )2 erg s−1 , similar to the one found in HESS J1018–589 A in the same energy range (9.9 × 1032 (d5 kpc )2 erg s−1 ). However, the ratios between the fluxes measured at HE and VHE of the two binary systems differ substantially (see Figs. 1 and 3): whereas for LS 5039 the ratio between the fluxes at 1 GeV and 1 TeV varies between ∼15 and 40 in superior and inferior conjunction, respectively, for 1FGL J1018.6–5856 and HESS J1018–589 A a ratio of ∼160 is found, with the TeV flux strongly reduced with respect to the GeV flux when compared with LS 5039. Similar to other binaries, the spectrum of 1FGL J1018.6–5856 measured at HE does not extrapolate to VHE.
10−11
10−12
10−13 10−4
10−3
10−2
10−1
100
101
102
E [TeV] Fig. 4. Results of the fit of a pair-production-absorbed power-law to the HE and VHE spectra of 1FGL J1018.6–5856, with solid (dashed) lines indicating the absorbed (intrinsic) spectra. The emitter is assumed to be in the plane of the sky with respect to the star (i.e., on the plane of an orbit with i = 0◦ ). The model with the maximum absorption compatible with the VHE spectral data is shown in red, the best-fit model with hτ300 i = 1 in green, and the best-fit model with no absorption in blue. Observational points are as in Fig. 1.
Regardless of the nature of the emission process responsible for the TeV emission, the strong stellar photon field in the environment of the binary system unavoidably leads to the absorption of γ-rays above ∼50 GeV through pair production (Moskalenko & Karakula 1994; Böttcher & Dermer 2005; Dubus 2006). Assuming that the VHE emission is due to anisotropic inverse-Compton (IC) scattering of a leptonic population at a similar location as the HE one, the identical phasing of HE and VHE would imply a low inclination of the orbit with respect to the observing direction. Furthermore, the sinusoidal modulation implies that the orbit cannot be highly eccentric (or the density of photons would lead to strong variation). Under this scenario, IC anisotropic emission would be most efficient when the emitter is behind the star with respect to the emitter, i.e., at superior conjunction, and therefore the flux maximum at phase 0 can be tentatively associated with this orbital configuration. In order to illustrate the effects of absorption on the observed VHE spectrum, in the following calculations a circular orbit on the plane of the sky (i = 0◦ ) is assumed to exemplify the low, but likely non-zero, inclination of the orbit, and take stellar parameters as in LS 5039. A fit of a pair-production-absorbed power-law function (of shape ∝ E −α exp(− hτE i), where hτE i is the energydependent orbit-averaged optical depth and α the intrinsic spectral index) to the measured VHE spectrum indicates that the maximum optical depth at 300 GeV compatible with the VHE data (at 68% CL) is hτ300 i ≈ 3.4, with an intrinsic index of α ≈ 3.1. Figure 4 shows how the energy dependence of pair-production absorption results in a power-law-like spectrum between 500 GeV and 10 TeV even for high optical depths, as long as the intrinsic spectrum is steep enough. This means that for an optical depth of hτ300 i ≈ 3.4, the steep spectral index required to fit the VHE data would result in a large HE emission below 100 GeV, where pair-production absorption is no longer significant, up to a factor 100 brighter than the flux observed by Fermi-LAT between 10 GeV and 100 GeV. Therefore, either the intrinsic emission from the VHE component has a sharp spectral break between 80 and 200 GeV, or the VHE instrinsic spectrum must be significantly harder than α ≈ 3. Considering the latter, and taking the Fermi-
H.E.S.S. Collaboration: Variable VHE emission from 1FGL J1018.6–5856
LAT flux between 10 GeV and 100 GeV as an upper limit to the emission of the VHE component at these energies, the optical depth should be lower than 1, as illustrated by the green model in Fig. 4. For an orbital inclination of i = 0◦ , an optical depth lower than unity hints towards an emitter located farther away from the star than the compact object (at a distance of at least ∼ 3×1012 cm from the compact object). At higher orbital inclinations, the limit placed on the orbit-averaged optical depth can not be directly related to the location of the emitter, given that the optical depth would vary significantly along the orbit. However, the correlation between HE and VHE emission and the sharpness of the peak of VHE emission at superior conjunction indicate that the optical depth at this position must be low enough to not have a significant effect on the observed flux modulation, therefore excluding an emitter close to the compact object for high orbital inclinations. Several mechanisms have been proposed to explain VHE variability and periodic modulation via either IC processes or pion production of high energy protons with the companion wind (Kirk et al. 1999; Bosch-Ramon et al. 2006; Dermer & Böttcher 2006; Bednarek 2006; Dubus 2006; Khangulyan et al. 2008; Sierpowska-Bartosik & Torres 2008). In a leptonic scenario, the maximum energy of the H.E.S.S. measured spectrum can be used to derive further constraints on the location, magnetic field and acceleration efficiency of the VHE emitter in HESS J1018−589 A. Given the energy of the stellar photons, IC scattering will take place in the deep Klein-Nishina (KN) regime, in which all of the electron energy is transferred to the scattered photons. In this scenario, the maximum energy detected (up to ∼20 TeV) would require the presence of 20 TeV electrons in the VHE emitter, which in turn requires that they are accelerated faster than their radiative energy loss timescale. The acceleration timescale can be expressed as: tacc = ηacc rL /c ≈ 0.1ηacc ETeV B−1 G s,
(1)
where rL is the Larmor radius of the electron, ETeV is the electron energy in TeV units, BG is the strength of the magnetic field in Gauss, and ηacc > 1 is a parameter that characterizes the efficiency of the acceleration (in general ηacc � 1, and only for extreme accelerators does ηacc approach 1, i.e. the Bohm limit). The balance between tacc and the cooling time of electrons in 2 0.7 the KN regime, given by tKN ≈ 103 d13 s (Khangulyan et al. ETeV 2008), where d13 is the distance to the optical star in units of −2 3.3 1013 cm, implies Emax ≈ (104 BG η−1 TeV. For IC domiacc d13 ) nant losses, and considering the maximum energy in the VHE 2 spectrum, a minimum B & 2.5 × 10⁻⁴ ηacc d13 G can be derived. Furthermore, if non-radiative (adiabatic) energy losses are negliglible, electron energy losses in the energy band relevant to VHE emission would be dominated by the interplay between IC losses, which in the KN regime decrease with energy, and synchrotron losses, which increase with energy (Moderski et al. −p 2005). For a power-law Ee inj injection spectrum with canonical pinj = 2, this results in a hardening (pe ∼ 1.3) of the spectrum of the underlying steady-state particle population up to the energy for which IC and synchrotron losses are balanced, and a softening (pe ∼ 3) for higher energies (see, e.g., Moderski et al. 2005; Dubus et al. 2008). The energy of the cooling break, Ebreak , can be found from the balance of IC and synchrotron cooling −1 timescales tKN = tsyn , which, taking tsyn ≈ 400ETeV B−2 G s, re−1.18 sults in Ebreak ≈ 0.58(BG d13 ) TeV. The relatively hard VHE spectrum detected from 1FGL J1018.6–5856 requires an evolved particle distribution with pe . 2, indicating that Ebreak should be higher, or of the order of, the electron energies sampled by the TeV spectrum. Considering Ebreak & 10 TeV, the magnetic field −1 strength is constrained by the VHE spectrum to B . 0.1d13 G.
These constraints depend strongly on the location, acceleration efficiency and magnetic field of the emission region. An extended discussion of these relationships for a VHE emitter in a binary system can be found in Khangulyan et al. (2008). For the case of 1FGL J1018.6–5856, the extension of a hard VHE spectrum up to 20 TeV indicates that acceleration/emission regions close to the compact object require an extremely efficient acceleration process, with ηacc . 50 and magnetic field strengths between 0.001 and 0.1 G. If the emitter is located farther from the star, the constraint on the acceleration efficiency is relaxed, but the upper limit on the magnetic field is reduced to 0.03 G at d = 3 × 1013 cm. Regardless of the location of the emitter, the requirement that the magnetic field strength is below 0.1 G indicates that, in this scenario, the particle population responsible for the VHE emission would have a maximum 2–10 keV X-ray flux of 1.2 × 10⁻¹⁴ erg cm−2 s−1 , more than an order of magnitude lower than its detected X-ray flux of (6.5 ± 0.7) × 10−13 erg cm−2 s−1 (Abramowski et al. 2012), a similar situation to that found for LS 5039 (Zabalza et al. 2013).
4. Conclusions The new observations of HESS J1018–589 A with the H.E.S.S. telescope array have increased the significance of the detection up to ∼9σ, allowing the firm identification of a new VHE binary system through the measurement of its variable emission at a significance level of 4.3σ. Folding the measured flux on a 16.58-day orbit results in a phaseogram similar to the one observed at HE, with a wide peak around phase 0. The result of fitting the phaseogram to a constant flux indicates evidence of periodic flux at the 3.1σ level. The phase-averaged photon spectrum extends up to ∼20 TeV, posing constraining limits on the magnetic field (0.001