MNRAS 000, 1–?? ()
Preprint 27 January 2017
Compiled using MNRAS LATEX style file v3.0
The detection of variable radio emission from the fast rotating magnetic hot B-star HR 7355 and evidence for its X-ray aurorae
arXiv:1701.07679v1 [astro-ph.SR] 26 Jan 2017
P. Leto1 ⋆, C. Trigilio1 , L. Oskinova2, R. Ignace3, C. S. Buemi1, G. Umana1 , A. Ingallinera1 , H. Todt2 , F. Leone4 1 INAF - Osservatorio Astrofisico di Catania, Via S. Sofia 78, 95123 Catania, Italy for Physics and Astronomy, University Potsdam, 14476 Potsdam, Germany 3 Department of Physics & Astronomy, East Tennessee State University, Johnson City, TN 37614, USA 4 Universit´ a degli studi di Catania, Via S.Sofia 78, I-95123 Catania, Italy 2 Institute
ABSTRACT
In this paper we investigate the multiwavelengths properties of the magnetic early B-type star HR 7355. We present its radio light curves at several frequencies, taken with the Jansky Very Large Array, and X-ray spectra, taken with the XMM-Newton X-ray telescope. Modeling of the radio light curves for the Stokes I and V provides a quantitative analysis of the HR 7355 magnetosphere. A comparison between HR 7355 and a similar analysis for the Ap star CU Vir, allows us to study how the different physical parameters of the two stars affect the structure of the respective magnetospheres where the non-thermal electrons originate. Our model includes a cold thermal plasma component that accumulates at high magnetic latitudes that influences the radio regime, but does not give rise to X-ray emission. Instead, the thermal X-ray emission arises from shocks generated by wind stream collisions close to the magnetic equatorial plane. The analysis of the X-ray spectrum of HR 7355 also suggests the presence of a non-thermal radiation. Comparison between the spectral index of the power-law X-ray energy distribution with the non-thermal electron energy distribution indicates that the non-thermal X-ray component could be the auroral signature of the non-thermal electrons that impact the stellar surface, the same non-thermal electrons that are responsible for the observed radio emission. On the basis of our analysis, we suggest a novel model that simultaneously explains the X-ray and the radio features of HR 7355 and is likely relevant for magnetospheres of other magnetic early type stars. Key words: stars: early-type – stars: chemically peculiar – stars: individual: HR 7355 – stars: magnetic field – radio continuum: stars – X-rays: stars.
1 INTRODUCTION Stellar magnetism at the top of the main sequence is not typical, but neither is it an extremely rare phenomenon. In fact about 10% of the OB-type stars display strong and stable magnetic fields (Grunhut et al. 2012b; Fossati et al. 2015). The hot magnetic stars are mainly characterized as oblique magnetic rotators (OMR): a dipolar magnetic field topology with field axis misaligned with respect to the rotation axis (Babcock 1949; Stibbs 1950). The existence of such well-ordered magnetic fields are a cause of inhomogeneous photospheres, giving rise to observable photometric, spectroscopic and magnetic variability that can be explained in the framework of the OMR. Early type magnetic stars are sufficiently hot to produce a radiatively driven stellar wind, that in the presence of their large-scale magnetic fields may be strongly aspherical. The wind plasma accumulates at low magnetic latitudes (inner
⋆
E-mail:
[email protected]
c The Authors
magnetosphere), whereas it can freely propagate along directions near the magnetic poles (Shore 1987; Leone 1993). Observable signatures of plasma trapped inside stellar magnetospheres can be recognized in the UV spectra (Shore et al. 1987; Shore & Brown 1990) and in the Hα line (Walborn 1974). The interaction of a radiatively driven wind with the stellar magnetosphere has been well studied. As examples, see Poe, Friend & Cassinelli (1989) for an application of the Weber & Davis (1967) model to radiatively driven winds, wind compression models with magnetic fields (WCFields) (Ignace, Cassinelli & Bjorkman 1998), and the magnetically torqued disk (MTD) model (Cassinelli et al. 2002). Such interaction causes an accumulation of hot material close to the magnetic equatorial plane, as described by the magnetically confined wind shock (MCWS) model (Babel & Montmerle 1997). The wind plasma arising from the two opposite hemispheres collides close to the magnetic equatorial plane, shocking the plasma to radiate X-rays (ud-Doula & Naz´e 2016 has made a recent review of the X-ray emission from magnetic hot stars). In the presence of a
2
P. Leto et al.
strong magnetic field, the stellar wind plasma is confined within the stellar magnetosphere and forced to rigidly co-rotate with the star (Townsend & Owocky 2005; ud-Doula, Townsend & Owocky 2006; ud-Doula, Owocky & Townsend 2008). The prototype of a rigidly rotating magnetosphere (RRM) is σ Ori E (Groote & Hunger 1997; Townsend, Owocki & Groote 2005). Evidence of circumstellar matter bound to the strong stellar magnetic field has been reported in a few other cases (Leone et al. 2010; Bohlender & Monin 2011; Grunhut et al. 2012a; Rivinius et al. 2013; Hubrig et al. 2015; Sikora et al. 2015). The stellar rotation plays an important role in establishing the size of the RRM, and the density of the plasma trapped inside. The rotation works in opposition to the gravitational infall of the magnetospheric plasma, leading to a large centrifugal magnetosphere (CM) (Maheswaran & Cassinelli 2009; Petit et al. 2013). The existence of a CM filled by stellar wind material is a suitable condition to give rise to non-thermal radio continuum emission that was first measured for peculiar magnetic B and A stars (Drake et al. 1987; Linsky et al. 1992; Leone, Trigilio & Umana 1994). In accord with the OMR model, their radio emission is cyclic owing to stellar rotation (Leone 1991; Leone & Umana 1993), suggestive of optically thick emission arising from a stable RRM. The radio emission features are characterized by a simple dipolar magnetic field topology and have been successfully reproduced using a 3D model that computes the gyrosynchrotron emission (Trigilio et al. 2004; Leto et al. 2006). In this model, the non-thermal electrons responsible for the radio emission originate in magnetospheric regions far from the stellar surface, where the kinetic energy density of the gas is high enough to brake the magnetic field lines forming current sheets. These regions are the sites where the mildly relativistic electrons originate. In the magnetic equator, at around the Alfv´en radius, there is a transitional magnetospheric “layer” between the inner confined plasma and the escaping wind. Energetic electrons that recirculate through this layer back to the inner magnetosphere radiate radio by the gyrosynchrotron emission mechanism. The analysis of radio emissions from magnetic early-type stars is a powerful diagnostic tool for the study of the topology of their magnetospheres. The radio radiation at different frequencies probes the physical conditions of the stellar magnetosphere at different depths, even topologies are complex (Leto et al. 2012). Hence, the radio emission of the hot magnetic stars provides a favored window to study the global magnetic field topology, the spatial stratification of the thermal electron density, the non-thermal electron number density, and interactions between stellar rotation, wind, and magnetic field. In fact, the above physical parameters can be derived by comparing the multi-wavelength radio light curves, for the total and circularly polarized flux density, with synthetic light curves using our 3D theoretical model. It is then possible, to study how such stellar properties as rotation, wind, magnetic field geometry affect the efficiency of the electron acceleration mechanism. In particular, it is important to apply the radio diagnostic techniques on a sample of magnetic early-type stars that differ in their stellar rotation periods, magnetic field strengths, and field geometries. To this end, we conducted a radio survey of a representative sample of hot magnetic stars using the Karl G. Jansky Very Large Array (VLA). These stars probe different combinations of source parameters owing to their different physical properties. This paper presents the first results of this extensive study. Here we present the analysis of the radio emission from the fast rotating, hot magnetic star HR 7355. We were able to reproduce multi-wavelength radio light curves for the total and the circu-
Table 1. Summary of stellar parameters for HR 7355 Parameter
Symbol
Distance [pc] Reddening [mag] Mass [M⊙ ] Equatorial Radius [R⊙ ] Photospheric Temperature [K] Rotational Period [days] Polar Magnetic Field [Gauss] Rotation Axis Inclination [degree] Magnetic Axis Obliquity [degree] References:
(1)
D E(B −V ) M∗ R∗ Tphot Prot Bp i β
ref. 236 0.065 6 3.69 17500 0.5214404 11600 60 75
1 1 1 1 1 2 1 1 1
Rivinius et al. 2013; (2) Oksala et al. 2010;
larly polarized flux density. The model simulation of the radio light curves, along with a simulation of the X-ray spectrum of HR 7355, are used to significantly constrain the physical parameters of its stellar magnetosphere. On this basis, we suggest a scenario that simultaneously explains the behavior of HR 7355 at both radio and X-ray wavelengths. In Section 2 we briefly introduce the object of this study, HR 7355. The observations used in our analyses are presented in Section 3. The radio properties of HR 7355 are discussed in detail in Section 4. Section 5 describes the model, while stellar magnetosphere is presented in Section 6. Analysis of X-ray emission of HR 7355 is provided in Section 6.2. The considerations on auroral radio emission in HR 7355 are given in section Section 7, while Section 8 summarizes the results of our work.
2 MAGNETIC EARLY B-TYPE STAR HR 7355 The early-type main sequence star (B2V) HR 7355 (HD 182180) is characterized by a surface overabundance of helium (Rivinius et al. 2008). This star evidences also a very strong and variable magnetic field (Oksala et al. 2010; Rivinius et al. 2010). The magnetic curve of HR 7355 changes polarity twice per period, and was modeled in the framework of the OMR by a mainly dipolar field, with the magnetic axis significantly misaligned with respect to the rotation axis. Among the class of the magnetic early-type stars, HR 7355 is an extraordinarily fast rotator. Only the B2.5V type star HR 5907 (Grunhut et al. 2012a) has a shorter rotation period. The rotation period of HR 7355 (≈ 0.52 days) sets it close to the point break-up, giving rise to a strong deformation from spherical (Rivinius et al. 2013). The main stellar parameters of HR 7355 are listed in Table 1. HR 7355 hosts a strong and steady magnetic field, indicating the existence of a co-rotating magnetosphere (Rivinius et al. 2013) suitable for giving rise to non-thermal radio continuum emission. HR 7355 has a flux density at 1.4 GHz of 7.9 ± 0.6 [mJy] as listed by the NVSS (Condon et al. 1998). At the tabulated stellar distance, we estimate a radio luminosity of ≈ 5 × 10¹⁷ [erg s−1 Hz−1 ], making HR 7355 one of the most luminous magnetic hot stars at radio wavelengths. Thus, HR 7355 is an ideal target to study the effects of fast rotation and the high magnetic field strength for magnetospheric radio emissions. To obtain information on the stellar wind parameters of HR 7355 we retrieved its archival UV spectra (sp39549, sp39596) obtained by the International Ultraviolet Explorer (IUE). These UV spectra were analyzed by means of non-LTE iron-blanketed model atmosphere PoWR, which treats the photosphere as well as MNRAS 000, 1–?? ()
The magnetosphere of HR 7355 Table 2. VLA observing log, Code: 15A-041
Si IV 3P - 3S
Normalized flux
2
1
0 1380
3
1390
1400 o λ/A
1410
1420
Figure 1. Detail of the IUE observation (blue solid line) vs. a PoWR model ˙ = −11 and v∞ = 500 km s−1 . (red solid line) with Teff = 15.7 kK, log(M) The synthetic spectrum was calculated for a rotating atmosphere with vsin i = 320 km s−1 as described in Shenar et al. (2014).
the the wind, and also accounts for X-rays (Gr¨afener et al. 2002; Hamann & Gr¨afener 2003; Sander et al. 2015). Already the first inspection of the spectra reveals a lack of asymmetric line profiles which would be expected for spectral lines formed in a stellar wind. In fact, Rivinius et al. (2013) were able to fit the IUE spectra of HR 7355 with a static model that does not include stellar wind, showing that its contribution must be small, and at best only upper limit could be obtained by UV spectral line modeling. We attempted to estimate the upper limit for the mass-loss rate that would be still consistent with the IUE observations. We found that in our models for the stellar parameters given by Rivinius et al. (2013) and the assumed mass-loss rate of about M˙ = 10−10 M⊙ yr−1 only the Si IV resonance line is sensitive to the mass-loss rate (see Fig. 1). As spherical symmetry is assumed for the PoWR models while Rivinius et al. (2013) found different temperatures for the pole and equator regions, we can give only a rough estimate for the mass-loss rate. For the lower temperature of 15.7 kK at the pole region the Si IV resonance line is weaker than for the higher temperatures of the equator region. Therefore we infer the upper limit of the mass-loss rate for the lower temperature and find a value of about M˙ < 10−11 M⊙ yr−1 for a spherical symmetric smooth wind to be consistent with the IUE observation. We also checked for the effect of X-rays via super-ionization but did not find a major impact on the Si IV resonance line.
ν
∆ν
[GHz]
[GHz]
Epoch
conf.
Flux cal
Phase cal
6/10/15
2
15-Apr-10
B
3C286
1924−2914
22/33/44
8
15-Apr-10
B
3C286
1924−2914
6/10/15
2
15-Jun-01
BnA
3C286
1924−2914
22/33/44
8
15-Jun-01
BnA
3C286
1924−2914
observations were done using the full array configuration at each observing bands, without splitting the interferometer in sub-arrays. To observe all the selected sky frequencies, the observations were carried out cyclically varying the observing bands. The data were calibrated using the standard calibration pipeline, working on the Common Astronomy Software Applications (CASA), and imaged using the CASA task CLEAN. Flux densities for the Stokes I and V parameters were obtained by fitting a two-dimensional gaussian at the source position in the cleaned maps. The size of the gaussian profile is comparable with the array beam, indicating that HR 7355 is unresolved for all the analyzed radio frequencies. The minimum array beam size is 0.18 × 0.12 [arcsec2 ], obtained with the BnA array configuration at 44 GHz. The errors were computed as the quadratic sum of the flux density error, derived from the bidimensional gaussian fitting procedure, and the map rms measured in a field area lacking in radio sources. 3.2 X-ray We retrieved and analyzed archival X-ray observations of HR 7355 obtained with the XMM-Newton on 2012-09-25 (ObsID 0690210401, Naz´e et al. 2014), and lasting ≈ 2.5 hr. All three (MOS1, MOS2, and PN) European Photon Imaging Cameras (EPICs) were operated in the standard, full-frame mode and a thick UV filter (Turner et al. 2001; Str¨uder et al. 2001). The data were reduced using the most recent calibration. The spectra and lightcurves were extracted using standard procedures from a region with diameter ≈ 15′′ . The background area was chosen to be nearby the star and free of X-ray sources. To analyze the spectra we used the standard spectral fitting software XSPEC (Arnaud 1996). The abundances were set to solar values according to Asplund et al. (2009). The adopted distance to the star and interstellar reddening E(B−V ) are listed in Table 1.
4 THE RADIO PROPERTIES OF HR 7355 4.1 Radio light curves
3 OBSERVATIONS AND DATA REDUCTION 3.1 Radio Broadband multi-frequency observations of HR 7355 were carried out using the Karl G. Jansky Very Large Array (VLA), operated by the National Radio Astronomy Observatory1 (NRAO), in different epochs. Table 2 reports the instrumental and observational details for each observing epoch. To maximize the VLA performances the
The magnetosphere of HR 7355 shows evidence of strong and variable radio emission. The VLA radio measurements were phase folded using the ephemeris given by Oksala et al. (2010): JD = 2 454 672.80 + 0.5214404E [days] and are displayed in Fig. 2. The left panels show the new radio data for the Stokes I (RCP + LCP, respectively Right and Left Circular Polarization state2 ), with each observing radio frequency shown individually. In the top panel of Fig. 2 is also shown the variability of
1
The National Radio Astronomy Observatory is a facility of the National Science Foundation operated under cooperative agreement by Associated Universities, Inc.
MNRAS 000, 1–?? ()
2
VLA measurements of the circular polarization state are in accordance
4
P. Leto et al.
Figure 2. Left and right top panels show the magnetic curve of HR 7355 and data taken by Oksala et al. (2010) and Rivinius et al. (2010). The other left panels show the radio light curves for Stokes I obtained at all the observing frequencies. Right panels display the rotational modulation of the fractional circularly polarized radio emission.
the logitudinal component of the magnetic field (Be ) (Oksala et al. 2010; Rivinius et al. 2010). The radio light curves for Stokes I are variable at all observed frequencies. Relative to the median, the amplitudes of the variation, with frequency are respectively: ≈ 60% at 6 GHz, ≈ 65% at 10 GHz, ≈ 62% at 15 GHz, ≈ 77% at 22 GHz, ≈ 60% at 33 GHz and ≈ 39% at 44 GHz. The JD0 of the HR 7355 ephemeris refers to the minimum of the photometric light curve (Oksala et al. 2010), corresponding to a null in the effective magnetic field curve, and to a minimum emission for the Hα (Rivinius et al. 2013). Interestingly, the radio light curves at ν 6 15 GHz show an indication of a minimum emission close to φ = 0 (see the left panels of Fig. 2). Despite not having full coverage of rotational phase, the radio light curve at ν 6 15 GHz evidences a maximum at φ ≈ 0.2, close to the maximum effective magnetic field strength, followed by another minimum that becomes progressively less deep with increasing frequency. The rotational phases covering the negative extrema of the magnetic curve are not observed at radio wavelengths, but the rising fluxes suggest that the radio light curves at ν 6 15 could be characterized by another maximum. The radio data for total intensity seems to show 2 peaks per cycle, that are related to the two extrema of the magnetic field curve. Comparison between the radio and the magnetic curves also indicates a phase lag between the radio light curves and the magnetic one. with the IAU and IEEE orientation/sign convention, unlike the classical physics usage.
At the higher frequencies (ν > 22 GHz), the shapes of the light curve are more complex, and any relation with variability in Be is no longer simple. Furthermore, it appears that the average radio spectrum of HR 7355 is relatively flat from 6 to 44 GHz (c.f., top panel in Fig. 3). The error bar of each point shown in the figure is the standard deviation of the measurements performed at a given frequency. The spectral index of the mean radio spectrum of this hot magnetic star is close to −0.1, like free-free emission from an optically thin thermal plasma. Hence, without any information regarding the fraction of the circularly polarized radio emission and its variability, the total radio intensity alone can easily be mistakenly attributed to a Bremsstrahlung radiation. Interestingly, a flat radio spectrum has been already detected in some others magnetic chemically peculiar stars (Leone et al. 2004).
4.2 Circular polarization Circularly polarized radio emission is detected from HR 7355 above the 3σ detection level, revealing a non-thermal origin for the radio emission. The right panels of Fig. 2 show the fraction πc of the circularly polarized flux density (Stokes V / Stokes I, where Stokes V= RCP − LCP) as a function of the rotational phase, and for all the observed frequencies. In the top right panel of Fig. 2, the magnetic field curve is again shown for reference. πc is variable as HR 7355 rotates, and the amplitude of the variation rises as the radio frequency increases. It appears that the amplitude of the intensity variation is larger when the circular polarization is smaller. In particular πc ranges between: ≈ −5% to MNRAS 000, 1–?? ()
The magnetosphere of HR 7355
Figure 3. Top panel: radio spectrum of HR 7355 obtained averaging all the VLA measurements performed at the same observing band. The error bars are for the standard deviation of the averaged data. The dotted line represents the power-law that best fit the average spectrum (spectral index ≈ 0.1). Bottom panel: standard deviations of the radio measurements, respectively for the Stokes I and V.
5% at 6 GHz, ≈ −9% to 8% at 10 GHz, ≈ −10% to 8% at 15 GHz, ≈ −5% to 14% at 22 GHz, ≈ −13% to 20% at 33 GHz, ≈ −16% to 26% at 44 GHz. To parameterize the amplitude of the radio light curves for the total and polarized intensity, the bottom panel of Fig. 3 shows the variation of the standard deviation (σ ) of all the measurements occuring at the same frequency, as a function of frequency. The standard deviation of the Stokes I measurements is largest at ν 6 22 GHz, whereas at 33 and 44 GHz, the standard deviations dramatically decrease, confirming the decreasing of the light curve amplitudes discussed in Sec. 4.1. By contrast the standard deviation of the measurements of the circularly polarized flux density increases as the frequency increases. Considering Fig. 3 (bottom panel), σ values for the Stokes I and V measurements are evidently inversely related. Comparing the curves of variation of πc with the magnetic field curve, a positive degree of circular polarization is detected when the north magnetic pole is close to the line-of-sight, and is negative when the south pole is most nearly aligned with the viewing sightline. When the magnetic poles are close to the direction of the line-of-sight, we observe most of the radially oriented field lines. In this case the gyrosynchrotron mechanism gives rise to radio emission that is partially polarized, respectively right-handed for the north pole and left-handed for the south pole. This behavior of the gyrosynchrotron polarized emission has already been recognized, at ν 6 15 GHz, in the cases of CU Vir (Leto et al. 2006) and σ Ori E (Leto et al. 2012), that have magnetospheres defined mainly by a magnetic dipole, similar to the case of HR 7355. Our new radio measurements show, for the first time, this behavior persisting up to ν = 44 GHz for HR 7355. Furthermore, the light curves of πc show that the magnetic field component close to the stellar surface can be traced with the circularly polarized emission at high frequency. MNRAS 000, 1–?? ()
5
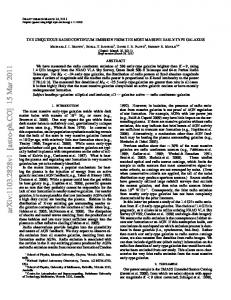
Figure 4. Meridional cross-section of the magnetospheric model for a hot magnetic star, characterized by a simple dipolar magnetic field, and with the dipolar axis misaligned with respect to the rotation axis (the misalignment amplitude is arbitrary). The grey area indicates the thermal plasma trapped within the inner magnetosphere. The equatorial region of the magnetosphere outside the Alfv´en surface (dashed line) is a site of magnetic reconnection events, capable of accelerating the in situ plasma. The length (l) of the non-thermal acceleration region, just outside the equatorial Alfv´en radius (RA ), is also shown. The magnetic shell, middle-magnetosphere, where the non-thermal electrons (indicated by the small vectors) propagate toward the stellar surface, radiate by the gyro-synchrotron emission mechanism, is delimited by the two pictured magnetic field lines.
5 THE MODEL In previous papers (Trigilio et al. 2004; Leto et al. 2006), we developed a 3D model to simulate the gyrosynchrotron radio emission arising from a stellar magnetosphere defined by a dipole. In the case of the hot magnetic stars, the scenario attributes the origin of their radio emission as the interaction between the large-scale dipolar magnetic field and the radiatively driven stellar wind. Following this model the plasma wind progressively accumulates in the magnetospheric region where the magnetic field lines are closed (inner magnetosphere). The plasma temperature linearly increases outward, whereas its density linearly decreases (Babel & Montmerle 1997; ud-Doula et al. 2014). Outside the Alfv´en surface, the magnetic tension is not able to force corotation of the plasma. Similar to the case of Jupiter’s magnetosphere (Nichols 2011), the co-rotation breakdown powers a current sheet system where magnetic reconnection accelerates the local plasma up to relativistic energies (Usov & Melrose 1992). A fraction of the non-thermal electrons, assumed to have a power-law energy spectrum and an isotropic pitch angle distribution (i.e., the angle between the directions of the electron velocity and the local magnetic field vector), can diffuse back to the star within a magnetic shell that we here designate as the ”middle magnetosphere”. This non-thermal electron population has a homogeneous spatial density distribution within the middle magnetosphere, owing to magnetic mirroring. A cross-section of the stellar magnetosphere model is pictured in Fig. 4. The non-thermal electrons moving within the middle magnetosphere radiate at radio wavelengths by the gyro-synchrotron
6
P. Leto et al.
Table 3. Free parameters
Alfv´en radius [R∗ ] Thickness of the middle magnetosphere [R∗ ] Non thermal electron density [cm−3 ] Relativistic electron energy power-law index Thermal electron density at the stellar surface [cm−3 ]
Symbol
Range
Simulation step
RA l nr δ n0
8 – 50 1 – 40 102 – 105 2–3 108 – 1010
∆ log RA ≈ 0.1 ∆ log l ≈ 0.2 ∆ log nr ≈ 0.1 ∆δ = 0.5 ∆ log np0 ≈ 0.25
Model solutions with δ = 2.5 Thermal electron density at the stellar surface Alfv´en radius Column density of the non thermal electrons
n0 = 3 × 10⁹ [cm−3 ] RA = 12.5 – 40 [R∗ ] (2.68±0.07) nr × l = 10(12.95±0.09) × RA [cm−2 ]
Model solutions with δ = 2 Thermal electron density at the stellar surface Alfv´en radius Column density of the non thermal electrons
emission mechanism. To simulate the radio emission arising from these non-thermal electrons, the magnetosphere of the star is sampled in a three dimensional grid, and the physical parameters needed to compute the gyrosynchrotron emission and absorption coefficients are calculated at each grid point. As a first step, we set the stellar geometry: rotation axis inclination (i), and tilt of the dipole magnetic axis (β ), and the polar field strength (Bp ). In the stellar reference frame, assumed with the z-axis coinciding with the magnetic dipole axis, the space surrounding the star is sampled in a 3D cartesian grid, and the dipolar magnetic field vector components are calculated at each grid point. Given the stellar rotational phase (φ ), the field topology is then rotated in the observer reference frame (see procedure described in App. A of Trigilio et al. 2004). In the second step, we locate the magnetospheric subvolume where the unstable electron population propagates. This spatial region is delimited by two magnetic field lines. The inner line intercepts the magnetic equatorial plane at a distance equal to the Alfv´en radius (RA ). The outer line intercepts the equatorial plane at a distance RA + l, with l being the width of the current sheet where magnetic reconnection accelerates the local plasma up to relativistic energies. Within each grid point of the middle magnetosphere, the non-thermal electrons have a constant number density (nr ). By contrast the inner magnetosphere is filled by a thermal plasma with density and temperature that are functions of the stellar distance as previously described. In the third step, given the observing radio frequency ν , we calculate the emission and absorption coefficients for the gyrosynchrotron emission (Ramaty 1969) at the grid points that fall within the middle magnetosphere. For each grid point of the inner magnetosphere, the free-free absorption coefficient (Dulk 1985), the refractive index, and the polarization coefficient for the two magneto-ionic modes (Klein & Trotter 1984) are computed. We are able to solve numerically the radiative transfer equation along the directions parallel to the line-of-sight for the Stokes I and V (as described in the App. A of Leto et al. 2006). Scaling the result for the stellar distance, and repeating these operations as a function of the rotational phase, φ , synthetic stellar radio light curves are calculated, and then simulations are compared with observations.
n0 = 2 – 5 × 10⁹ [cm−3 ] RA = 10 – 40 [R∗ ] (2.44±0.03) nr × l = 10(12.48±0.04) × RA [cm−2 ]
5.1 Modeling the HR 7355 radio emission On the basis of the model described in previous section, we seek to reproduce the multi-wavelength radio light curves of HR 7355 for Stokes I and V. The already known stellar parameters of HR 7355, needed for the simulations are listed in Table 1. The Alfv´en radius (RA ) and the length of the current sheet (l) have been assumed as free parameters. For the sampling step, we adopt a variable grid with a narrow spacing (0.1 R∗ ) for distances lower then 8 R∗ , a middle spacing (0.3 R∗ ) between 8 and 12 R∗ , and a rough spacing (1 R∗ ) for distances beyond 12 R∗ . Following results obtained from simulations of radio emissions of other hot magnetic stars (Trigilio et al. 2004; Leto et al. 2006), the low-energy cutoff of the power-law electron energy distribution has been fixed at 100 keV, corresponding to a Lorentz factor γ = 1.2. The temperature of the thermal plasma at the stellar surface has been set equal to the photospheric one (given in Tab. 1), whereas its density (n0 ) has been assumed as a free parameter. The assumed values of the model, free parameters, and the corresponding simulation steps are listed in Table 3. Adopting these stellar parameters, we were able to simulate radio light curves for the Stokes I and V that closely resemble the measurement of HR 7355. The corresponding ranges of the model parameters are reported in Table 3. The Fig. 5 displays the envelope of the simulated light curves, for the Stokes I and V respectively, that closely match the observed ones. This envelope was obtained from the simultaneous visualization of the whole set of simulations performed using the combinations of the model free parameters listed as model solutions in Table 3. The simulations indicate that gyro-synchrotron emission from a dipole-shaped magnetosphere can closely reproduce the observations of HR 7355. The low-frequency Stokes I radio emission shows a clear phase modulation, that becomes progressively less evident as the frequency increases. Conversely the simulations of the light curves for the Stokes V indicates that the circularly polarized emission is strongly rotationally modulated, with an amplitude that increases with frequency. Such behavior of the simulated radio light curves is consistent with the measurements. To highlight the close match between simulations and observations, we also compared the simulated radio spectra with the obMNRAS 000, 1–?? ()
The magnetosphere of HR 7355
7
Figure 5. The filled circles are the HR 7355 observed radio light curves, respectively of the total intensity (Stokes I), and of the circularly polarized flux density (Stokes V). The grey areas are the envelope of the modeled light curves obtained by using the combinations of the free parameters able to generate synthetic light curves that close match the observed ones. The corresponding model solutions are listed in Table 3. Top panels shown the model solutions with δ = 2.5, bottom panels those with δ = 2.
served spectrum. The synthetic spectra were realized averaging the simulated light curves at each frequency. In the top and middle panels of Fig. 6, the observed spectrum of HR 7355 is shown again, and the superimposed shaded area represents the envelope of the simulated spectra for the Stokes I. In the bottom panel of Fig. 6 the standard deviation (σ ) of the observed and simulated multi-frequency light curves (Stokes I and V) have been compared. In the case of the model simulations, more than one spectrum was produced. The σ values pictured in the bottom panel of Fig. 6 are the averages of the standard deviations corresponding to the whole set of simulated light curves. The top panel of Fig. 6 refers to the model simulations with parameters δ = 2.5, whereas the middle panel is for the δ = 2 case. The σ of the simulated HR 7355 radio emission seems to be larger than the observed ones. Such behavior is confirmed when looking at the bottom panel of Fig. 6. In particular the σ of the light curves with δ = 2.5 are highest. This behavior suggests that the value of δ = 2, for the spectral index of the non-thermal electron, could be close to the true value. But we must also take into account that, the magnetosphere of this rapidly rotating star could be oblate, whereas our model assumes a simple dipole. The stretching of the magnetosphere could affect the magnetic field topology of the regions where the radio emission at the observed frequencies MNRAS 000, 1–?? ()
originate. The effect of the plasma inertia to the magnetic field configuration is an issue outside the limit of our model. In any case, this mismatch between the dipolar and the true stellar magnetic topology could explain the differences between observations and simulations. Furthermore, has been proven that within the HR 7355 magnetosphere there are cloud the dense plasma (with linear size ≈ 2 R∗ ) co-rotating with the star (Rivinius et al. 2013), that could affect the rotational modulation of the stellar radio emission. The modeling approach followed to simulate the radio light curves of HR 7355 does not take into account for the presence of such material. On the basis of this considerations we cannot exclude that the spectral index of the non thermal electrons could be close to δ = 2.5. In any case, the higher dispersion of the simulations with respect to the observations can be explained as a consequence of the coverage for the observed radio light curves not being complete. In fact, we are missing some portions of the light curves that are expected to be highly variable. On the other hand, the frequency dependence of the standard deviations of the simulated Stokes I and V radio light curves are similar to the observed ones (see bottom panel of Fig. 6). This is further evidence of the good fit of our model for describing the radio magnetosphere of HR 7355.
8
P. Leto et al.
Figure 7. Graphical view of the analytic equation that describes the column density of the non-thermal electrons (given in Table 3), calculated close to the acceleration site, as a function of the values of RA that are able to give simulated radio light curves matching the observed ones. The dotted line corresponds to the model solutions with δ = 2; the dashed line with δ = 2.5. Note acceptable model solutions are not found for RA < 12.5 R∗ with δ = 2.5. The grey areas highlight the solution uncertainty. Figure 6. Top and middle panels: like Fig. 3, the filled circles are the average measured radio spectrum of HR 7355. The grey areas are the envelope of the averages from simulated radio spectra corresponding to the model solutions with δ = 2.5 (top panel), and with δ = 2 (middle panel). In the bottom panel, the standard deviations of the observations (continuous lines) and simulations (dashed lines corresponding to δ = 2.5, and dotted lines corresponding to δ = 2) are compared. The thick lines correspond to the total intensity (Stokes I), the thin lines to the circularly polarized flux density (Stokes V).
6 THE MAGNETOSPHERE OF HR 7355 6.1 Radio diagnostic Analysis of model solutions for the observed multi-wavelength radio light curves of HR 7355, respectively for the Stokes I and V, can be used to constrain the physical conditions of the magnetosphere of this hot star. The thermal electron density at the stellar surface (n0 ) is well constrained. We found acceptable light curves for Alfv´en radii greater than 10 R∗ . The other two model free parameters are degenerate, namely the non-thermal electron density (nr ) and the length of the current sheet (l). The product of these two parameters is the column density of relativistic electrons at the Alfv´en radius. We found that the column density is a function of RA , the mathematical relationship, obtained by fitting these parameters, is provided in Table 3, and pictured in Fig. 7. The value of the Alfv´en radius is related to the wind of HR 7355. In Trigilio et al. (2004) we computed RA given the magnetic field strength, the wind mass-loss rate, its terminal velocity (v∞ ), the stellar radius, and the rotation period. In the present analysis, we reverse this approach: given v∞ and the rotation period, ˙ of HR 7355 that are comwe estimate the mass-loss rates (M) patible with the values of RA listed in Table 3. We assume two values of wind terminal velocity that are reasonable for a main sequence B type star (Prinja 1989; Oskinova et al. 2011; Krticka ˙ 2014): v∞ = 500 and 1000 [km s−1 ]. Fig. 8 shows the values of M, and the corresponding pressure, as a function of RA . The highest values of RA need a low wind mass-loss rate. The model simulation provide an estimate for the density
of the thermal plasma trapped within the inner magnetosphere of HR 7355. The adopted radial dependence for the plasma temperature and density are respectively: n = n0 r−1 and T = Teff r, hence the thermal pressure (p = kB nT ) is constant inside the inner magnetosphere. In steady state p = pram , where pram is the wind ram pressure. In the bottom panel of Fig. 8 the grey area represents the thermal pressure of the plasma trapped in the inner magnetosphere. Those solutions that do not satisfy the above equality condition cannot be considered valid. The average Alv´en radii that are physically plausible are listed in Table 4. The corresponding wind mass loss rate, the density of the wind at the Alv´en radius, the average thermal temperature of the plasma trapped within the inner magnetosphere, as well as the corresponding emission measure are also listed in Table 4. In the case of a dipolar shaped magnetosphere (see Fig. 4), the radiatively driven stellar wind can freely propagate only from the northern and southern polar caps. As a consequence, the ac˙ The fraction of the tual mass loss rate (M˙ act ) is a fraction of M. wind that freely propagates can be estimated from the ratio between the two polar caps area and the whole surface. The polar caps area is derived from the relation defining the dipolar magnetic field line: r = RA cos λ 2 (where λ is the magnetic latitude). In fact, the point where the field line, with a given RA , crosses the stellar surface individuates the latitude of the polar cap. The values of M˙ act , listed in Table 4, are in good agreement with those obtained from the UV spectral analyses of HR 7355 (see Sec. 2) and other B-type stars with similar spectral types (Prinja 1989; Oskinova et al. 2011; Krticka 2014) The indirect evaluation of the linear extension of the radio emitting region is also useful for estimating the brightness temperature of HR 7355. The average flux densities for HR 7355 are ≈ 15.5 mJy, in the frequency range 6–44 GHz. Assuming the mean equatorial diameter of the Alfv´en surface (31 R∗ ) for the source size, the corresponding brightness temperature is Tbril ≈ 3 × 10¹⁰ [K]. The above estimate reenforces the conclusion that the radio emission from HR 7355 has a non-thermal origin. It is instructive to compare the results obtained from the analMNRAS 000, 1–?? ()
The magnetosphere of HR 7355
9
Figure 9. Radial dependence of the magnetic field strength in the equatorial plane of HR 7355 (continuous line), and CU Vir (dashed line). The ranges of the Alfv´en radii of the two stars and the corresponding magnetic field strengths are indicated. Figure 8. Top panel: values of the wind mass-loss rate corresponding to the range of Alfv´en radii derived by the model simulations of the multiwavelength radio light curves of HR 7355. The values of M˙ have been derived assuming two reasonable values for a main sequence B-type star wind terminal velocity. Bottom panel: wind pressure at the Alfv´en radius. Dotted line refers to the case v∞ = 500 [km s−1 ], dashed line to v∞ = 1000 [km s−1 ]. The grey area indicates the range of pressures from the thermal plasma trapped within the inner magnetosphere.
Table 4. Derived parameters of HR 7355
< M˙ > [M⊙ yr−1 ] M˙ act [M⊙ yr−1 ] nw (RA ) [cm−3 ] < T > [MK] EM [1055 cm−3 ]
v∞ [km s−1 ]
< RA >
v∞ [km s−1 ]
< RA >
[R∗ ]
500
14
1000
17
4.2 × 10⁻¹⁰ 1.5 × 10⁻¹¹ 2.0 × 10⁶ 0.16 2.22
[R∗ ]
2.5 × 10⁻¹⁰ 0.7 × 10⁻¹¹ 0.4 × 10⁶ 0.19 2.72
ysis of radio emission from HR 7355 and from the Ap star CU Vir conducted using similar approach (Leto et al. 2006). For example, the wind electron density number at the Alv´en surface, nw (RA ), has similar values for both stars. The estimated column density of the relativistic electrons at the Alv´en radius lies in the range 3.2– 4.6 × 10¹⁴ [cm−2 ] in the case of CU Vir, versus a column density that ranges between 1.9 × 10¹⁵ and 3.0 × 10¹⁵ [cm−2 ] for HR 7355. This is even higher in the case of the HR 7355 model solutions with δ = 2.5: the derived range is 1.1–1.8 × 10¹⁶ [cm−2 ]. For the case of δ = 2, column density of the non-thermal electrons for HR 7355 is higher by about an order of magnitude as compared to CU Vir. Under the reasonable assumption that HR 7355 and CU Vir have similar non-thermal acceleration efficiencies, the higher nonthermal electron column density of HR 7355 could be explained if it is characterized by a more extended acceleration region as compared to CU Vir. The magnetosphere of HR 7355 is bigger than CU Vir, with R∗ = 3.69 versus 2.06 R⊙ for CU Vir (Kochukhov et al. 2014), and so the linear size of the acceleration region (l) will be consequently wider for HR 7355. Furthermore, the B2 type star HR 7355 has a higher stellar mass compared to the Ap star CU Vir, 6 versus 3.06 M⊙ (Kochukhov et al. 2014). Their MNRAS 000, 1–?? ()
Kepler corotation radii (RK = (GM∗ /ω 2 )1/3 ) are respectively: 1.3 R∗ for HR 7355, 1.9 R∗ for CU Vir. Comparing the above estimated values of RK with the average Alfv´en radii, respectively 15.5 for HR 7355, and 14.5 [R∗ ] for CU Vir. The ratio RA /RK for the HR 7355 CM magnetosphere is ≈ 11.9, versus ≈ 7.6 in the case of CU Vir. The above estimation highlights that HR 7355 is characterized by a larger magnetospheric volume maintained in rigid co-rotation compared with that of CU Vir. We also compare the magnetic field strength at the Alfv´en radius for both stars. The two stars have similar rotation periods (≈ 0.52 d), but HR 7355 has a larger size, and a stronger polar magnetic field strength (11.6 kG versus 3.8 kG, Kochukhov et al. 2014). The radial dependence for a simple magnetic dipole at the equatorial plane is described by Beq = 1/2Bp (R∗ /r)3 [Gauss], and is plotted in Fig. 9. The ranges of the allowed RA values, given in units of solar radii, are shown for both stars. The corresponding magnetic field strengths are derived. Fig. 9 makes clear that the current sheet region of HR 7355 is characterized by a magnetic field strength of roughly double the value of the case for CU Vir. From a purely qualitative point-of-view, it is reasonable to assume the non-thermal acceleration process operates within a thicker middle magnetosphere for HR 7355. At the distances of the two analyzed stars, D = 236 pc for HR 7355 and D = 80 pc for CU Vir, their radio luminosities are respectively, ≈ 1018 [erg s−1 Hz−1 ], obtained using the average radio flux density measured in this paper; and ≈ 3 × 10¹⁶ [erg s−1 Hz−1 ], using the mean of the measured flux densities listed in Leto et al. (2006). As discussed above, the two stars are characterized by different radio emitting volumes. For HR 7355 the non-thermal electrons also travel within magnetospheric regions at higher magnetic field strength. Using a model for gyrosynchrotron emission, the magnetic field strength directly affects the observed radio flux density level (Leto et al. 2006). Taking into account the various physical differences, we are able to explain qualitatively why HR 7355 is a brighter radio source as compared to CU Vir.
6.2 X-ray diagnostic The X-ray flux of HR 7355 in the 0.2–10 keV band measured by the XMM-Newton is ≈ 1.6 × 10⁻¹³ erg cm−2 s−1 (see Table 5). This is orders of magnitude higher that may be expected if plasma emitting
3.2
Two temperature thermal model kT1 [keV] EM1 [1051 cm−3 ] kT2 [keV] EM2 [1051 cm−3 ] hkT i ≡ ∑i kTi · EMi / ∑i EMi [keV] Fluxb [10−13 erg cm−2 s−1 ]
0.9 ± 0.2 4.4 ± 1.9 3.9 ± 0.8 46.2 ± 4.9 3.6 1.6
Thermal plus power-law (A(E) = KE −α ) model kT1 [keV] EM1 [1051 cm−3 ] α K [photons keV−1 cm−2 s−1 at 1 keV] Fluxb [10−13 erg cm−2 s−1 ] LbX [erg s−1 ] log LX /Lbol LX /Lν ,rad [Hz] a b
1.0 ± 0.1 6.5 ± 1.5 1.7 ± 0.1 (1.9 ± 0.2) × 10−5 1.7 1.1 × 1030 −6.5 1.1 × 10¹²
correspond to the ISM hydrogen column density dereddened; in the 0.2–10 keV band
in radio regime would be solely responsible for the X-ray generation – using the average temperature and emission measure listed in Table 4, the expected X-ray flux is only ≈ 10−15 erg cm−2 s−1 . Thus, a cold thermal plasma component responsible for the radio emission alone cannot explain the observed X-rays from HR 7355. Comparing the X-ray and the radio emission of HR 7355 to that of late-type stars reveals significant differences (see Table 5). HR 7355 violates the empirical relation coupling the X-ray and radio luminosities of magnetically active stars (LX /Lν ,rad ≈ 1015.5 Hz, Gu¨edel & Benz 1993; Benz & Gu¨edel 1994), which is valid among stars distributed within a wide range of spectral classes (from F to early M stars). This is clear evidence that the physical mechanisms for the radio and X-ray emissions operating in an early B-star like HR 7355 are distinct from coronal mechanisms operating in the intermediate- and low-mass main sequence stars. Yet, somewhat surprisingly, the deviation of the early type HR 7355 from the Gu¨edel–Benz relation is similar to that for the stars at the bottom of the main sequence – the ultra cool dwarfs with spectral type later than M7 (Berger et al. 2010; Williams, Cook & Berger 2014; Lynch et al. 2016). These important similarities between active ultra cool dwarfs and a strongly magnetic B star indicate that radio and X-ray emission in their magnetospheres may be produced by related physical mechanisms and provide useful hints for the latter. According to the MCWS model, the thermal plasma responsible for X-ray emissions from magnetic B-type stars is produced by stellar wind streams colliding at the magnetic equator. The radio wavelengths are instead sensitive to only the cold thermal plasma that accumulates at the higher magnetic latitudes. Consequently, the X-ray emission provides a different set of constraints on the physical conditions in the magnetosphere of HR 7355. We have analyzed the archival XMM-Newton measurements.
10−3
NHa [1020 cm−2 ]
10−4
Table 5. The X-ray spectral parameters derived from the XMM-Newton EPIC observations of HR 7355 assuming two-temperature CIE plasma (apec) (tbabs) model and apec+powerlaw model, both models corrected for the interstellar absorption. The values which have no error have been frozen during the fitting process. The spectral fits corresponding to the the apec+powerlaw model are shown in Fig. 10.
0.01
P. Leto et al.
normalized counts s−1 keV−1
10
0.5
1 2 Energy (keV)
5
Figure 10. XMM-Newton PN (upper curve), and MOS1 and MOS2 (lower curves) spectra of HR 7355 with error bars corresponding to 3σ with the best fit thermal plus power-law model (solid lines). The model parameters are shown in Table 5.
First, the observed spectrum in 0.2-10.0 keV band was fit with a thermal two-temperature spectral model that assumes optically thin plasma in collisional equilibrium. The fit is statistically significant, with reduced χ 2 = 0.72 for 88 degrees of freedom. The model fit parameters are shown in Table 5. The two-temperature components are well in accord with the values listed by Naz´e et al. (2014). The thermal plasma is extraordinarily hot, with the bulk of the plasma at a temperature 3.6 keV (40 MK). This is significantly hotter than usually found in magnetic B-stars (Oskinova et al. 2011; Naz´e et al. 2014; Ignace et al. 2013; Oskinova et al. 2014). In the framework of the MCWS model, the wind plasma streams that collide at the magnetic equator give rise to a shock that heats the plasma. Hence, the maximum temperature follows from a Rankine-Hugoniot condition and cannot exceed a value determined by the maximum stellar wind velocity. In the analysis presented in Sect. 6.1, we assumed two distinct wind velocities, 500 km s−1 and 1000 km s−1 , that encompass values plausible for a main sequence B-type star (Prinja 1989; Oskinova et al. 2011; Krticka 2014). Using Eq. 10 from ud-Doula et al. (2014), we estimate the maximum plasma temperatures that can be produced via a magnetically confined wind shock for these two wind speeds; these temperatures are respectively: 3.5 MK and 14 MK – significantly lower than that deduced from the X-ray spectral analysis. This led us to conclude that the assumption of the hard part of X-ray spectrum being produced by the hot thermal plasma is not realistic. Therefore, as a next step, we attempted to fit the HR 7355 spectra with an absorbed power-law model, however no satisfactory fit could be obtained. Finally, we fit the observed X-ray spectrum by combining thermal and power-law models. The resulting fit, corresponding to the power-law plus thermal model, is shown in Fig. 10. A high-quality fit with reduced χ 2 = 0.725 for 89 degrees of freedom was obtained. Based on spectral fitting, the 2T thermal model has no preference over a model that combines thermal and power-law (non-thermal) components. The model fit parameters are shown in Table 5. The temperature of the thermal X-ray plasma in this combined model, ≈ 10 MK, is easier to reconcile with a typical wind velocity of a B2V star. A more complex model involving two temperatures plus a power-law, can also be fit to the MNRAS 000, 1–?? ()
The magnetosphere of HR 7355
11
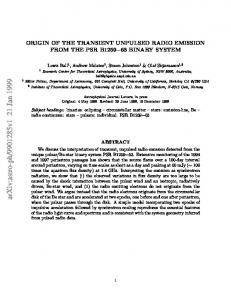
Figure 11. Meridian cross section of the model of the HR 7355 magnetosphere, that summarize where the radio and the X-ray emission originate. The wind streams, arising from the two opposite stellar hemispheres, collide at the magnetic equator (dark grey area) giving rise to plasma heating and consequently X-ray emission. The colder thermal plasma accumulates at the higher magnetic latitudes (grey area), this plasma do not emit at X-ray but have a crucial role to explain the observed rotational modulation of the radio emission. Outside the Alfv´en surface the co-rotation breakdown take place with a consequent formation of current sheet systems that are site of non-thermal electron injection. The relativistic electrons that propagate toward the stellar surface (schematically represented by the small arrows) radiate at the radio regime by the incoherent gyro-synchrotron emission mechanism. The fraction of non-thermal electrons that impact with the stellar surface emit auroral X-ray emission, manifested in the X-ray spectrum by the non-thermal X-ray component.
observed spectra, yielding marginally better fitting statistics, however we choose the simplest models. To investigate on the origin of the power-law X-ray component in the HR 7355 spectrum, it is useful to consider the Sun. The solar flare X-ray spectrum usually shows a hard X-ray component with a power-law energy distribution (Hudson & Ryan 1995), well explained as bremsstrahlung from a non-thermal electron population (Brown 1971). For the non-thermal bremsstrahlung emission, the observed X-ray spectral index (α ) is related to the spectral index (δ ) of the injected non-thermal electrons. For a thicktarget bremsstrahlung emission, δ and α are related as follow: δ = α + 1. In the case of HR 7355, if we assume that its powerlaw X-ray emission is generated by the impact with the stellar surface of the same non-thermal electron population responsible of the gyro-synchrotron radio emission, it is possible to estimate a value δ = 2.7 of the spectral index of these energetic electrons. The simMNRAS 000, 1–?? ()
ulation of the radio emission of HR 7355 indicates that the nonthermal electrons have a spectral index of δ = 2–2.5. The above range of values is not quite consistent with the value derived by the spectrum of the X-ray photons, but is however close. This suggests that the thick-target bremsstrahlung emission from a non-thermal electron population that impacts with the stellar surface is a plausible explanation for the origin of the power-law component detected in the X-ray spectrum of HR 7355. Similarly to the Solar case, it is likely that not only electrons, but also protons are accelerated in HR 7355. In some solar flares the observable effects of these two different populations of high energy particles have been recognized in the X- and the gamma-ray domain. The electrons radiate hard X-rays by thick-target bremsstrahlung emission, whereas the protons, that interact with the ions at the stellar surface, radiate gamma-rays (see Aschwanden 2002 and references here reported).
12
P. Leto et al.
These effects, if present, will open a new high energy observational window to the hot magnetic stars. The mechanism responsible for this power-law X-ray spectral component has an important difference with the case of solar flares. During a solar flare, the energetic electrons are impulsively injected, whereas for hot star magnetospheres, the nonthermal electrons are continuously accelerated. The latter mechanism is similar to the auroras from the magnetized planets in the solar system. Thus, we suggest that the X-ray emission from HR 7355 is physically analogous to the X-ray from Jupiter’s aurora as measured by XMM-Newton in November 2003. The Jovian X-ray spectrum has been modeled using a combination of thermal and power-law components (Branduardi-Raymont et al. 2007). The power-law X-ray component dominates at the high energies of the XMM-Newton spectral range (X-ray photons with energies higher then 2 keV), and is explained in terms of bremsstrahlung emission of the precipitating electrons with energies of ≈ 100 keV (Branduardi-Raymont et al. 2008). This high-energy electron population is generated far from the planet (20–30 Jupiter radii), in the co-rotation breakdown region of Jupiter’s magnetosphere. The mechanism we propose for the non-thermal electron acceleration in hot magnetic stars resembles the acceleration of highenergy electrons in Jupiter’s atmosphere. For the stellar magnetospheres, the co-rotation background region coincides with the equatorial current sheet outside the Alv´en radius (see Fig. 4). The non-thermal electrons are responsible for the gyro-synchrotron radio emission of HR 7355 and have a power-law energy distribution with a low-energy cutoff at 100 keV. These particles can be, also, responsible for the power-law component in the HR 7355 X-ray spectrum, as a consequence of the bremsstrahlung at the stellar surface. In this case, the bremsstrahlung X-ray emission arises from an annular region around the pole. The existence of a well defined spatial location of the hard X-ray source region could produce a smooth modulation of the X-ray emission as the star rotates. Unfortunately the short archival XMM-Newton observations did not sample the stellar rotation period, so no conclusions can be drawn yet about the variability of the power-law component in the HR 7355 X-ray spectrum. We intend to remedy this observational shortcoming in future. In Figure 11 we present the model sketch that may explain simultaneously the radio and the X-ray emission of HR 7355. The thermal X-ray component arises from the hot plasma that is shocked by the impact between stellar wind flows from opposing stellar hemispheres. The colder thermal plasma that accumulates in the the inner-magnetosphere does not significantly contribute to the X-rays, but explains the rotational modulation of the radio emission. The stellar radio emission originates from a non-thermal electron population moving inside the magnetic cavity that is defined by the field lines that intercept the magnetic equator outside the Alv´en radius, coinciding with the magnetospheric regions where the co-rotation breakdown take place, and where the current sheet systems accelerate the electrons up to relativistic energies. These precipitating non-thermal electrons could give rise to stellar auroral signatures, like the non-thermal X-ray emission from the polar caps.
7 IS THERE AURORAL RADIO EMISSION FROM HR 7355? The non-thermal electron population injected in the stellar magnetosphere close to the Alfv´en radius, and which moves toward
Figure 12. Top panel: effective magnetic field curve of HR 7355, are from Rivinius et al. (2010) and Oksala et al. (2010), a sinusoidal fit of the data is superimposed. Bottom panel: phase coverage of the radio observations. The y-axis on the right indicates the distances of the layers where the observing frequencies coincide with the second harmonic of the local gyro-frequency. Gray areas represent a phase interval that is 5% of the full rotation period; the light-gray areas represent an interval of ∆φ = 10% around the phases where the effective magnetic field of HR 7355 is null.
the star, is responsible for the incoherent gyro-synchrotron radio emission of HR 7355. The electrons with velocities almost parallel with the magnetic field lines (i.e., low pitch angle) can deeply penetrate within the stellar magnetosphere, and are responsible for the X-ray auroral spectral features, as discussed in Sec. 6.2. Non-thermal electrons that impact the stellar surface are lost to the magnetosphere. As a consequence, the distribution of the nonthermal electrons reflected outside (by the magnetic mirroring) will be deprived of electrons with quite low pitch-angle values. This is a suitable condition to develop the unstable electron energy distribution, known as the loss-cone distribution (Wu & Lee 1979; Melrose & Dulk 1982). This inverted electron velocity distribution can trigger the coherent Electron Cyclotron Maser (ECM) emission mechanism. The ECM amplifies the extraordinary magneto-ionic mode, producing highly circularly polarized radiation (≈ 100%), at frequencies close to the first few harmonics of the local gyrofrequency (νB = 2.8 × 10⁻³ B/Gauss GHz); however, the fundamental harmonic is probably suppressed by gyro-magnetic absorption effects (Melrose & Dulk 1982). The ECM is the process that generates the broad-band auroral radio emission of the magnetized planets of the solar system (Zarka 1998), of the two magnetic stars CU Vir (Trigilio et al. 2000, 2008, 2011; Ravi et al. 2010; Lo et al. 2012) and HD 133880 (Chandra et al. 2015), and, of the Ultra Cool Dwarfs (Berger 2002; Burgasser & Putman 2005; Antonova et al. 2008; Hallinan et al. 2008; Route & Wolszczan 2012, 2013; Williams et al. 2015; Kao et al. 2016). The auroral radio emission arises from the thin densitydepleted magnetic cavity related to the auroral oval at the polar caps. This kind of coherent radio emission is efficiently amplified MNRAS 000, 1–?? ()
The magnetosphere of HR 7355 within a narrow beam pattern tangentially directed along the cavity wall (i.e., the laminar source model, Louarn & Le Queau 1996a,b), giving rise to a radio light house effect. In the case of the Earth Auroral Kilometric Radiation (AKR), this highly directional coherent radiation is upward refracted by the dense thermal plasma trapped outside the auroral cavity (Mutel, Christopher & Pickett 2008; Menietti et al. 2011). The auroral radio emission from CU Vir was first discovered at 1.4 GHz as intense (≈ 1 order of magnitude brighter then the incoherent radio emission) radio pulses that were 100% circularly polarized (Trigilio et al. 2000). This amplified emission from CU Vir has also been detected at 2.5 GHz (Trigilio et al. 2008), and at 600 MHz (Stevens & George 2010). The pulse arrival times are observed to be a function of the observing frequency (Trigilio et al. 2011), a signature of frequency-dependent refractive effects suffered by the CU Vir auroral radio emission. The radio pulses, related to the auroral radio emission from a dipole-shaped magnetosphere, occur when the magnetic dipole axis lies in the plane of the sky (cross-over phases), with a duration of 5–10% of the rotational period. The features of the auroral radio emission arising from the CU Vir magnetosphere has been successfully modeled using a simple dipole shape (Leto et al. 2016). Our source HR 7355 has a stellar geometry, rotation, and magnetic dipole obliquity suitable for detection of its auroral radio emission. In fact, as evident from the top panel of Fig. 12, the curve for the magnetic field shows a change of net polarity twice per rotation. The phase coverage of the radio observations presented in this paper has good sampling at the cross-over phases at each observing frequency (see bottom panel of Fig. 12). At the frequencies ranging from 6 to 44 GHz, the radio measurements of HR 7355 do not show any hint of auroral radio emission. As previously explained, the stellar auroral radio emission at a given frequency originates in the magnetospheric regions where the second harmonic of the local gyro-frequency is close to the observing frequency. In the case of CU Vir (Bp = 3800 [Gauss], Kochukhov et al. 2014), emission from the ECM arises from magnetospheric layers located between ≈ 1 and ≈ 2.3 stellar radii above the stellar surface. Scaling to the polar strength of HR 7355 (Bp = 11600 [Gauss], Rivinius et al. 2013), the selected observing bands, tuned at the frequencies of the second harmonic of the gyro-frequency, arise from magnetospheric layers with r ranging between 1.14 and 2.21 R∗ (see the right y-axis of the bottom panel of Fig. 12), that correspond to layers that are located at heights lower than ≈ 1.2 stellar radii from the surface of the star. On the other hand, from the model simulations of the radio light curves of HR 7355 (this paper) and CU Vir (Leto et al. 2006), we note that the thermal plasma trapped within the magnetosphere of HR 7355 has a higher density as compared to CU Vir. The auroral radio emission arising from the deeper magnetospheric layers of HR 7355 may suffer absorption effects. Up to now, we have no radio measurements at frequencies below 6 GHz, corresponding to layers further out in radius where conditions would be more conducive for the detection of auroral radio emission from HR 7355. Consequently, it is not possible at this time to draw firm conclusions regarding the production of auroral radio emission at HR 7355.
8 SUMMARY AND CONCLUSIONS In this paper we have presented an extensive analysis of the rigidly rotating magnetosphere of the fast rotating B2V star, HR 7355. This MNRAS 000, 1–?? ()
13
study has been made using radio (VLA) and X-ray (XMM-Newton) observations. The radio measurements of HR 7355 cover a large frequency range, from 6 to 44 GHz. The total (Stokes I) and the circularly polarized (Stokes V) flux density are variable. The radio data have been phase folded using the stellar rotation period, demonstrating that the radio variability is a consequence of the rotation. The rotational phases have been well sampled, allowing us to build multiwavelength radio light curves separately in Stokes I and V. Modeling of the stellar radio emission, using a 3D model that simulates the radio emission from a rigidly rotating stellar magnetosphere shaped by a simple dipole (Trigilio et al. 2004; Leto et al. 2006), allows us to constrain the physical conditions in the magnetosphere of HR 7355. As result of the present analysis, the wind mass-loss rate of HR 7355 has been indirectly derived. Independently, we obtained constrains on mass-loss rate from the analysis of archival UV spectra of HR 7355 by means of the non-LTE stellar atmosphere model PoWR. The radio and UV values of mass-loss rate are in good agreement, and are in accord with estimates of massloss rates derived from the UV spectra of other stars with similar spectral types. The average radio luminosity of HR 7355 is about 1018 erg s−1 Hz−1 , in the range 6–44 GHz, making it one of the brightest radio sources among the class of the MCP stars (mean radio luminosity ≈ 1016.8 [ergs s−1 Hz−1 ] Drake et al. 1987; Linsky, Drake & Bastian 1992). To investigate further, the magnetosphere of HR 7355 was compared with that of CU Vir, another magnetic star studied with the same modeling approach. The comparison reveals that both these stars are characterized by centrifugal magnetospheres but, the same time, have significant differences. The CM of HR 7355, as normalized to the stellar radius is larger, and the regions where the non-thermal electrons are generated are characterized by a stronger local magnetic field strength, with respect to the case of CU Vir, with a consequent effect on the radio brightness of the two stars. The analysis presented in this paper allows us to estimate the average physical conditions of the thermal plasma confined within the magnetospheric region. Absorption effects by the trapped plasma influences the emerging stellar radio emission and plays a key role for the modeling of the radio light curves. The measured thermal X-ray emission from HR 7355 could be explained as a consequence of the shock heating of the colliding wind streams arising from the two opposite stellar hemispheres. The fit to the X-ray spectrum of HR 7355 suggests a presence of a non-thermal X-ray component described by a power law. The spectral index of the non-thermal X-ray photons is compatible with the thick target bremsstrahlung emission generated by the non-thermal electron population, which are responsible for the observed radio emission, that impact with the stellar surface close to the polar caps. This could be the signature for auroral X-ray emission from HR 7355. Stellar rotation can lead to greater X-ray emissions than predicted by the scaling laws in the framework of the MCWS model (Bard & Townsend 2015). However, ud-Doula & Naz´e (2016) point out that even taking rotation into account, there are some hot magnetic stars that are too bright in the X-ray band, one of them being HR 7355. Our new model suggests that auroral X-ray emission is a likely additional mechanism that increases X-ray production and can account for the strong X-rays from HR 7355. We speculate that auroral mechanism operates in other hot magnetic stars that display hard and bright X-ray emission. The auroral phenomenon also gives rise to features at radio
14
P. Leto et al.
wavelengths, such as coherent pulses with ≈ 100% circular polarization that occur at predictable rotational phases. This radio lighthouse phenomena has been recognized in the magnetized planets of the solar system, among some ultra cool dwarfs, and in two hot magnetic stars, with the prototype CU Vir. For the stellar auroral radio emission to be detectable, the stellar magnetic dipole must to be oriented with the axis lying in the plane of the sky (null effective magnetic field). The stellar geometry of HR 7355 is favorable for detecting this coherent emission, in fact the magnetic field curve inverts the sign twice per period. We do not however find any signature of auroral radio emission from HR 7355, at least in the frequency range 6–44 GHz. For this frequency range, we suggest that the auroral radio emission originates deep inside the stellar magnetosphere and is strongly absorbed. New observations at lower frequencies, corresponding to less deep layers, could reveal whether auroral radio emissions are in fact produced the magnetosphere of HR 7355. We want to underscore that the synergistic radio and X-ray analysis is a powerful combination that can led to strong constraints for the stellar magnetospheric conditions of hot magnetic stars. From the results of the radio modeling simulations and the X-ray spectral analysis of HR 7355, we have been able to outline a physical scenario that simultaneously explains features detected at opposite ends of the source spectrum.
ACKNOWLEDGMENTS We thank the referee for their very useful remarks that helped to improve the paper. The National Radio Astronomy Observatory is a facility of the National Science Foundation operated under cooperative agreement by Associated Universities, Inc. This work has extensively used the NASA’s Astrophysics Data System, and the SIMBAD database, operated at CDS, Strasbourg, France. This publication used data products provided by the XMM-Newton Science Archive. LMO acknowledges support by the DLR grant 50 OR 1302.
REFERENCES Antonova A., Doyle J.G., Hallinan G., Bourke S., Golden A., 2008, A&A, 487, 317 Arnaud K.A., 1996, ASPC, 101, 17 Aschwanden, M.J., 2002, SSRv, 101, 1 Asplund M., Grevesse N., Sauval A.J., Scott P., 2009, ARA&A, 47, 481 Babcock H.W., 1949, Observatory, 69, 191 Babel J., Montmerle T., 1997, A&A, 323, 121 Bard C., Townsend R., 2015, IAUS, 307, 449 Benz A.O., Gu¨edel M., 1994, A&A, 285, 621 Berger E., 2002, ApJ, 572, 503 Berger E., Basri G., Fleming T.A., Giampapa M.S., Gizis J.E., Liebert J., Mart´ın E., Phan-Bao N., et al., 2010, ApJ, 709, 332 Bohlender D.A., Monin D., 2011, AJ, 141, 169 Branduardi-Raymont G., Bhardwaj A., Elsner R.F., Gladstone G.R., Ramsay G., et al., 2007, A&A, 463, 761 Branduardi-Raymont G., Elsner R.F., Galand M., Grodent D., Cravens T.E., et al., 2008, J. Geophys. Res., 113, A2202 Brown J.C., 1971, Sol. Phys, 18, 489 Burgasser A.J., Putman M.E., 2005, ApJ, 626, 486 Cassinelli J.P., Brown J.C., Maheswaran M., Miller N.A., Telfer D.C., 2002, ApJ, 578, 951 Chandra P., Wade G.A., Sundqvist J.O., et al., 2015, MNRAS, 452, 1245 Condon J.J, Cotton W.D., Greisen E.W., Yin Q.F., Perley R.A., Taylor G.B., Broderick J.J., 1998, AJ, 115, 1693
Drake S.A., Abbot D.C., Bastian T.S., Bieging J.H., Churchwell E., Dulk G., Linsky J.L, 1987, ApJ, 322, 902 Dulk G.A., 1985, ARA&A, 23, 169 Fossati L., Castro N., Sch¨oller M., N., Hubrig S., Langer N., Morel T., Briquet M., Herrero A., Przybilla N., Sana H.,Schneider F.R.N., de Koter A., and BOB Collaboration, 2015, A&A, 582, 45 Gr¨afener G., Koesterke L., Hamann W., 2002, A&A, 387, 244 Groote D., Hunger K., 1997, A&A, 319, 250 Grunhut J.H., Rivinius Th., Wade G.A., Townsend R.H.D., et al. 2012a, MNRAS, 419, 1610 Grunhut J.H., Wade G.A., and the MiMeS Collaboration, 2012b, ASPC, 465, 42 Gu¨edel M., Benz A.O., 1993, ApJ, 405, L63 Hallinan G., Antonova A., Doyle J.G., Bourke S., Lane C., Golden A., 2008, ApJ, 684, 644 Hamann W., Gr¨afener G., 2003, A&A, 410, 993 Hoffleit D., Jaschek C., 1991, The Bright Star Catalogue (New Haven, CT: Yale Univ. Observatory) Hubrig S., Sch¨oller M., Fossati L., Morel T., Castro N., Oskinova L.M., Przybilla N., Eikenberry S.S., Nieva M.-F, Langer N., and BOB collaboration, 2015, A&A, 578, L3 Hudson H., Ryan J., 1995, ARA&A, 33, 239 Ignace R., Cassinelli J.P., Bjorkman J.E., 1998, ApJ, 505, 910 Ignace R., Oskinova L.M., Massa D., 2013, MNRAS, 429, 516 Kao M.M., Hallinan G., Pineda J.S., Escala I., Burgasser A. Bourke S., Stevenson D., 2016, ApJ, 818, 24 Kochukhov O., L¨ulftinger T., Neiner C., Alecian E., and the MiMeS collaboration, 2014, A&A, 565, 83 Klein K.L., Trotter G., 1984, A&A, 141, 67 Krticka J., 2014, A&A, 564, 70 Leone F., 1991, A&A, 252, 198 Leone F., 1993, A&A, 273, 509 Leone F., Umana G., 1993, A&A, 268, 667 Leone F., Trigilio C., Umana G., 1994, A&A, 283, 908 Leone F., Trigilio C., Neri R., Umana G., 2004, A&A, 423, 10 Leone F., Bohlender D.A., Bolton C.T., Buemi G., Catanzaro G., Hill G.M., Stift M.J., 2010, MNRAS, 401, 2739 Leto P., Trigilio C., Buemi C.S., Umana G., Leone F., 2006, A&A, 458, 831 Leto P., Trigilio C., Buemi C.S., Leone F., Umana G., 2012, MNRAS, 423, 1766 Leto P., Trigilio C., Buemi C.S., Umana G., Ingallinera A., Cerrigone L., 2016, MNRAS, 459, 1159 Lynch C., Murphy T., Ravi V., Hobbs G., Lo K., Ward C., 2016, MNRAS, 457, 1224 Linsky J.L., Drake S.A., Bastian S.A., 1992, ApJ, 393, 341 Lo K.K., Bray J.D., Hobbs G., et al., 2012, MNRAS, 421, 3316 Louarn P., Le Queau D., 1996a, P&SS, 44, 199 Louarn P., Le Queau D., 1996b, P&SS, 44, 211 Maheswaran M., Cassinelli J.P., 2009, MNRAS, 394, 415 Melrose D.B., Dulk G.A., 1982, ApJ, 259, 844 Menietti J.D., Mutel R.L., Christopher I.W., Hutchinson K.A., Sigwarth J.B, 2011, J. Geophys. Res., 116, A12219 Mutel R.L., Christopher I.W., Pickett J.S., 2008, GeoRL, 35, L07104. Naz´e Y., Petit V., Rinbrand M., et al., 2014, ApJS, 215, 10 Nichols J.D., 2011, J. Geophys. Res., 116, A10232 Oksala M.E., Wade G.A., Marcolino W.L.F., et al., 2010, MNRAS, 405, L51 Oskinova L.M., Todt H., Ignace R., Brown C.J., Cassinelli J.P., Hamann W.-R., 2011, MNRAS, 416, 1456 Oskinova L.M., Naz´e Y., Todt H., Huenemoerder D.P., Ignace R., Hubrig S., Hamann W.-R., 2014, Nature Communications, 4024 Oksala M.E., Wade G.A., Townsend R.H.D., et al., 2012, MNRAS, 419, 959 Petit V., Owocki S.P., Wade G.A., et al., 2013, MNRAS, 429, 398 Poe C.H., Friend D.B., Cassinelli J.P., 1989, ApJ, 337, 888 Prinja K.P., 1989, MNRAS, 241, 721 Ramaty R., 1969, ApJ, 158, 75 MNRAS 000, 1–?? ()
The magnetosphere of HR 7355 Ravi V., Hobbs G., Wickramasinghe D., Champion D.J., Keith M., 2010, MNRAS, 408, L99 ˇ Rivinius Th., Stefl S., Townsend R.H.D., Baade D., 2008, A&A, 482, 255 ˇ Rivinius Th., Szeifert Th., Barrera L., Townsend R.H.D., Stefl S., Baade D., 2010, MNRAS, 405, L46 Rivinius Th., Townsend R.H.D., Kochukhov O., et al., 2013, MNRAS, 429, 177 Route M., Wolszczan A., 2012, ApJ, 747, L22 Route M., Wolszczan A., 2013, ApJ, 773, 18 Sander A., Shenar T., Hainich R., G´ımenez-Garc´ıa A., Todt H., Hamann W.-R., 2015, A&A, 577, A13 Sikora J., Wade G.A., Bohlender D.A., Neiner C.,4 Oksala M.E., et al, 2015, MNRAS, 451, 1928 Shenar T., Hamann W.-R., Todt H., 2014, A&A, 562, A118 Shore S.N., 1987, AJ, 94, 73 Shore S.N., Brown D.N., Sonneborn G., 1987, AJ, 94, 737 Shore S.N., Brown D.N., 1990, ApJ, 365, 665 Stibbs D.W.N., 1950, MNRAS, 110, 395 Stevens I.R., George S.J., 2010, ASPC, 422, 135 Str¨uder L., Briel U., Dennerl K., Hartmann R., Kendziorra E., Meidinger N., Pfeffermann E., Reppin C., Aschenbach B., Bornemann W., et al., 2001, A&A, 365, L18 Townsend R.H.D., Owocki S.P., 2005, MNRAS, 357, 251 Townsend R.H.D., Owocki S.P., Groote D., 2005, ApJ, 630, 81 Townsend R.H.D., Rivinius Th., Rowe J.F., Moffat A.F.J., Matthews J.M., 2013, ApJ, 769, 33 Trigilio C., Leto P., Leone F., Umana G., Buemi C., 2000, A&A, 362, 281 Trigilio C., Leto P., Umana G., Leone F., Buemi C.S., 2004, A&A, 418, 593 Trigilio C., Leto P., Umana G., Buemi C.S., Leone F., 2008, MNRAS, 384, 1437 Trigilio C., Leto P., Umana G., Buemi C.S., Leone F., 2011, ApJ, 739, L10 Turner M.J.L., Abbey A., Arnaud M., Balasini M., Barbera M., Belsole E., Bennie P.J., Bernard J.P., Bignami G.F., Boer M., et al., 2001, A&A, 365, 27 ud-Doula A, Owocki S., 2002, ApJ 576, 413 ud-Doula A., Townsend R., Owocky S., 2006, ApJ, 640, L191 ud-Doula A., Owocky S., Townsend R., 2008, MNRAS, 385, 97 ud-Doula A. Owocky S., Townsend R., Petit V., Cohen D., 2014, MNRAS, 441, 3600 ud-Doula A., 2015, IAUS, 307, 321 ud-Doula A., Naz´e Y., 2016, AdSpR, 58, 680 Usov V.V., Melrose D.B., 1992, ApJ, 395, 575 van Leeuwen F., 2007, A&A, 474, 653 Walborn, N.R., 1974, ApJ, 191, L95 Weber E.J., Davies L., 1967, ApJ, 148, 217 Williams P.K.G., Cook B.A., Berger E., 2014, ApJ, 785, 9 Williams P.K.G., Berger E., Irwin J., Berta-Thompson Z.K., Charbonneau D., 2015, ApJ, 799, 192 Wu C.S., Lee L.C. 1979, ApJ, 230, 621 Zarka P., 1998, J. Geophys. Res., 103, 20159
MNRAS 000, 1–?? ()
15