Hindawi Mathematical Problems in Engineering Volume 2019, Article ID 4191570, 12 pages https://doi.org/10.1155/2019/4191570
Research Article Discrete Element Method- (DEM-) Based Study on the Wear Mechanism and Wear Regularity in Scraper Conveyor Chutes Rui Xia, Xuewen Wang , Bo Li , Xing Wei, and Zhaojian Yang Shanxi Key Laboratory of Fully Mechanized Coal Mining Equipment, College of Mechanical and Vehicle Engineering, Taiyuan University of Technology, Taiyuan 030024, China Correspondence should be addressed to Zhaojian Yang;
[email protected] Received 25 October 2018; Accepted 25 December 2018; Published 3 January 2019 Academic Editor: Mohammed Nouari Copyright © 2019 Rui Xia et al. This is an open access article distributed under the Creative Commons Attribution License, which permits unrestricted use, distribution, and reproduction in any medium, provided the original work is properly cited. The scraper conveyor is the key conveying equipment for fully mechanized coal mining. Wear failure of the chute is the main form of failure of the scraper conveyor. In this study, the discrete element method (DEM) was combined with the wear model. The wear mechanism and wear regularity of the chute were explored by tracking the changes in the position of coal particles during the wear process. After the validation of wear simulation, a wear test of coal for different intrinsic parameters was designed. In one wear cycle, the three-body wear was about 32.84 times that of the two-body wear. In the research range, the wear of the scraper conveyor chute increased with the increase of Poisson’s ratio, shear modulus, and density of the coal. The shear modulus showed remarkable effect on the wear of the chute, followed by Poisson’s ratio and density. There existed a linear relationship between the shear modulus and wear (R2 = 0.8232). This study is expected to be used to predict the wear of the scraper conveyor chute and provide a theoretical basis for the applicability of the chute in different mines.
1. Introduction The scraper conveyor is the key equipment of mechanized coal mining in fully mechanized coal face [1, 2]. It is a continuous conveying machine with a flexible body used in longwall mining face [3–5]. The chute is the core component of the scraper conveyor, accounting for more than 70% of the total weight of the scraper conveyor. Its performance directly affects the reliability and service life of the scraper conveyor [6]. The failure mode of the scraper conveyor is mainly the wear of the chute. During coal conveying, the scraper and chain slide on a plate, with the coal and gangue acting as abrasives that interact intensively with the middle plate, causing serious wear on the plate [7, 8]. Abrasive wear refers to the wear caused by the interaction between hard particles and the surface of materials, resulting in deterioration of material quality. Abrasive wear is mainly manifested as microcutting, wedge forming, and ploughing on the surface of materials [9, 10]. It can be categorized into two-body and three-body wear types. In reality, three-body wear is more common than two-body wear and, theoretically, three-body wear is more serious than two-body wear [11–13].
With regard to the wear mechanism of abrasive wear, Bialobrzeska et al. studied the wear properties of low-alloy boron steel by a grinding wheel wear-testing machine. It was found that the wear of low-alloy boron steel mainly manifested as microcutting and microplough, and the peeling off of large particles caused wear marks on the wear surface [14]. Huang et al. uniformly distributed (Ti,Mo)C particles on the martensite matrix of the material and carried out a threebody wear test of the dry grinding wheel and rubber wheel under different loads. It showed that the particles could effectively resist microcutting, the main wear mechanism of the experimental steel was through formation of pits and other indications of surface fatigues [15]. Yousif et al. studied the relationship between the wear rate and mechanical properties under high stress conditions. As a result, CGRP composite exhibited better wear characteristic in P-O than in AP-O and N-O. Different wear mechanisms were observed on the worn surfaces of the materials, including pitting, macrocracks, and breakage and debonding of the fibres [12]. Through a dry grinding wheel and rubber wheel wear test, Nahvi et al. found that when wear occurred, the abrasive particle motion state was related to the shape, size, speed, and other factors [16].
2 Xu et al. studied the wear of different high-speed steels via an abrasive wear test. It was found that the abrasive particle size and load clearly influenced the wear of different highspeed steels, but the carbide type of the material determined the relative wear resistance of these steels [17]. All the studies mentioned above are very useful in analyzing the abrasive wear results especially the wear mechanism. The wear of the scraper conveyor chute cannot be studied directly via experiments because it is not allowed in the mine. Therefore, it is particularly important to carry out wear tests in the lab. In order to study the wear resistance of wear-resistant steel under typical mining and transportation conditions, Rend´on et al. designed the pin-disk test and paddle wear test for sliding wear and impact wear under laboratory conditions. The results showed that, depending on the abrasive conditions, a combination of high hardness and toughness (fracture strain) is important for achieving high wear resistance [18]. Woldman et al. studied the effects of abrasive grain size, shape, hardness, and feed rate on abrasive wear in the case of three-body wear [19]. After using the MLS-225 wet sand semifree abrasive wear-testing machine, Shi found that the wear increased with the increase in pressure and sliding speed and decreased with increase in the proportions of water, coal, and gangue [20]. Ge et al. studied the impact abrasive wear performance of shear wear-resistant steel by using MLD-10 impact wear-testing machine and found that the impact wear resistance of medium-manganese austenitic steel was higher than that of martensitic steel [21]. The DEM can be used to build a numerical model according to the characteristics of the discrete material. It yields good results when analyzing the contact mechanics of bulk materials and geometric bodies [22–25]. Combining the classical wear model with the DEM provides a new way to study the wear. Forsstr¨om et al. combined the DEM and finite element method with the Archard model to construct a model of the flow and wear behavior of the bulk material [26]. Jafari et al. applied the DEM to study the effects of grid slope, vibration frequency, and excitation direction on the wear of vibrating screens. It was found that the wear rate increased with increase in the vibration frequency and grid slope [27]. Chen et al. used DEM to apply the wear model to the study of single-particle sliding wear [28]. In summary, the extant experimental studies on wear mechanism are limited to the study of material wear morphology, macroscopic abrasive movement state, and the influence of different factors on wear. It is difficult to simulate the real underground working conditions through the general wear test. Tracking the position of typical coal particles and obtaining the force of coal and chute are impossible in real tests. Furthermore, research on the wear of the chute under the interaction of coal and the chute is lacking. This study focused on the wear of the scraper conveyor combining the experiment and the simulation. The objectives of this study were (1) to study the wear mechanism of the scraper conveyor chute; (2) to study the mechanical behavior and wear behavior between coal and the chute; and (3) to study the wear regularity of the scraper conveyor chute under different intrinsic parameters.
Mathematical Problems in Engineering Particle j #
C
Particle i
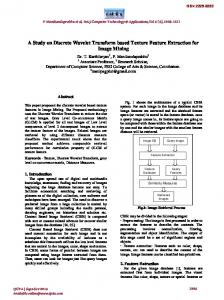
Figure 1: Soft sphere particle model.
2. Theory and Method 2.1. Discrete Element Particle Contact Model. The soft sphere model allows for overlapping parts at the contact point, and particle collisions can last for a certain time [29]. When the scraper conveyor transports bulk coal, the speed is not high, and multiple particles interact simultaneously. Hence, this soft sphere contact model has applicability. The soft sphere particle model is shown in Figure 1. Under the action of an external force or inertia, particle 𝑖 comes in contact with particle 𝑗 at point 𝐶. The dotted line indicates the initial position of particle 𝑖. As the relative motion proceeds, the surfaces of the particles gradually deform and produce the contact force. The soft sphere model does not consider details of the deformation; it only calculates the tangential displacement 𝛿 and normal overlap 𝛼 and then obtains the contact force. The soft sphere model sets up the coupler, spring, damper, and slider between the two particles. The coupler does not introduce any force and is only used to determine the pairing relationship of the particles in contact. Parameters such as elastic coefficient 𝑘 and damping coefficient 𝑐 are required for the soft sphere model to quantify the action of spring, damper, and slider. The interaction force between particles is an important part of the soft sphere contact theory; this force can be divided into normal and tangential forces (Figure 2). Normal force 𝐹𝑛𝑖𝑗 is the resultant force of elastic force and damping force on particle 𝑖. According to the Hertz contact theory, 𝐹𝑛𝑖𝑗 can be obtained as follows: 𝐹𝑛𝑖𝑗 = (−𝑘𝑛 𝛼3/2 − 𝑐𝑛 𝑣𝑖𝑗 ∙ 𝑛) 𝑛
(1)
Similarly, the tangential force 𝐹𝑡𝑖𝑗 is as follows: 𝐹𝑡𝑖𝑗 = −𝑘𝑡 𝛿 − 𝑐𝑡 𝑣𝑐𝑡
(2)
where n is the unit vector from the center of particle 𝑖 to the center of particle j; 𝛼 is the normal overlap; V𝑖𝑗 is the velocity vector of particle 𝑖 relative to particle j; 𝛿 is the tangential displacement of the contact point; 𝑘𝑛 , 𝑘𝑡 are the elastic coefficient; 𝑐𝑛 , 𝑐𝑡 are the damping coefficients; and V𝑐𝑡 is the sliding velocity of the contact point.
Mathematical Problems in Engineering
3
Spring
Sliding friction
Damping
Coupling (a) Normal force
(b) Tangential force
Figure 2: Simplified model for the contact force of particles.
If particle 𝑖 is in contact with multiple particles at the same time, the total force exerted by particle 𝑖 can be calculated by the following formula: 𝐹𝑖 = ∑ (𝐹𝑛𝑖𝑗 + 𝐹𝑡𝑖𝑗 ) 𝑗
(3)
The elastic and damping coefficients introduced in the soft sphere model are related to the elastic modulus and Poisson’s ratio of particles. Generally, they have to be calibrated in the experiments. The normal elastic coefficient 𝑘𝑛 is determined by the Hertz contact theory. −1
2 2 𝑅𝑖 + 𝑅𝑗 −1/2 4 1 − V𝑖 1 − V𝑗 𝑘𝑛 = ( + ) ( ) 3 𝐸𝑖 𝐸𝑗 𝑅𝑖 𝑅𝑗
(4)
where E is the elastic modulus of particle materials and V is Poisson’s ratio of particle materials. If the two spheres are made of the same material and have equal radii, then 𝑘𝑛 can be simplified as follows: 𝑘𝑛 =
√2𝑅𝐸 3 (1 − V2 )
(5)
The tangential elastic coefficient 𝑘𝑡 is determined by the following formula: −1
𝑘𝑡 = 8𝛼
1/2
2 𝑅𝑖 + 𝑅𝑗 −1/2 1 − V𝑖2 1 − V𝑗 + ( ) ( ) 𝐺𝑖 𝐺𝑗 𝑅𝑖 𝑅𝑗
(6)
where G is the shear modulus of particle materials. If the two spheres are made of the same material and have equal radii, then 𝑘𝑡 is simplified as follows: 𝑘𝑡 =
2√2𝑅𝐺 1/2 𝛼 (1 − V2 )
(7)
The normal damping coefficient 𝑐𝑛 and tangential damping coefficient 𝑐𝑡 are calculated as follows: 𝑐𝑛 = 2√𝑚𝑘𝑛
(8)
𝑐𝑡 = 2√𝑚𝑘𝑡
(9)
The elastic coefficients are related to the normal overlap and should be calculated in real time according to the contact process when determining their values; however, this involves an enormous amount of calculation. To simplify the calculation, in the soft sphere model, the details of deformation and loading history are usually ignored and the model is based on the assumption that the elastic and damping coefficients remain unchanged throughout the contact process. 2.2. Particle Contact Model. In this study, the contact model between coal particles was set up as a Hertz–Mindlin (no slip) model. This model is based on the research results obtained by Mindlin. It is accurate and efficient for calculating the contact and collision between particles. It is assumed that the two spherical particles with radii 𝑅1 and 𝑅2 make contact with each other elastically, and the normal force 𝐹𝑛 between the particles is obtained by the following formula. 4 1/2 𝐹𝑛 = 𝐸∗ (𝑅∗ ) 𝛼3/2 3
(10)
where 𝐸∗ is the equivalent elastic modulus, 𝑅∗ is the equivalent particle radius, and 𝛼 is the normal overlap. The normal damping force 𝐹𝑛𝑑 can be obtained from the following formula: 5 𝐹𝑛𝑑 = −2√ 𝛽√𝑆𝑛 𝑚∗ V𝑛𝑟𝑒𝑙 6
(11)
where 𝑚∗ is the equivalent mass, 𝑆𝑛 is normal stiffness, and V𝑛𝑟𝑒𝑙 is the normal component value of relative velocity. The tangential force 𝐹𝑡 between particles is calculated using the following formula: 𝐹𝑡 = −𝑆𝑡 𝛿
(12)
where 𝑆𝑡 is tangential stiffness and 𝛼 is tangent overlap. The tangential damping force 𝐹𝑡 between particles can be calculated from the following formula: 5 𝐹𝑡 = −2√ 𝛽√𝑆𝑡 𝑚∗ ]𝑟𝑒𝑙 𝑡 6 where V𝑡𝑟𝑒𝑙 is tangential relative velocity.
(13)
4
Mathematical Problems in Engineering v
v
Scraper
Scraper
Coal particle
Coal particle
Chute
Chute
(a) Furrow action
(b) Microcutting action
Figure 3: Wear form of the chute.
The tangential force is related to friction 𝜇𝑠 𝐹𝑛 , and 𝜇𝑠 is the coefficient of static friction. In addition, the rolling friction in the simulation cannot be ignored, and the rolling friction can be explained by the torque on the contact surface. 𝑇𝑖 = −𝜇𝑟 𝐹𝑛 𝑅𝑖 𝜔𝑖
(14)
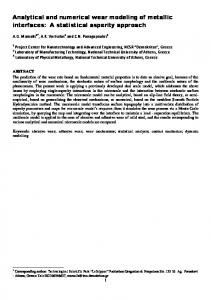
where 𝑅𝑖 is the distance from the center of mass to the contact point, 𝜇𝑟 is the rolling friction coefficient, and 𝜔𝑖 is the unit angular velocity vector of the object at the point of contact. 2.3. Wear Model. During coal conveying, the scraper and chain slip on the chute. During this process, coal and gangue act as abrasive particles and enter the spaces between the scraper, chain, and the chute, producing furrow and microcutting actions on the chute and causing wear failure of the scraper conveyor chute. The furrow action on the surface of the chute is shown in Figure 3(a). During coal conveying, the hard particles under the action of the force are subjected to repeated extrusion of the scraper and chain. Plastic deformation and small cracks are produced in the chute. The fatigue loss would occur when the chute with small cracks suffers from further extrusions. The microcutting effect on the surface of the chute is shown in Figure 3(b). When the impact angle and hardness are appropriate, the hard particles will produce a microcutting action on the surface of the chute. This will cause the material to peel off the surface of the chute directly. The Hertz–Mindlin model with the Archard wear model was used in this study. According to the Archard model, the wear volume of the geometry is given as 𝑉=𝐾
𝑁𝐿 𝐻
(15)
where V is the wear volume of the plane, N is the normal load, K is the wear coefficient, L is the sliding distance, and H is the hardness of the material being grinded. 𝑊=
𝐾 𝐻
(16)
where W is the wear constant. In EDEM (a discrete element method software for bulk material simulation), the parameter related to wear is the
wear constant 𝑊. Hence, the wear volume of geometry is expressed as follows: 𝑉 = 𝑊𝑁𝐿
(17)
In the Archard model, it is very difficult to determine the wear coefficient 𝐾. This constant can be regarded as the sum of all wear factors, including hardness H, except normal load 𝑁, and sliding distance 𝐿. The hardness plays a major role in determining the wear coefficient. In the EDEM, the wear depth is used to characterize wear volume. ℎ=
𝑉 𝐴
(18)
where 𝐴 is the removed area of material. 2.4. Construction of the Experimental Model 2.4.1. Three-Dimensional Geometric Model of the Abrasive Wear-Testing Machine. When the scraper conveyor transports coal, the scraper, scraper chain, and middle plate are all in contact with coal. Bulk coal acts as an abrasive medium and leads to the abrasive wear of the scraper-coal-middle plate. The improved ML-100 abrasive wear-testing machine was designed for this wear mechanism (Figure 4(a)). It could simulate the wear mechanism of the scraper conveyor chute to the greatest extent. The working principle of the weartesting machine was that the scraper sample was fixed at a certain position from the center of rotation of the bulk coal trough, and this position was determined according to the installation position of the middle plate sample. Coal of certain quality and particle size was added to the trough, so that both the scraper and middle plate sample were in the coal environment. When the test starts, the middle plate sample rotated counterclockwise with the trough, leading to abrasive wear at the wedge. The improved wear-testing machine is shown in Figure 4. The geometric model of the middle plate sample is shown in Figure 5(a). The middle plate sample was composed of six identical sectoral samples and was fixed on the bottom plate by screws. The final form was a circular ring sample with an outer diameter of 260 mm and an inner diameter of 180 mm. The outer diameter of the groove was 375 mm, while the inner diameter was 315 mm, and the groove depth was 37 mm. The geometric model of the scraper sample is shown
Mathematical Problems in Engineering
5 Table 1: Key sizes.
Symbol l1 l2 l3 h1 h2
Meaning The length of Scraper sample The width of scraper sample The length of wedge The height of wedge The height of scraper sample
Sizes (mm) 20 20 15 30 11
Scraper sample champ
Middle plate sample
Scraper sample
Bottom plate
Upper cover
Trough
Bottom plate clamp (a) The real machine
(b) The simplified model
Figure 4: Improved ML-100 abrasive wear-testing machine.
in Figure 5(b). The key sizes of the scraper sample are listed in Table 1. In this study, the discrete element software (EDEM 2.7) was used to simulate the wear of the wear-testing machine. Generally, the 3D geometric model is imported into EDEM in the .stp or .igs formats. The EDEM automatically meshes the geometric model, but the mesh quality is relatively rough. The quality of the mesh had little effect on the motion state of particles, but it played a remarkable role in determining the wear location and accurately obtaining the wear depth. The EDEM could only recognize triangular meshes. Each sectoral sample in the middle plate samples was refined by using GAMBIT 2.4.6 software, and the mesh spacing was set to 0.5. The middle plate sample model was imported into the EDEM in .mah format. Each sectoral plate sample had 11,916 meshes. 2.4.2. Particle Model. In reality, coal particles are irregular with greatly varying shapes. The EDEM can simulate the typical coal particle shapes by accumulating several small balls. The closer the particle model is to the real particles, the more accurate the results will be obtained. However, too many balls will considerably reduce the calculation efficiency. Before the wear simulation test, several types of particle shapes were screened by a simple stacking angle test. Finally, the 10-ball particle model with a stacking angle error of 0.4% was selected as the particle model (Figure 6(a)). The typical coal particle is shown in Figure 6(b). Coal particles with a particle size of 5 mm were used for wear simulation in this study. All coal particles were randomly generated in the range of 4–6 mm.
2.4.3. Contact Parameters. In the wear simulation, the Hertz–Mindlin (no slip) contact model was used for the particles, and the Hertz–Mindlin model with Archard wear contact model was selected to reproduce the interaction between particles and geometry. The intrinsic parameters referred to the EDEM material property database and set as listed in Table 2. The contact parameters were set as listed in Table 3. As the wear regularity of the scraper conveyor chute was studied in this study, only the relative wear volume was required. The wear constant between the friction pair of the coal and the NM360 wear-resistant steel was 0.8 × 10⁻¹² m2 /N [26, 31]. The simulation time step was set to 25% of the Rayleigh time step, and the storage time interval of simulation data was 0.05 s. 2.5. Study on Wear Mechanism and Wear Regularity by Using the DEM. The wear was simulated for a certain particle size (5 mm) of coal with different physical characteristics. The total mass of coal in the trough was 1 kg, and the center of the scraper sample was 110 mm away from the trough center. The simulation time was 5 s. The first 3 s were the time taken for particle formation and blanking, and the later 2 s were the time taken for trough rotation wear. Under this condition, the linear velocity of the center of the scraper sample was 0.7 m/s, and the groove rotated two cycles counterclockwise uniformly. 2.5.1. Analysis of Particle Motion and Force. As the wear machine rotated counterclockwise in the trough, the coal was inevitably centrifuged in the trough. In the simulation process
6
Mathematical Problems in Engineering Table 2: Intrinsic parameters. Density (kg/m3 ) 1500 7800
Intrinsic parameters Coal NM360 wear-resistant steel
Poisson’s ratio 0.3 0.3
shear modulus (Pa) 2 × 10⁸ 8 × 10¹⁰
Table 3: Contact parameters [30]. Contact parameters Coal - Coal Coal- NM360 wear-resistant steel
Coefficient of restitution 0.5 0.5
Coefficient of static friction 0.6 0.4
Coefficient of rolling friction 0.05 0.05
l2
ZC
Sector5
XC
Sector2
h2
Sector1
Sector6
h1
YC
Wedge Sector4
l3
Sector3
l1 Middle plate sample (a) Middle plate sample
(b) Scraper sample
Figure 5: Model of the scraper sample.
(a) Coal particle model
(b) Typical coal particle
Figure 6: Coal particle model and the typical coal particle.
of the wear machine, the scraper sample was fixed at a certain position. Particles at the wedge of the scraper directly caused the wear of the middle plate sample, but the locations and positions of the particles in the wedge changed constantly because of interaction with other particles or geometry.
2.5.2. Analysis of the Geometry Force. The middle plate samples were annular samples made up of six identical sectoral samples (Figure 5(a)). Positional relationship between middle plate sample and scraper sample is shown in Figure 7. Hence, the force of a single sectoral sample varied periodically. When
Mathematical Problems in Engineering
7 Table 4: Wear test design.
Physical properties Poisson’s ratio Shear modulus (×108 Pa) Density (kg/m3 )
0.26 1 1100
0.28 2 1200
0.30 3 1300
0.38 7 1700
0.40 8 1800
0.42 9 1900
Time: 5 s Volocity (m/s) 1.10
Scraper sample Sector6
Numerical change level 0.32 0.34 0.36 4 5 6 1400 1500 1600
Sector1
0.94 ZC
Sector5
0.79 Sector2
XC
0.63 YC
0.47 Sector4
Sector3 Middle plate sample (including sector 1, 2, 3, 4, 5, 6)
Figure 7: Positional relationship between middle plate sample and scraper sample.
0.31 0.16 0
Figure 8: Velocity vector plot of bulk coal.
the scraper sample was not above the sectoral sample, the sectoral sample was only subjected to the force of the free bulk coal above itself, and the force on the sectoral sample was small. However, when the scraper sample was above the sectoral sample, the sectoral sample was subjected to not only the force of free bulk coal, but also the force on the inclined wedge under the action of the scraper sample. The force transmitted by the particles was relatively large (threebody wear). 2.5.3. Analysis of the Middle Plate Wear. In this study, the wear caused by particle formation and blanking was not considered. The wear constant of the first 3 s was set to 0 and that after 3 s was determined according to the test design. Two forms of middle plate wear, namely, two-body wear and three-body wear, were observed. Theoretically, three-body wear represents greater force than two-body wear, and, hence, three-body wear is more serious than two-body wear. 2.5.4. Design of the Chute Wear Test for Different Parameters. The physical properties of coal include the Poisson’s ratio, shear modulus, and density which vary greatly among different types of coal. Poisson’s ratio of coal reflects the transverse deformation coefficient of coal under unidirectional tension or compression, and it is generally in the range of 0.26–0.42. The shear modulus of coal indicates the ability of coal to resist shear strain, and it is generally in the range of 1 × 10⁸ – 9 × 10⁸ Pa. The density of coal is determined by the type of coal, and it is generally in the range of 1100–1900 kg/m3 . In this study, Poisson’s ratio, shear modulus, and density of coal were simulated at nine levels to determine the wear regularity of the chute for various physical properties (Table 4).
3. Results and Analysis 3.1. Particle Motion State and Force 3.1.1. Motion State of Particles. The velocity vector plot of coal is shown in Figure 8. During wear simulation, the scraper sample was stationary, and the middle plate sample rotated counterclockwise. The linear velocity of the scraper sample was 0.7 m/s, and the coal was centrifuged in the trough. The velocity of the bulk coal at the edge of the trough was about 1.1 m/s. The velocity of the bulk coal decreased when it touched the scraper sample, and it moved toward the two sides of the scraper sample. In this state, the scraper sample and the middle plate sample were basically in the relative motion at a speed of 0.7 m/s, and coal particles were constantly entering the wedge of the scraper sample. Particles around the wedge of the scraper sample were tracked. The locations and positions of particles at different times are shown in Figure 9. The position of Particle 1 changed remarkably at 3.8 s compared to 3.75 s. 3.1.2. Force of the Particles. The force chain could be used to show the transfer of force between particles (Figure 10(a)). A larger force chain represents greater force. The local enlargement plot is shown in Figure 10(b). Most of the force chains far from the wedge of the scraper sample were blue, indicating that the force on the coal particles was small. The chain near the wedge tended to be red and was also thicker, indicating that the force between the particles was the greatest under the wedge.
8
Mathematical Problems in Engineering Time: 3.80 s Time: 3.75 s Particle1
Archard Wear (mm)
Archard Wear (mm) 0
1.14e-8 2.29e-8 3.43e-8 4.57e-8 5.71e-8 6.86e-8 8.00e-8
(a) Locations and positions of particles at 3.75 s
0
Wear disappear
1.14e-8 2.29e-8 3.43e-8 4.57e-8 5.71e-8 6.86e-8 8.00e-8 (b) Locations and positions of particles at 3.80 s
Figure 9: Locations and positions of particles at different times.
Time: 5 s Normal Force (N) 5.00e-2 4.29e-2 3.57e-2 2.86e-2 2.14e-2 1.43e-2 7.14e-3 0 (a) Overall distribution of the force chain
(b) Local enlargement of the force chain
Figure 10: Force chain distributions.
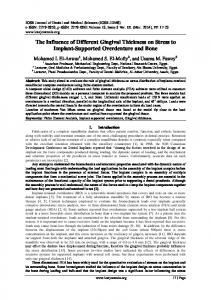
3.2. Force of Geometry 3.2.1. Force of Sector Sample. The force of one sectoral sample was analyzed (Figure 11). The trough led to counterclockwise rotation by two cycles in 3–5 s. At 3.45 s and the force of the sectoral sample suddenly increased to 140 N (from 3.45 to 3.65 s) when the scraper samples moved onto the top of the sectoral sample. The average wear depth increased continuously during this period. When the scraper sample left the sector sample at 3.65 s, the force on the sector sample suddenly tended to 0 and the average wear depth almost did not increase. A similar situation was observed during the period 4.45–4.65 s. When the scraper sample was located above the sectoral sample, three-body wear occurred, and the wear was serious. When the scraper sample was not above the sectoral sample, two-body wear occurred, causing lesser wear. As shown in Figure 12, the wear mainly occurred in the periods of 3.46–3.65 s and 4.45–4.65 s with a wear depth of 3.317 × 10⁻⁸ mm. In other periods, the wear depth was 0.101
× 10−8 mm. In one wear cycle, the three-body wear was 32.84 times of the two-body wear. 3.2.2. Force of the Scraper Sample. The force of the scraper sample is shown in Figure 13. The force of the scraper sample acted on the ring middle plate sample, without gaps, and it was not periodic, but fluctuating. The change in the position of the particles under the wedge directly affected the occurrence of three-body wear, and the force of geometry changed greatly. 3.3. Validation of the Wear. In an actual wear test, the middle plate material was made of NM360 wear-resistant steel. Several hours of wear test were needed to weigh the sample accurately. However, the calculation efficiency was limited in the EDEM; hence, it was not suitable to compare the simulated wear with the real one at the same order of magnitude. By observing the actual wear position and wear
Mathematical Problems in Engineering
9
200
240
180
210
140
The normal force (N)
The normal force (N)
160 120 100 80 60 40
180 150 120 90 60
20 0
30 3
3.2
3.4
3.6
3.8
4 4.2 Time (s)
4.4
4.6
4.8
5
0 3
Figure 11: Force of the sectoral sample.
3.2
3.4
3.6
3.8
4 4.2 Time (s)
4.4
4.6
4.8
5
Figure 13: Force of the scraper sample. 4.0 The average wear depth (×10−8 mm)
3.414
3.418
3.5
position was appropriate. For the whole middle plate, threebody wear occurred intermittently on the surface, resulting in an uneven force on the scraper sample.
3.0 2.5 1.688
1.623
2.0 1.5 1.0 0.032
0.5 0.0
3
3.2
3.4
3.6
3.8
4 4.2 Time (s)
4.4
4.6
4.8
5
Figure 12: Average wear depth of sector sample.
characteristics of the middle plate sample (Figure 14(b)) and comparing them with the simulation results (Figure 14(a)), the wear areas of the two samples were found to be identical, and the wear dimension was similar to the width of the scraper sample under the scraper sample. The middle plate sample exhibited clearly inhomogeneous wear, indicating that the wear depth and wear width varied with the sample positions (Figure 15(a)). Thus, the three-body wear occurred under certain conditions. As shown in Figure 15(b), after several hours of actual wear test, it was difficult to find intermittent wear, but the wear depth and wear width were different at different locations. The simulation results were consistent with the actual wear location and wear characteristics. Severe wear occurred in the sliding area below the wedge when Particle 1 moved below the wedge (Figure 9(a)). As shown in Figure 9(b), when the position of Particle 1 changed, it was no longer subjected to the wedge force and was not able to produce severe wear (only two-body wear occurred). Therefore, the three-body wear occurred when the scraper sample and the middle plate sample exhibited relative motion. Meanwhile, the particle was subjected to the wedge, and the
3.4. Study on Wear Regularity of the Chute under Different Parameters. The three-body wear occurred in certain conditions. Theoretically, the wear of middle plate sample was not completely uniform. In order to reduce the influence caused by the randomness of abrasive wear, the average wear depth of six samples at a time was calculated as the average wear depth for that duration. Taking the data at 5 s (wear constant = 0.8 × 10⁻¹² m2 /N) as an example (Figure 16), the average wear depth of six sectoral samples was found to be different because of the randomness of three-body wear. 3.4.1. Effect of Poisson Ratios on the Wear of the Chute. The average wear depth for different Poisson’s ratios is shown in Figure 17. Most of the scatter points and trend lines were similar, and the wear increased as Poisson’s ratio increased. This can be attributed to the increase in the normal overlap of coal particles in contact with coal particles and particles based on the soft ball model. The normal contact force increased when the particles came into contact with the middle plate sample, resulting in more serious wear. Some scattered points deviated far from the trend line, and these were attributed to the more serious three-body wear in the simulation. According to Section 3.3, the formation of the three-body wear was random, the probability of the occurrence of threebody wear caused the wear condition fluctuating significantly (when Poisson’s ratio = 0.38). 3.4.2. Effect of Shear Modulus on the Wear of the Chute. The shear modulus showed a linear relationship with the wear (R2 = 0.8232) (Figure 18). This relationship was due to the fact that an increase in the shear modulus would increase the normal overlap of coal particles in contact with coal particles and geometry. As a result, the normal contact force of the middle plate sample would increase.
10
Mathematical Problems in Engineering Time: 5 s Archard Wear (mm) 8.00e-8 6.86e-8 5.71e-8 4.57e-8 3.43e-8 2.29e-8 1.14e-8 0 (a) Simulated wear depth distribution
(b) Actual wear area
Figure 14: Wear areas.
Time: 5 s Archard Wear (mm) 8.00e-8 6.86e-8 5.71e-8 4.57e-8 3.43e-8 2.29e-8 1.14e-8 0 (b) Actual wear
(a) Simulated wear
Figure 15: Local enlargement of the wear.
3.4.3. Effect of Density on the Wear of the Chute. The shape and size of single coal particles remained constant when studying the effect of density on wear, but the mass of the particles increased with the density. The change of density led to obvious fluctuation of wear change, and higher density led to greater wear when the fluctuation factor was eliminated (Figure 19). At the same speed, greater mass of coal particles led to greater kinetic energy. In the process of three-body wear formed by an inclined wedge, a greater impact load was generated, resulting in more serious wear on the middle plate sample. Because the total mass of particles in the trough was certain, the density of particles affected not only the quality of single particles, but also the number of generated particles. There were more particles when the particle mass is small. Thus, the possibility of three-body wear was higher, resulting in serious wear (when density = 1400kg/m3 ). There were fewer particles as the particle mass large. Thus, the possibility
of three-body wear was lower, resulting in less wear (when density=1800kg/m3 ). Within the range of Poisson’s ratio, shear modulus, and density, the simulation data that deviated from the fitting curve were eliminated. The differences between the maximum wear depth and minimum wear depth were 1.725 × 10⁻⁸ mm, 7.218 × 10⁻⁸ mm, and 1.158 × 10⁻⁸ mm. The shear modulus had the greatest effect on the wear of the chute. Poisson’s ratio had less influence and the density ratio had the least influence on the wear of the chute.
4. Conclusions (1) The abrasive wear, comprising both two-body wear and three-body wear, was studied in this study. The normal force in the three-body wear state was much larger than the twobody wear, in one wear cycle, the amount of three-body wear
Mathematical Problems in Engineering
11 6.0
2.998
3
2.794
2.5
2.255
2.668
2.623
2.440
The average wear depth (×− mm)
The average wear depth (×− mm)
3.5
2.63
2 1.5 1 0.5 0
sector1 sector2 sector3 sector4 sector5 sector6 average
5.0 4.0 3.0 2.0 1.0 0.0 1100 1200 1300 1400 1500 1600 1700 1800 1900 Density (kg/m )
Figure 16: Average wear depth of sectoral samples.
Figure 19: Average wear depth for different densities. The average wear depth (×10−8 mm)
8 7 y = 14.639x − 2.5271
6 5 4 3 2 1
0 0.24 0.26 0.28 0.3 0.32 0.34 0.36 0.38 0.4 0.42 0.44 Poisson’s ratio
on the chute under the action of the scraper. Therefore, the wear of the chute was discontinuous and random. (3) The wear increased with the increase of Poisson’s ratio, shear modulus, and density. The shear modulus showed remarkable effects (wear depth = 7.218 × 10⁻⁸ mm), and Poisson’s ratio had little effect (wear depth = 1.725 × 10⁻⁸ mm). Density affected wear by affecting particle quality and load; density had the least effect (wear depth = 1.158 × 10⁻⁸ mm) on the wear. The shear modulus exhibited a linear relationship with the wear (R2 = 0.8232).
Data Availability
Figure 17: Average wear depth for different Poisson’s ratios.
The data used to support the findings of this study are available from the corresponding author upon request.
The average wear depth (×10−8 mm)
12.0 10.5
y = 0.9201x + 0.5152
Conflicts of Interest
22 = 0.8232
9.0
The authors declare no potential conflicts of interest.
7.5
Authors’ Contributions
6.0
All the authors listed contributed equally to the work presented in this paper.
4.5 3.0
Acknowledgments
1.5 0.0
0
1
2
3 4 5 6 7 Shear modulu (×108 Pa)
8
9
10
Figure 18: Average wear depth for different values of the shear modulus.
was about 32.84 times of the two-body wear, so the severity of three-body wear was much greater than two-body wear. (2) The three-body wear in the scraper conveyor chute occurred under certain conditions: the coal particles were in a certain position between the scraper and the chute, sliding
This study was supported by the National Natural Science Foundation of China (Grant nos. 51875386 and 51804207); the Merit Funding for the Returned Overseas Personnel SciTech Activities, Shanxi Province, China (Grant no. 2016); and Research Project supported by Shanxi Scholarship Council of China (no. 2016-43).
References [1] J. Xie, Z. Yang, X. Wang, S. Wang, and Q. Zhang, “A Joint Positioning and Attitude Solving Method for Shearer and Scraper Conveyor under Complex Conditions,” Mathematical
12
[2]
[3]
[4]
[5]
[6]
[7]
[8]
[9] [10]
[11] [12]
[13]
[14]
[15]
[16]
[17]
[18]
Mathematical Problems in Engineering Problems in Engineering, vol. 2017, Article ID 3793412, 14 pages, 2017. S. Hao, S. Wang, R. Malekian, B. Zhang, W. Liu, and Z. Li, “A geometry surveying model and instrument of a scraper conveyor in unmanned longwall mining faces,” IEEE Access, vol. 5, pp. 4095–4103, 2017. P. Przystalka and A. Katunin, “A concept of automatic tuning of longwall scraper conveyor model,” in Proceedings of the 2016 Federated Conference on Computer Science and Information Systems, FedCSIS 2016, pp. 601–604, Gdansk, Poland, September 2016. A. A. Ordin and A. A. Metel’kov, “Analysis of longwall face output in screw-type cutter–loader-and-scraper conveyor system in underground mining of flat-lying coal beds,” Journal of Mining Science, vol. 51, no. 6, pp. 1173–1179, 2015. S. Chen, D. Yin, X. Liu, H. Wang, F. Cao, and Z. Pu, “Collaborative mining using different equipment for a coal seam varying in thickness in a long wall working face,” International Journal of Oil, Gas and Coal Technology, vol. 13, no. 1, pp. 73–86, 2016. S. B. Jiang, Q. L. Zeng, G. Wang, K. D. Gao, Q. Y. Wang, and K. Hidenori, “Contact analysis of chain drive in scraper conveyor based on dynamic meshing properties,” International Journal of Simulation Modelling, vol. 17, no. 1, pp. 81–91, 2018. S. Wang and Z. Yang, “Improve design and analysis on transitional chute of scraper conveyor,” Advanced Materials Research, vol. 145, pp. 541–545, 2011. H. Chen and R. Wang, “Study on Wear of Scraper Conveyor Chute,” in Proceedings of the 2015 International Conference on Intelligent Systems Research and Mechatronics Engineering, Zhengzhou, China, April 2015. M. A. Moore, “Abrasive wear,” International Journal of Materials in Engineering Applications, vol. 1, no. 2, pp. 97–111, 1978. G. R. Piazzetta, L. E. Lagoeiro, I. F. Figueira, M. A. Rabelo, and G. Pintaude, “Identification of abrasion regimes based on mechanisms of wear on the steel stylus used in the Cerchar abrasiveness test,” Wear, vol. 410-411, pp. 181–189, 2018. J. D. Gates, “Two-body and three-body abrasion: A critical discussion,” Wear, vol. 214, no. 1, pp. 139–146, 1998. B. F. Yousif and N. S. M. El-Tayeb, “Wear characteristics of thermoset composite under high stress three-body abrasive,” Tribology International, vol. 43, no. 12, pp. 2365–2371, 2010. I. Loresch and O. Riemer, “Modelling of grain motion for threebody abrasion,” in Proceedings of the 15th CIRP Conference on Modelling of Machining Operations, CMMO 2015, pp. 282–286, Germany, June 2015. B. Bialobrzeska and P. Kostencki, “Abrasive wear characteristics of selected low-alloy boron steels as measured in both field experiments and laboratory tests,” Wear, vol. 328-329, pp. 149– 159, 2015. L. Huang, X. Deng, Y. Jia, C. Li, and Z. Wang, “Effects of using (Ti,Mo)C particles to reduce the three-body abrasive wear of a low alloy steel,” Wear, vol. 410-411, pp. 119–126, 2018. S. M. Nahvi, P. H. Shipway, and D. G. McCartney, “Particle motion and modes of wear in the dry sand-rubber wheel abrasion test,” Wear, vol. 267, no. 11, pp. 2083–2091, 2009. L. Xu, S. Wei, F. Xiao, H. Zhou, G. Zhang, and J. Li, “Effects of carbides on abrasive wear properties and failure behaviours of high speed steels with different alloy element content,” Wear, vol. 376-377, pp. 968–974, 2017. J. Rend´on and M. Olsson, “Abrasive wear resistance of some commercial abrasion resistant steels evaluated by laboratory test methods,” Wear, vol. 267, no. 11, pp. 2055–2061, 2009.
[19] M. Woldman, E. van der Heide, D. J. Schipper, T. Tinga, and M. A. Masen, “Investigating the influence of sand particle properties on abrasive wear behaviour,” Wear, vol. 294-295, pp. 419–426, 2012. [20] Z. Shi and Z. Zhu, “Case study: Wear analysis of the middle plate of a heavy-load scraper conveyor chute under a range of operating conditions,” Wear, vol. 380-381, pp. 36–41, 2017. [21] S. Ge, Q. Wang, and J. Wang, “The impact wear-resistance enhancement mechanism of medium manganese steel and its applications in mining machines,” Wear, vol. 376-377, pp. 1097– 1104, 2017. [22] L. Wang, R. Li, B. Wu, Z. Wu, and Z. Ding, “Determination of the coefficient of rolling friction of an irregularly shaped maize particle group using physical experiment and simulations,” Particuology, vol. 38, pp. 185–195, 2018. [23] H. Zhou, Z. Hu, J. Chen, X. Lv, and N. Xie, “Calibration of DEM models for irregular particles based on experimental design method and bulk experiments,” Powder Technology, vol. 332, pp. 210–223, 2018. [24] X. Wang, B. Li, and Z. Yang, “Analysis of the bulk coal transport state of a scraper conveyor using the discrete element method,” Strojniski Vestnik: Journal of Mechanical Engineering, vol. 64, no. 1, pp. 37–46, 2018. [25] J. Qiao, C. Duan, H. Jiang et al., “Research on screening mechanism and parameters optimization of equal thickness screen with variable amplitude based on DEM simulation,” Powder Technology, vol. 331, pp. 296–309, 2018. [26] D. Forsstr¨om and P. Jons´en, “Calibration and validation of a large scale abrasive wear model by coupling DEM-FEM: Local failure prediction from abrasive wear of tipper bodies during unloading of granular material,” Engineering Failure Analysis, vol. 66, pp. 274–283, 2016. [27] A. Jafari and V. Saljooghi Nezhad, “Employing DEM to study the impact of different parameters on the screening efficiency and mesh wear,” Powder Technology, vol. 297, pp. 126–143, 2016. [28] G. Chen, D. L. Schott, and G. Lodewijks, “Sensitivity analysis of DEM prediction for sliding wear by single iron ore particle,” Engineering Computations (Swansea, Wales), vol. 34, no. 6, pp. 2031–2053, 2017. [29] R. Jankowski, “Non-linear viscoelastic modelling of earthquakeinduced structural pounding,” Earthquake Engineering & Structural Dynamics, vol. 34, no. 6, pp. 595–611, 2005. [30] L. Mei, J. Hu, J. Yang, and J. Yuan, “Research on parameters of EDEM simulations based on the angle of repose experiment,” in Proceedings of the 2016 IEEE 20th International Conference on Computer Supported Cooperative Work in Design (CSCWD), pp. 570–574, Nanchang, China, May 2016. [31] Y.-Q. Zhang, X.-H. Li, J.-J. Ren, and B. Tan, “Wear analysis on bucket tooth of WK-75 mining excavator,” Chinese Journal of Engineering Design, vol. 22, no. 5, pp. 493–498, 2015.
Advances in
Operations Research Hindawi www.hindawi.com
Volume 2018
Advances in
Decision Sciences Hindawi www.hindawi.com
Volume 2018
Journal of
Applied Mathematics Hindawi www.hindawi.com
Volume 2018
The Scientific World Journal Hindawi Publishing Corporation http://www.hindawi.com www.hindawi.com
Volume 2018 2013
Journal of
Probability and Statistics Hindawi www.hindawi.com
Volume 2018
International Journal of Mathematics and Mathematical Sciences
Journal of
Optimization Hindawi www.hindawi.com
Hindawi www.hindawi.com
Volume 2018
Volume 2018
Submit your manuscripts at www.hindawi.com International Journal of
Engineering Mathematics Hindawi www.hindawi.com
International Journal of
Analysis
Journal of
Complex Analysis Hindawi www.hindawi.com
Volume 2018
International Journal of
Stochastic Analysis Hindawi www.hindawi.com
Hindawi www.hindawi.com
Volume 2018
Volume 2018
Advances in
Numerical Analysis Hindawi www.hindawi.com
Volume 2018
Journal of
Hindawi www.hindawi.com
Volume 2018
Journal of
Mathematics Hindawi www.hindawi.com
Mathematical Problems in Engineering
Function Spaces Volume 2018
Hindawi www.hindawi.com
Volume 2018
International Journal of
Differential Equations Hindawi www.hindawi.com
Volume 2018
Abstract and Applied Analysis Hindawi www.hindawi.com
Volume 2018
Discrete Dynamics in Nature and Society Hindawi www.hindawi.com
Volume 2018
Advances in
Mathematical Physics Volume 2018
Hindawi www.hindawi.com
Volume 2018