Sep 12, 2011 - 2008; Takahashi and Tsukaguchi 2003; Wagner et al. ... Table 1 shows the list of previous works on emotion recognition using ..... (0 Hz â 8 Hz) gives an useful information for some special applications such as sleep stage.
3 Discrete Wavelet Transform Based Selection of Salient EEG Frequency Band for Assessing Human Emotions M. Murugappan, R. Nagarajan and S. Yaacob Intelligent Signal Processing (ISP) Research Cluster, Universiti Malaysia Perlis (UniMAP) Seriab, Kangar, Perlis Malaysia 1. Introduction In recent years, assessment of human emotions from Electroencephalogram (EEG) has one of the active research areas in developing intellectual man-machine interfaces. In this work, we considered two different frequency ranges of EEG signals such as alpha to gamma (8 Hz – 64 Hz) and delta to gamma (0 Hz – 64 Hz) for classifying five emotions (disgust, happy, surprise, fear, and neutral). EEG signals are collected using 64 channels from 20 subjects in the age group of 21~39 years. The raw EEG signals are preprocessed using Surface Laplacian filtering and a set of conventional and proposed statistical features are derived using Discrete Wavelet Transform (DWT). Two linear classifiers (K Nearest Neighbor (KNN) and Linear Discriminant Analysis (LDA)) are used to map the statistical features into corresponding emotions. One of the proposed features derived by using “db8” wavelet function under alpha to gamma band gives the maximum average classification rate of 86.55% using KNN and 82.70% using LDA compared to delta to gamma band. In addition, the proposed features gives higher classification rate compared to conventional features. Finally we present the average classification accuracy and subsets of discrete emotion classification rates for justifying the performance of our emotion recognition system. The nonverbal communication through emotions, intentions and affective states are the current key areas of research on developing intellectual man-machine systems. Manifestations of emotional states are normally straightforward to detect and understand by humans, as these are reflected in both voice and body languages (Adler and Rodman 2003; Pease and Pease 2004). In recent years, the research efforts in Human Computer Interaction (HCI) are focused on empowering computers to understand human emotions. Most of the efforts have been dedicated to the design of user-friendly and ergonomic systems by means of innovative interfaces such as voice, vision, and gestures. Many literature works have been reported on emotion recognition using facial expressions and speech modalities (Chen and Huang 2000; Daabaj 2002; Hongo et al. 2000; Massaro 2000). These conventional methods of assessing emotions thorough the speech and the facial expressions of a subject are purposefully expressed and it can be more easily concealed by other subjects (Takahashi 2004). Indeed, it cannot be used for those people who have suffered from severe motor disabilities, amyotrophic lateral sclerosis, paralysis, and introverted characters.
www.intechopen.com
34
Discrete Wavelet Transforms - Biomedical Applications
Another possible approach for emotion recognition is done by using physiological signals (EEG (Electroencephalogram), ECG (Electrocardiogram), EMG (Electromyogram), SCR (Skin Conductance Resistance), ST (Skin Temperature), HR (Heart Rate) and RR (Respiration Rate)). There are many works reported on physiological signals based emotion recognitions (Hai-Rong et al. 2008; Takahashi and Tsukaguchi 2003; Wagner et al. 2005; Yongjin and Ling 2005). Furthermore, the physiological response of individual subjects will not be concealed by the physiological responses of other subjects. Compared to all these physiological signals, EEG plays a major role on detecting the emotion directly from the brain at higher temporal and spatial resolution. Furthermore, the brain activity is naturally expected to precede the muscular and vascular activities. Several approaches have been reported by different researchers on assessing the emotional changes from EEG signals (Takahashi and Tsukaguchi 2003; Teixera et al. 2009). More details on the automatic emotion recognition using physiological signals and EEG as well as more complete list of reference can be found in (Murugappan et al. 2010).
2. Related work Rhythmic activity is a fundamental property of neural elements and is organized in complex patterns depending on the state of the brain. The oscillatory nature of EEG signals varies according to the role in variety of brain operations, including the aspects of emotions, perception, cognition and action. The EEG signals are primarily categorized into 5 different frequency bands: delta (0-4) Hz, theta (4-8) Hz, alpha (8-16) Hz, beta (16-32) Hz, and gamma (32-64) Hz. It is very difficult to find the specific region on skull where the brain activity is sufficiently high to detect an emotional state. Tekell, et.al (Min et al. 2005) reports that, most of the meaningful information about emotional changes is found in the frequency below 30 Hz EEG signals. Table 1 shows the list of previous works on emotion recognition using different EEG frequency bands features. Several studies have yielded results on the alpha frequency band, which is more prominent rhythm for determining the emotional states in terms of amplitude and frequency characteristics of EEG (Choppin 2000; Robert et al. 2008; Yuan-Pin et al. 2007). The first work on classifying discrete emotions (joy, anger, sad, and neutral) using alpha band power is reported in (Yuan-Pin et al. 2007). Normally, the high frequency EEG waves namely beta and gamma frequency ranges play a vital role on two-way (agree (valence) – disagree (arousal)) classification of emotions (Teixeira and Vinhas 2008; Teixera et al. 2009). The gamma band of oscillation is used for accessing information about emotional consciousness of the person (Mu and Bao-Liang 2009). In (Gunsel et al. 2006), they have considered the information of all the five frequency bands for classifying emotions in two dimensional (calm-exciting) and three dimensional (calmexciting-neutral) emotions and achieved an average classification rate of 60% for two and 50 % for three dimensions respectively. The depression of alpha rhythm on right hemisphere is found on “positive” emotions (pleasant) and the frontal electrodes in left hemisphere are responding to “negative” emotions (unpleasant) under beta rhythm (Gunsel et al. 2006). Indeed, the investigation on theta band also carried out for both positive and negative emotions. On the other hand, four frequency bands such as: delta, theta, alpha and beta band powers are used for classifying discrete emotions (Khalili and Moradi 2009; Schaaff and Schultz 2009a; Schaaff and Schultz 2009b). Heraz, et.al., has developed the emomental (emotional & mental) agent for Intelligent
www.intechopen.com
Discrete Wavelet Transform Based Selection of Salient EEG Frequency Band for Assessing Human Emotions
35
Tutoring System and used the energy of four different frequency bands (delta, theta, alpha, and beta) in classifying 8 emotional-mental states such as: anger, boredom, confusion, contempt, curious, disgust, eureka and frustration (Heraz et al. 2007). Among all the previous works, the maximum emotion classification rate of 93.25% is reported on classifying two emotions (happy and sad) (Mu and Bao-Liang 2009). Reference
(Choppin and 2000) (Yuan-Pin et al. 2007) (Robert et al. 2008)
No of No of Subjects Electrodes
Two Dimensional Emotions No’s Types Alpha Frequency Band Stimuli
31
4
Visual
2
5
32
Audio
4
10
64
Visual
2
Valence - Arousal
Max % CR
64
Joy, Anger, Pleasure, Sad 69.69 Valence – Arousal
71
Other Frequency Bands (Murugap pan et al. 2010) (Mu and Bao-Liang 2009) (Khalili and Moradi 2009) (Schaaff and Schultz 2009b) (Schaaff and Schultz 2009a) (Heraz et al. 2007) (Petranton akis and Hadjileont iadis 2009)
--
3
Visual
3
Joy, Sad, Neutral
74
10
62
Visual
2
Happy, Sad
93.25
5
10
Visual
3
Calm, Positively excited and negatively excited
76.67
5
4
Visual
3
Pleasant, Neutral, and Unpleasant
66.7
5
4
Visual
3
Pleasant, Neutral, and Unpleasant
47.11
17
3
Visual
8
4 emotional and 4 mental states
82.27
16
4
Visual
6
Happy, Anger, Fear, Disgust, Sad, and Surprise
84.72
Five Frequency Bands (Delta to Gamma) (Jacko et al. 2009)
28
3
Visual
2
Valence- Arousal
Table 1. List of previous works on emotion recognition using EEG signals with its classification rate
www.intechopen.com
74.11
36
Discrete Wavelet Transforms - Biomedical Applications
Determining the rhythmic brain activity for different emotional stimulus is a promising area of research for providing an in-depth picture of how the brain frequencies vary for different emotions. Most of the previous studies are focused on assessing the two dimensional human emotion (valence-arousal) through different frequency ranges of EEG signals. Only few works have been proposed on discrete human emotion classification. Furthermore, there is no defined range of frequency nominated for improving the emotion classification rate. Hence, it is necessary to determine the range of frequency which gives the maximum classification accuracy on assessing discrete emotions. The maximum mean emotion classification rate of 84.72% is achieved using alpha and beta band for classifying six emotions (Petrantonakis and Hadjileontiadis 2009). In addition, most of the previous works have considered less number of subjects for developing the emotion recognition system. In our earlier work, we have considered alpha band features for classifying the discrete emotions. The maximum mean emotion classification rate of 78.043% is achieved using KNN (Murugappan et al. 2009b). In this work, we consider two different frequency bands (alpha to gamma and delta to gamma) of EEG signals for classifying discrete emotions using a set of conventional and proposed features.
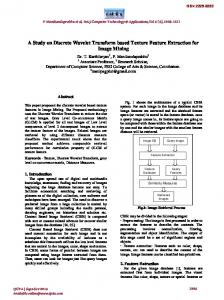
3. Research methodology 3.1 EEG data acquisition 3.1.1 Emotion elicitation method This section describes the acquisition of EEG signals for emotion assessment experiments. Emotions can be induced by one of the following ways: (a) visual (images/pictures) (Yongjin and Ling 2005) (b) audio-visual (film clips/video clips) (Takahashi 2004) (c) recalling of past emotional events (d) audio (songs/sounds) (Wagner et al. 2005). Most of researchers are using visual stimuli and audio-visual stimuli for evoking emotions. In our previous work, we have used both visual and audio-visual stimuli for evoking discrete emotions. The result of this study confirms that, audio-visual stimulus performs superior in evoking emotions than visual stimulus (Murugappan et al. 2009a). The main advantage of this method resides in the strong correlation between induced emotional states and the physiological responses. Hence, we have designed an audio-visual induction based protocol for eliciting the discrete emotions in this present work. The structural overview of emotion recognition system using EEG signals is shown in Fig 1. The audio-visual stimulus protocol for Trail 1 of our experiment and self-assessment questionnaires is shown in Fig. 2 and Fig 3. The orders of the emotional video clips are changed in a random manner for other trials (Table 2). Time durations of video/film clips for five trials is given in Table 3. X1 to X5 denote time periods of selected video clips. The time duration of video clips vary from one another. All the video clips are short in time duration and with more dynamic emotional content. The selection of video clips is based on self assessment questionnaires given in Fig 3. Between each emotional stimulus (video clips), a blank screen is shown for 10 sec duration to bring the subject to their normal state and to experience a calm mind. As a result of the self-assessment report of subjects, totally five trials for three emotions (happy, surprise and disgust) and four trials for two emotions (fear and neutral) are considered for all our future analysis.
www.intechopen.com
Discrete Wavelet Transform Based Selection of Salient EEG Frequency Band for Assessing Human Emotions
37
3.1.2 Subjects A pilot panel study is conducted on 25 university students to select any 5 video clips (trials) for each emotion from 115 emotional video clips including from the international standard emotional clips*. The subjects who have undergone for this panel study does not take part in the data collection experiment. Three females and seventeen males in the age group of 21-39 years were employed as subjects in our experiment. Once the consent forms were filled-up, the subjects were given a simple introduction about the research work and the various stages of experiment.
Fig. 1. Emotion Recognition System overview
Fig. 2. EEG data acquisition protocol using audio-visual stimuli
www.intechopen.com
38
Discrete Wavelet Transforms - Biomedical Applications
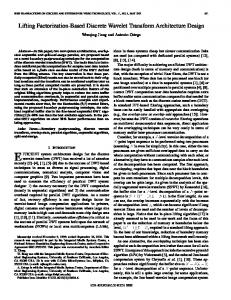
Fig. 3. Self-assessment questionnaires used in emotion recognition experiment 3.1.3 Experimental setup The recording of EEG signal is done through Nervus EEG, Iceland with 64 channel electrodes at a sampling frequency of 256 Hz and band-pass filtered between 0.05 Hz and 70 Hz. There are totally 62 active electrodes plus one electrode for ground (Oz) and one for reference (AFz). In addition, we collected the recording of eye blink rate by two EOG (Electroocculogram) electrodes (EOGL & EOGR), which are placed above the right and left eyes of the subjects. Trials
Order of Emotions
1
Happy
Neutral
Fear
Surprise
Disgust
2
Neutral
Surprise
Happy
Disgust
Fear
3
Disgust
Neutral
Surprise
Happy
Fear
4
Surprise
Happy
Disgust
Fear
Neutral
5
Disgust
Happy
Fear
Neutral
Surprise
Table 2. Order of emotional stimuli used over five trials in emotion recognition experiment
www.intechopen.com
Discrete Wavelet Transform Based Selection of Salient EEG Frequency Band for Assessing Human Emotions
Trials
39
Duration of emotional stimuli in Minute (min)
1
0.13
0.58
0.14
0.10
0.59
2
0.59
0.14
0.23
0.10
0.22
3
0.56
0.24
0.12
0.13
0.30
4
0.20
0.10
0.58
0.25
0.44
5
0.59
0.09
0.35
0.57
0.15
Surprise
Disgust
Statistical Computations Happy
Neutral
Fear
Mean
0.136
0.484
0.252
0.142
0.484
Std. Deviation
0.056
0.149
0.080
0.038
0.215
Table 3. Time duration of each emotional stimulus used in emotion recognition experiment All the electrodes are placed over the entire scalp using International standard 10-10 system (Böcker et al. 1994) (Fig 4). The impedance of the electrodes is kept below 5 k . Between each emotional video clips, under self assessment section, the subjects were informed to answer the emotions they have experienced (Abu Osman et al. 2008). Finally, 5 trials for disgust, happy and surprise emotions and 4 trials for fear and neutral emotions are considered for further analysis. All the signals are collected without much discomfort to the subjects.
Fig. 4. Placement of electrodes according to International 10-10 system
www.intechopen.com
40
Discrete Wavelet Transforms - Biomedical Applications
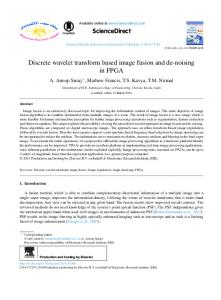
3.2 Preprocessing and normalization The recorded EEG signals are usually contaminated with noises (due to power line fluctuations and due to external interferences) and artifacts (due to eye blinks, eye ball rotations and muscular movements). The complete removal of artifacts will also remove some of the useful information of EEG signals. This is one of the reasons why considerable experience is required to interpret EEGs clinically (Gott et al. 1984; Jung et al. 2000). A couple of methods are available in the literature to avoid artifacts in EEG recordings. However, removing artifacts entirely is impossible in the existing data acquisition process. The research methodology of emotion recognition using EEG is shown Fig 5. 5 emotions * No. of trials * 62 channels (5 trials for disgust, happy and surprise; 4 trials for fear and neutral)
Raw EEG Signal
Preprocessing and Normalization (Surface Laplacian filtering and Zero Mean Unit Variance (ZMUV))
Feature extraction by “db4”, “db8”, “sym8” and “coif5” wavelet functions (5 emotions * 5 or 3 frequency bands * 20 subjects*No. of trials) X 62 channels
5 fold cross validation
Training
Testing KN N & LDA
Emotions
Fig. 5. Overview of emotion recognition procedure In this work, we used Surface Laplacian (SL) filter for removing the noises and artifacts. The SL filter is used to emphasize the electric activities that are spatially close to a recording electrode, filtering out those that might have an origin outside the skull (Gin-Shin et al. 2005). In addition, it also attenuates the EEG activity which is common to all involved channels in order to improve the spatial resolution of the recorded signal. The neural activities generated by the brain, however, contain various spatial frequencies. Potentially
www.intechopen.com
Discrete Wavelet Transform Based Selection of Salient EEG Frequency Band for Assessing Human Emotions
41
useful information from the middle frequencies may be filtered out by the analytical Laplacian filters (Xinyi et al. 2008). Hence, the signal “pattern” derived from SL filters is similar to “spatial distribution of source in the head”. The mathematical modeling of Surface Laplacian filter is given as
Xnew (t ) X(t )
1 NE X i (t ) NE i 1
(1)
where Xnew : filtered signal ; X(t) : raw signal ; NE: number of neighborhood electrodes The preprocessed signals are normalized using Zero Mean Unit Variance (ZMUV) method. Normalization is used to reduce the individual difference between the subjects and also used to reduce the computational complexity. 3.3 Feature extraction EEG signals are often quantified based on their frequency domain characteristics. Typically the spectrum is estimated using Fast Fourier Transform (FFT). A fundamental requirement in the FFT based spectral analysis is that the signal is to be stationary. Indeed, the EEG signals cannot be considered as stationary even under short time duration, since it can exhibit considerable short-term nonstationarities (Anderson and Sijerčić 1996). In the EEG based emotion recognition research, the non-parametric method of feature extraction based on multi-resolution analysis of Wavelet Transform (WT) is quite new. The joint timefrequency resolution obtained by WT makes it a good candidate for the extraction of details as well as approximations of the signal which cannot be obtained either by Fast Fourier Transform (FFT) or by Short Time Fourier Transform (STFT) (Mallat 1989; Merzagora et al. 2006). Hence, this method of feature extraction is adopted in this present work. The non-stationary nature of EEG signals allow us to expand basis functions created by expanding, contracting and shifting a single prototype function ( a,b, the mother wavelet), specifically selected for the signal under consideration The mother wavelet function a, b (t) is given as
a , b (t )
1 tb ) ( a a
(2)
where a, b R, a>0, and R is the wavelet space. Parameters 'a' and ‘b’ are the scaling factor and the shifting factor respectively. The only limitation for choosing a prototype function as mother wavelet is to satisfy the admissibility condition (Eqn. 3), C
( )
2
d
(3)
where ( ) is the Fourier transform of a, b (t). The time-frequency representation is performed by repeatedly filtering the signal with a pair of filters that cut the frequency domain in the middle. Specifically, the discrete wavelet transform decomposes the signal into an approximation coefficients (CA) and detailed coefficients (CD). The approximation coefficient can be subsequently divided into new approximation and detailed coefficients. This process can be carried out iteratively
www.intechopen.com
42
Discrete Wavelet Transforms - Biomedical Applications
producing a set of approximation coefficients and detail coefficients at different levels of decomposition (Parameswariah and Cox 2002). In this work, four different wavelet functions: “db4”, “db8”, “sym8” and “coif5” are used for decomposing the EEG signals into five different frequency bands (delta, theta, alpha, beta, and gamma). These wavelet functions are chosen due to their near optimal time-frequency localization properties. Moreover, the waveforms of these wavelets are similar to the waveforms to be detected in the EEG signal. Therefore, extraction of EEG signals features are more likely to be successful (Glassman 2005). In Table 3, A5, D5, D4, D3, and D2 represent the five EEG frequency bands. Table 4 also presents the bandwidth and the frequencies corresponding to different levels of decomposition of EEG signal with a sampling frequency fs=256 Hz (Parameswariah and Cox 2002). Frequency Range (Hz)
Decomposition Level
Frequency Bands
0-4 4–8 8 – 16 16 – 32 32 – 64 64 - 128
A5 D5 D4 D3 D2 D1
Delta Theta Alpha Beta Gama Noises
Frequency Bandwidth (Hz) 4 4 6 18 32 64
Table 4. Decomposition of EEG signals into different frequency bands with a sampling frequency of 256 Hz 3.3.1 Frequency band selection From the literature study in Section 2, most of the researchers have attempted to classify the two dimensional emotions (valence-arousal) by considering the three different frequency ranges: alpha band (8 Hz -16 Hz), beta and gamma band (16 Hz – 64 Hz), and delta to gamma band (0 Hz – 64 Hz). In this work, a first set of experiments are carried out with four conventional features (power, standard deviation, entropy and variance) for classifying distinct emotions (Table 5). We have computed the average classification accuracy and individual classification rate for each feature over two different frequency bands. The result of classification accuracy is reported in Section 4. In order to improve the classification rate of emotion assessment, we proposed a new feature related to frequency band power ratio called as “Recoursing Power Efficiency” (RPE) (Eqn 6) for classifying the emotions. In addition, we also extended the RPE called Logarithmic Recoursing Power Efficiency (LRPE) (Eqn 7) and Absolute Logarithmic Recoursing Power Efficiency (ALRPE) (Eqn 8) for classifying emotions. Eqn 6 to Eqn 8 show the mathematical equation of computing statistical features of RPE of gamma band using five frequency bands. Similarly, these equations are extended to remaining frequency bands for calculating the statistical features in classifying emotions. One of the major limitations on this area of research is the lack of international standard data base. Hence, in this present work, we compared the efficacy of proposed features with the efficacy of a set of conventional features for estimating the classifiability. Similarly, we can derive the proposed features for three frequency bands by replacing Ptotal-5b as Ptotal-3b in Eqn (6) to Eqn (8).
www.intechopen.com
Discrete Wavelet Transform Based Selection of Salient EEG Frequency Band for Assessing Human Emotions
Features
Formula to Compute
Description
( d ( k ) d ( k ))
SD j
Standard Deviation
43
j
k
j
k1
Measures the deviation of electrodes potential from its mean value over different emotional EEG signals.
d j ( k ) is the mean value of the
wavelet coefficient d j ( k ) is the detail wavelet coefficient
Variance
1 N Vj ( d j ( k ) d j ( k ))2 N k 1
Power
Pj
1 N (d j ( k )2 ) N k 1
Measures the squares of the amplitude of EEG signal
H p j log p j ; where p j Entropy
Measures the value variation in electrical potential for various emotions.
M
Ej
j 1
ET
E j = Energy at jth frequency band of decomposition
Measures the useful information (nonlinearity) about the EEG signal for emotion from the intrusive noise.
ET = Energy of all frequency band of
decomposition J = level of wavelet decomposition; k = No of wavelet coefficients varies from 1 to N
Table 5. Conventional statistical features used for emotion recognition and their description Ptotal 5 b Pdelta Ptheta Palpha Pbeta Pgamma
(4)
Ptotal 3b Palpha Pbeta Pgamma
(5)
RPEgamma
Pgamma
Ptotal 5b
Pgamma LRPEgamma log 10 Ptotal 5b
Pgamma ALRPEgamma abs log 10 Ptotal 5 b
www.intechopen.com
(6)
(7)
(8)
44
Discrete Wavelet Transforms - Biomedical Applications
where P= frequency band power; Ptotal-5b= total power of 5 frequency bands (delta to gamma; Ptotal-3b= total power of 3 frequency bands (alpha to gamma) 3.3.1.1 Motivation for new statistical feature proposal
In conventional analysis, researchers have computed the total wavelet energy by considering the complete range of EEG signal frequencies irrespective to the selected frequency bands. For example, if the researchers considered the alpha to gamma frequency (8 Hz – 64 Hz) bands for their analysis means, the total wavelet energy is computed between delta to gamma (0 Hz – 64 Hz) compared to the total energy of the selected frequency range (8 Hz – 64 Hz). According to the literature, the authors certainly believes that, the low frequency details (0 Hz – 8 Hz) gives an useful information for some special applications such as sleep stage classification (0.5 Hz – 4 Hz) and mental fatigue analysis and driver drowsiness detection (0.5 Hz – 8 Hz). Therefore, the consideration of entire frequency range may yield poor classification results due to the additional and non-informative details than considering the selected frequency ranges. Thus, this present work has adopted the selected frequency range for computing the total wavelet energy for deriving the statistical features further than entire frequency range. Therefore, the effectiveness of newly proposed statistical features on two different combinations of frequency bands is considered for classifying the emotions. 3.4 Emotion classification In this work, we have employed two simple classifiers such as Linear Discriminant Analysis (LDA) and K Nearest Neighbor (KNN) for classifying the discrete emotions. Classification accuracy, representing the percentage of correctly classified instances, has been adopted to quantify the performance of KNN and LDA. 3.4.1 Linear Discriminant Analysis (LDA) Among these two classifiers, LDA provides extremely fast evaluations of unknown inputs performed by the calculations of distances between a new sample and mean of training data samples in each class weighed by their covariance matrices. Indeed, LDA is of very simple but elegant approach to classify various emotions. A linear discriminant analysis tries to find an optimal hyper plane to separate five classes (here, disgust, happy, surprise, fear and neutral emotions). Besides the training and testing samples, LDA does not require any external parameters for classifying the discrete emotions. 3.4.2 K Nearest Neighbour (KNN) KNN is also a simple and intuitive method of classifier used by many researchers typically for classifying the signals and images. This classifier makes a decision on comparing a new labeled sample (testing data) with the baseline data (training data). In general, for a given unlabeled time series X, the KNN rule finds the K “closest” (neighborhood) labeled time series in the training data set and assigns X to the class that appears most frequently in the neighborhood of k time series. There are two main schemes or decision rules in KNN algorithm, the similarity voting scheme and majority voting scheme (Chaovalitwongse et al. 2007).
www.intechopen.com
Discrete Wavelet Transform Based Selection of Salient EEG Frequency Band for Assessing Human Emotions
45
In our work, we used the majority voting for classifying the unlabeled data. It means that, a class (category) gets one vote, for each instance, of that class in a set of K neighborhood samples. Then, the new data sample is classified to the class with the highest amount of votes. This majority voting is more commonly used because it is less sensitive to outliers. However, in KNN, we need to specify the value of “K” closest neighbor for emotions classification. In this experiment, we try different “K” values ranging from 2 to 6. The use of linear classifiers may perform well over the non-linear classifiers on classifying the EEG signals. Thus, this work uses aforementioned two linear classifiers for classifying the human emotions.
4. Experimental results and discussions The main motivation on this present work is to improve the emotion classification rate by selecting the salient EEG frequency bands. Among all twenty subjects, we sample and preprocess the total of 460 EEG epochs from five discrete emotions (20 subjects x 5 emotions (5 trials for 3 emotions and 4 trials for 2 emotions). The number of data points in each epoch depends on the time duration of video clips. In our experiment, the time duration of video clips vary from one another. The next stage is to train the KNN classifier with a best value of K while LDA classifier directly works for classifying the emotions. The classification ability of a statistical feature set can be measured through classification accuracy by averaging five times over a 5 fold cross-validation. The basic stages of 5 fold cross-validation include: (a) total number of samples are divided into 5 disjoint sets (b) 4 sets are used for training and 1 set is used for testing (c) repeat stage (b) for five times and each time the data set is permuted differently. This method reduces the possibility of deviations in the results due to some special distribution of training data and test data. This also ensures that the system is tested with different samples that which are not used in training. The major limitation of the research on emotion recognition using EEG is the lack of international standard database for comparing the efficacy of emotion classification through different approaches. Hence, most of the researchers have used the dissimilar conventional statistical features for classifying emotions through EEG. Currently, the researchers are focusing on determining new statistical features for achieving maximum emotion classification rate. For this purpose, we have proposed the feature based on frequency band power ratio called Recoursing Power Efficiency (RPE). We also expanded this statistical feature into another two forms namely: Logarithmic Recoursing Power Efficiency (LRPE) and Absolute Logarithmic Recoursing Power Efficiency (ALRPE). In general, these features, measure the ratio of power of selected frequency band to the total power of frequency bands. Table 6 to Table 9 shows the average classification accuracy of emotions using conventional and proposed features on two different frequency bands using KNN and LDA respectively. From Table 6 & Table 8, we found that, the conventional feature (entropy) performs better over proposed features on 5 frequency bands. In addition, KNN outperforms LDA by giving a maximum average classification accuracy of 83.04% than the proposed feature (ALRPE) of 79.39%. In this frequency rage, “sym8” wavelet function captures the chaotic nature of EEG signal under different emotions. The individual classification accuracy for the conventional and proposed feature corresponding to the delta to gamma band feature which gives the maximum average classification accuracy on KNN and LDA based classification (Table 6 and Table 8) are presented in Table 10. Basically, entropy is a non-linear feature and it
www.intechopen.com
46
Discrete Wavelet Transforms - Biomedical Applications
measures the amount of non-linearity present in an EEG signal. The non-linearity is probably due to the noise but may also due to the complex dynamics.
KNN based Classification of Emotions using Delta to Gamma band (0 Hz – 64 Hz) in % Wavelet
K
Conventional Features
Proposed Features
ENT
POW
STD
VAR
RPE
LRPE
ALRPE
db4
6
82.35± 1.14
68.13± 1.36
71.91± 3.08
68.91± 1.23
67.47± 1.80
78.91± 1.30
78.47± 1.28
db8
6
81.96± 2.09
68.30± 1.21
73.52± 1.46
68.04± 1.13
68.21± 1.09
77.87± 1.41
78.60± 1.46
sym8
6
83.04± 1.56
67.78± 1.39
72.65± 2.46
68.78± 2.18
67.34± 0.74
78.00± 1.48
79.39± 0.97
coif5
6
82.52± 1.09
67.61± 1.51
76.61± 1.31
68.83± 1.44
65.91± 0.77
76.87± 2.05
78.08± 2.58
Table 6. KNN based classification of emotions using conventional and proposed features on delta to gamma frequency bands
KNN based Classification of Emotions using Alpha to Gamma Bands (8 Hz – 64 Hz) in % Wavelet
K Conventional Features
Proposed Features
ENT
POW
STD
VAR
RPE
LRPE
ALRPE
db4
5
69.93± 2.27
55.87± 2.79
62.46± 1.76
56.01± 3.06
82.32± 2.41
83.04± 2.13
82.25± 1.97
db8
5
70.15± 2.11
55.44± 2.94
62.10± 3.75
55.58± 3.31
82.03± 1.79
86.55± 0.75
81.23± 0.87
sym8
5
71.16± 3.04
57.03± 1.42
62.17± 1.60
56.59± 2.29
81.45± 0.83
81.30± 2.89
81.67± 1.04
coif5
5
81.01± 0.60
55.07± 3.17
65.58± 3.42
55.94± 4.18
82.97± 1.10
82.97± 1.11
82.75± 2.63
Table 7. KNN based classification of emotions using conventional and proposed features on alpha to gamma frequency bands
www.intechopen.com
Discrete Wavelet Transform Based Selection of Salient EEG Frequency Band for Assessing Human Emotions
47
LDA based Classification of Emotions using Delta to Gamma Bands (0 Hz – 64 Hz) in % Wavelet Conventional Features
Proposed Features
ENT
POW
STD
VAR
RPE
LRPE
ALRPE
db4
81.44± 2.14
52.17± 4.91
65.09± 2.74
51.87± 1.65
71.00± 1.95
78.04± 0.84
77.04± 1.88
db8
80.52± 1.61
53.74± 4.76
63.44± 0.28
51.87± 3.04
71.00± 1.16
77.87± 0.96
77.48± 0.11
sym8
79.74± 2.04
51.35± 2.76
64.78± 2.26
50.04± 2.89
70.91± 1.03
77.39± 1.11
77.57± 1.97
coif5
80.30± 1.29
51.52± 1.82
63.83± 1.94
50.35± 3.30
71.04± 1.65
77.96± 0.92
78.26± 0.61
Table 8. LDA based classification of emotions using conventional and proposed features on delta to gamma frequency bands
Wavelet
LDA based Classification of Emotions using Alpha to Gamma Bands (8 Hz – 64 Hz) in % Conventional Features ENT
POW
Proposed Features
STD
VAR
RPE
LRPE
ALRPE
db4
72.90±1.41 63.41±3.10 71.74±2.15 64.57±1.88 76.88±2.05 75.58±1.92 75.73±2.40
db8
72.68±2.38 63.91±2.63 71.59±1.50 62.39±2.29 77.03±1.96 76.38±2.11 75.65±2.13
sym8
73.55±1.51 63.19±3.76 71.67±2.27 64.57±4.22 77.61±2.71 76.81±2.38 76.01±2.14
coif5
70.51±2.65 63.04±2.03 71.88±1.21 63.70±2.39 82.70±1.96 74.93±0.59 76.74±2.36
Table 9. LDA based classification of emotions using conventional and proposed features on alpha to gamma frequency bands Classifier KNN LDA
Method
Feature Wavelet K Disgust Happy Surprise Fear Neutral
Conventional
ENT
sym8
5
92
85
67
68.75
96.25
Proposed
ALRPE
sym8
5
93
84
71
70
78.75
Conventional
ENT
db4
94
83
61
72.5
86.67
Proposed
ALRPE
coif5
92
87
68
68.75
85
Table 10. Individual classification rate of emotions corresponds to the maximum classification rate of conventional and proposed features on delta to gamma frequency bands
www.intechopen.com
48
Discrete Wavelet Transforms - Biomedical Applications
Classifier KNN LDA
Method
Feature Wavelet K Disgust Happy Surprise
Conventional
ENT
coif5
5 5
90
85
71.67
Fear
Neutral
66.67
95.83
72.92
97.92
Proposed
LRPE
db8
91.67
87.67
75
Conventional
ENT
sym8
83.33
61.667
66.67
52.083 85.417
Proposed
RPE
coif5
93.33
63.33
81.67
70.83
93.75
Table 11. Individual classification rate of emotions corresponds to the maximum classification rate of conventional and proposed features on alpha to gamma frequency bands However, the proposed feature, the Logarithmic Recoursing Power Efficiency (LRPE) performs better over the conventional features in 3 frequency band analysis on KNN and Recoursing Power Efficiency (RPE) on LDA. This statistical parameter achieves a maximum of 86.55% classification rate than 81.01% on conventional feature (entropy). Furthermore, LDA based classification gives the maximum classification rate of 82.70% on proposed feature (RPE) compared to the conventional features. The individual classification accuracy for the conventional and proposed feature corresponding to the alpha to gamma band feature which gives the maximum average classification accuracy on KNN and LDA based classification (Table 7 and Table 9) are presented in Table 11. The classification rate of this emotion recognition method shows that, the EEG data collected under audio-visual stimuli environment has useful and enough information to assess discrete emotions from it. In addition, the proposed statistical feature (LRPE) derived from “db8” wavelet function achieve the maximum average classification rate of 86.55% compared to that of all other statistical features. Therefore, these results confirm that, the characteristic pattern of EEG under different emotional states are seems to be similar to the characteristic pattern of “db8” wavelet function. Hence, retrieval of information from the EEG signal from “db8” is highly possible than those of other wavelet functions. Though the level of improved classification rate of proposed feature is smaller than the conventional features, it confirms that the future work on deriving new statistical features based on “power” can improve the emotion recognition rate to a remarkable level. All these analysis are performed in offline using MATLAB 7 software.
5. Conclusion A discrete emotion recognition system to recognize emotions from selected frequency range of EEG signals using new statistical features is presented in this paper. The range of frequency selected by the newly proposed feature gives a maximum average and individual classification rate compared to other conventional features. Therefore the extracted features successfully capture the emotional changes of the subject through their EEG signals regardless of the user’s cultural background, race, and age. Thus, the combination of wavelet features and non-linear classifier greatly improved the emotion classification rate of the proposed system over previous works. In addition, the accuracy of emotion classification reported on alpha to gamma band is higher compared to the other frequency bands considered by previous researchers with a maximum number of subjects with larger category of emotions (Table 1). This study is ongoing to involve different classification
www.intechopen.com
Discrete Wavelet Transform Based Selection of Salient EEG Frequency Band for Assessing Human Emotions
49
algorithms in order to track the emotional status of brain activation during audio-visual stimuli environment.
6. Future work This work can be extended to localize a brain region related to different emotional states. Thereby, the removal of inactive electrodes can be considered for developing more reliable/portable emotion recognition system. If so, the emotion recognition algorithm will be implemented into real life human-computer interaction applications. In addition, the dimensionality of the feature can be reduced by using the artificial intelligence methods to further improve the emotion classification rate.
7. Acknowledgement This work is supported by Ministry of Higher Education, Malaysia and Universiti Malaysia Perlis (UniMAP) Cluster Fund, Malaysia. Grant Code: 9001-00191 & 9003-00214.
8. References Adler, R. B., and Rodman, G. (2003). "Understanding Human Communication." Oxford University Press. Anderson, C. W., and Sijerčić, Z. "Classification of EEG signals from four subjects during five mental tasks." Proceedings of the Conference on Engineering Applications in Neural Networks (EANN’96), 407-414. Böcker, K. B. E., van Avermaete, J. A. G., and van den Berg-Lenssen, M. M. C. (1994). "The international 10–20 system revisited: Cartesian and spherical co-ordinates." Brain Topography, 6(3), 231-235. Chaovalitwongse, W. A., Ya-Ju, F., and Sachdeo, R. C. (2007). "On the Time Series K-Nearest Neighbor Classification of Abnormal Brain Activity." Systems, Man and Cybernetics, Part A: Systems and Humans, IEEE Transactions on, 37(6), 1005-1016. Chen, L. S., and Huang, T. S. "Emotional expressions in audiovisual human computer interaction." Multimedia and Expo, 2000. ICME 2000. 2000 IEEE International Conference on, 423-426 vol.1. Choppin, A., and (2000). "EEG-based human interface for disabled individuals: emotion expression with neural networks ", Tokyo Institute of Technology, Yokohama, Japan. Daabaj, Y. "An evaluation of the usability of human-computer interaction methods in support of the development of interactive systems." System Sciences, 2002. HICSS. Proceedings of the 35th Annual Hawaii International Conference on, 1868-1877. Gin-Shin, C., Chih-Wei, C., Ming-Shaung, J., Chou-Ching, L., and Chih-Cheng, L. "Portable Active Surface Laplacian EEG Sensor for Real-Time Mu Rhythms Detection." Engineering in Medicine and Biology Society, 2005. IEEE-EMBS 2005. 27th Annual International Conference of the, 5424-5426.
www.intechopen.com
50
Discrete Wavelet Transforms - Biomedical Applications
Glassman, E. L. (2005). "A wavelet-like filter based on neuron action potentials for analysis of human scalp electroencephalographs." Biomedical Engineering, IEEE Transactions on, 52(11), 1851-1862. Gott, P. S., Hughes, E. C., and Whipple, K. (1984). "Voluntary control of two lateralized conscious states: Validation by electrical and behavioral studies." Neuropsychologia, 22(1), 65-72. Gunsel, B., Jain, A., Tekalp, A., Sankur, B., Chanel, G., Kronegg, J., Grandjean, D., and Pun, T. (2006). "Emotion Assessment: Arousal Evaluation Using EEG’s and Peripheral Physiological Signals." Multimedia Content Representation, Classification and Security, Springer Berlin / Heidelberg, 530-537. Hai-Rong, L., Zhong-Lin, L., Wen-Jun, Y., and Jin, D. "Emotion recognition based on pressure sensor keyboards." Multimedia and Expo, 2008 IEEE International Conference on, 1089-1092. Heraz, A., Razaki, R., and Frasson, C. "Using machine learning to predict learner emotional state from brainwaves." Advanced Learning Technologies, 2007. ICALT 2007. Seventh IEEE International Conference on, 853-857. Hongo, H., Ohya, M., Yasumoto, M., and Yamamoto, K. "Face and hand gesture recognition for human-computer interaction." Pattern Recognition, 2000. Proceedings. 15th International Conference on, 921-924 vol.2. Jacko, J., Bamidis, P., Frantzidis, C., Konstantinidis, E., Luneski, A., Lithari, C., Klados, M., Bratsas, C., Papadelis, C., and Pappas, C. (2009). "An Integrated Approach to Emotion Recognition for Advanced Emotional Intelligence." Human-Computer Interaction. Ambient, Ubiquitous and Intelligent Interaction, Springer Berlin / Heidelberg, 565-574. Jung, T.-P., Makeig, S., Humphries, C., Lee, T.-W., Mckeown, M. J., Iragui, V., and Sejnowski, T. J. (2000). "Removing electroencephalographic artifacts by blind source separation." Journal of Psychophysiology, 37(2), 163-178. Khalili, Z., and Moradi, M. H. (2009). "Emotion recognition system using brain and peripheral signals: using correlation dimension to improve the results of EEG." Proceedings of the 2009 international joint conference on Neural Networks, IEEE Press, Atlanta, Georgia, USA. Mallat, S. G. (1989). "A theory for multiresolution signal decomposition: the wavelet representation." Pattern Analysis and Machine Intelligence, IEEE Transactions on, 11(7), 674-693. Massaro, D. W. "Perceptual interfaces in human computer interaction." Multimedia and Expo, 2000. ICME 2000. 2000 IEEE International Conference on, 563-566 vol.1. Merzagora, A. C., Bunce, S., Izzetoglu, M., and Onaral, B. "Wavelet analysis for EEG feature extraction in deception detection." Engineering in Medicine and Biology Society, 2006. EMBS '06. 28th Annual International Conference of the IEEE, 2434-2437. Min, Y.-K., Chung, S.-C., and Min, B.-C. (2005). "Physiological Evaluation on Emotional Change Induced by Imagination." Applied Psychophysiology and Biofeedback, 30(2), 137-150.
www.intechopen.com
Discrete Wavelet Transform Based Selection of Salient EEG Frequency Band for Assessing Human Emotions
51
Mu, L., and Bao-Liang, L. "Emotion classification based on gamma-band EEG." Engineering in Medicine and Biology Society, 2009. EMBC 2009. Annual International Conference of the IEEE, 1223-1226. Murugappan, M., Juhari, M. R. B. M., Nagarajan, R., and Yaacob, S. (2009a). "An investigation on visual and audiovisual stimulus based emotion recognition using EEG." International Journal of Medical Engineering and Informatics, 1(3), 342 - 356. Murugappan, M., Nagarajan, R., and Yaacob, S. "Appraising human emotions using Time Frequency Analysis based EEG alpha band features." Innovative Technologies in Intelligent Systems and Industrial Applications, 2009. CITISIA 2009, 70-75. Murugappan, M., Rizon, M., Nagarajan, R., and Yaacob, S. (2010). "Inferring of Human Emotional States using Multichannel EEG." European Journal of Scientific Research, 48(2), 281-299. Murugappan, M., Rizon, M., Nagarajan, R., Yaacob, S., Hazry, D., and Zunaidi, I. (2008). "Time-Frequency Analysis of EEG Signals for Human Emotion Detection." 4th Kuala Lumpur International Conference on Biomedical Engineering 2008, R. Magjarevic, ed., Springer Berlin Heidelberg, 262-265. Parameswariah, C., and Cox, M. (2002). "Frequency characteristics of wavelets." Power Delivery, IEEE Transactions on, 17(3), 800-804. Pease, A., and Pease, B. (2004). The definitive book of body language- How to read others’ thoughts by their gestures, Peace International. Petrantonakis, P. C., and Hadjileontiadis, L. J. "EEG-based emotion recognition using hybrid filtering and higher order crossings." Affective Computing and Intelligent Interaction and Workshops, 2009. ACII 2009. 3rd International Conference on, 1-6. Robert, H., Dragos, D., and Leon, J. M. R. (2008). "Emotion recognition using brain activity." Proceedings of the 9th International Conference on Computer Systems and Technologies and Workshop for PhD Students in Computing, ACM, Gabrovo, Bulgaria. Schaaff, K., and Schultz, T. "Towards an EEG-based emotion recognizer for humanoid robots." Robot and Human Interactive Communication, 2009. RO-MAN 2009. The 18th IEEE International Symposium on, 792-796. Schaaff, K., and Schultz, T. "Towards emotion recognition from electroencephalographic signals." Affective Computing and Intelligent Interaction and Workshops, 2009. ACII 2009. 3rd International Conference on, 1-6. Takahashi, K. "Remarks on Emotion Recognition from BioPotential Signals." 2nd Int. Conf. on Autonomous Robots and Agents, 186-191. Takahashi, K., and Tsukaguchi, A. "Remarks on emotion recognition from multi-modal biopotential signals." Systems, Man and Cybernetics, 2003. IEEE International Conference on, 1654-1659 vol.2. Teixeira, J., and Vinhas, V. "Multimodal Emotion Assessment Framework: Gender and High Frequency Electroencephalography as Key-Factors." International Conference on Informatics and Control, 233-236. Teixera, J., Vasco, V., Luis, P. R., and Eugenio. "Automatic Emotion Recognition Induction and Assessment Framework: Enhancing User Interfaces by Interpreting Users
www.intechopen.com
52
Discrete Wavelet Transforms - Biomedical Applications
Multimodal Signals." International Conference on Bio-Inspired Systems and Signal Processing, 487-490. Wagner, J., Kim, J., and Andre, E. "From Physiological Signals to Emotions: Implementing and Comparing Selected Methods for Feature Extraction and Classification." Multimedia and Expo, 2005. ICME 2005. IEEE International Conference on, 940-943. Xinyi, Y., Ward, R. K., and Birch, G. E. "Facial EMG contamination of EEG signals: Characteristics and effects of spatial filtering." Communications, Control and Signal Processing, 2008. ISCCSP 2008. 3rd International Symposium on, 729-734. Yongjin, W., and Ling, G. "Recognizing human emotion from audiovisual information." Acoustics, Speech, and Signal Processing, 2005. Proceedings. (ICASSP '05). IEEE International Conference on, ii/1125-ii/1128 Vol. 2. Yuan-Pin, L., Chi-Hong, W., Tien-Lin, W., Shyh-Kang, J., and Jyh-Horng, C. "Multilayer perceptron for EEG signal classification during listening to emotional music." TENCON 2007 - 2007 IEEE Region 10 Conference, 1-3.
www.intechopen.com
Discrete Wavelet Transforms - Biomedical Applications Edited by Prof. Hannu Olkkonen
ISBN 978-953-307-654-6 Hard cover, 366 pages Publisher InTech
Published online 12, September, 2011
Published in print edition September, 2011 The discrete wavelet transform (DWT) algorithms have a firm position in processing of signals in several areas of research and industry. As DWT provides both octave-scale frequency and spatial timing of the analyzed signal, it is constantly used to solve and treat more and more advanced problems. The present book: Discrete Wavelet Transforms - Biomedical Applications reviews the recent progress in discrete wavelet transform algorithms and applications. The book reviews the recent progress in DWT algorithms for biomedical applications. The book covers a wide range of architectures (e.g. lifting, shift invariance, multi-scale analysis) for constructing DWTs. The book chapters are organized into four major parts. Part I describes the progress in implementations of the DWT algorithms in biomedical signal analysis. Applications include compression and filtering of biomedical signals, DWT based selection of salient EEG frequency band, shift invariant DWTs for multiscale analysis and DWT assisted heart sound analysis. Part II addresses speech analysis, modeling and understanding of speech and speaker recognition. Part III focuses biosensor applications such as calibration of enzymatic sensors, multiscale analysis of wireless capsule endoscopy recordings, DWT assisted electronic nose analysis and optical fibre sensor analyses. Finally, Part IV describes DWT algorithms for tools in identification and diagnostics: identification based on hand geometry, identification of species groupings, object detection and tracking, DWT signatures and diagnostics for assessment of ICU agitation-sedation controllers and DWT based diagnostics of power transformers.The chapters of the present book consist of both tutorial and highly advanced material. Therefore, the book is intended to be a reference text for graduate students and researchers to obtain state-of-the-art knowledge on specific applications.
How to reference
In order to correctly reference this scholarly work, feel free to copy and paste the following: M. Murugappan, R. Nagarajan and S. Yaacob (2011). Discrete Wavelet Transform Based Selection of Salient EEG Frequency Band for Assessing Human Emotions, Discrete Wavelet Transforms - Biomedical Applications, Prof. Hannu Olkkonen (Ed.), ISBN: 978-953-307-654-6, InTech, Available from: http://www.intechopen.com/books/discrete-wavelet-transforms-biomedical-applications/discrete-wavelettransform-based-selection-of-salient-eeg-frequency-band-for-assessing-human-emotion
InTech Europe
University Campus STeP Ri
www.intechopen.com
InTech China
Unit 405, Office Block, Hotel Equatorial Shanghai
Slavka Krautzeka 83/A 51000 Rijeka, Croatia Phone: +385 (51) 770 447 Fax: +385 (51) 686 166 www.intechopen.com
No.65, Yan An Road (West), Shanghai, 200040, China Phone: +86-21-62489820 Fax: +86-21-62489821