Abstract: This paper deals with using discrete wavelet transform derived features
used for digital image texture analysis. Wavelets appear to be a suitable tool for ...
M. Kociołek, A. Materka, M. Strzelecki P. Szczypiński Discrete wavelet transform – derived features for digital image texture analysis, Proc. of Interational Conference on Signals and Electronic Systems, 18-21 September 2001, Lodz, Poland, pp. 163-168.
DISCRETE WAVELET TRANSFORM – DERIVED FEATURES FOR DIGITAL IMAGE TEXTURE ANALYSIS Marcin Kociołek1, Andrzej Materka1, Michał Strzelecki1, Piotr Szczypiński1 1
Institute of Electronics, Technical University of Lodz, 18 Stefanowskiego Str., 90-924 Lodz, Poland, email: [kociolek][materka][mstrzel][pms]@ck-sg.p.lodz.pl
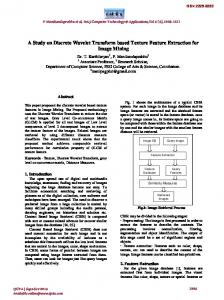
Abstract: This paper deals with using discrete wavelet transform derived features used for digital image texture analysis. Wavelets appear to be a suitable tool for this task, because they allow analysis of images at various levels of resolution. The proposed features have been tested on images from standard Brodatz catalogue. Keywords: Wavelet, image processing, pattern recognition.
1. INTRODUCTION Motivation to this work was COST B11 European project "Quantitation of Magnetic Resonance Image Texture" (1998-2002) [1]. One of its goals is seeking new methods of quantitative analysis of MRI textures. Wavelets appear to be a suitable tool for this task, because they allow analysis of images at various levels of resolution. PC programs: MaZda, Convert and B11 have been developed for COST B11 project, all available at [2]. MaZda allows calculations of about 270 different (now also wavelet derived) features for a given region of interest (ROI) in a digital image. Usually, only a small fraction of features calculated by MaZda can be used to distinguish textures present in an investigated image. The remaining features do not carry the discriminative information with regard to the textures at hand. Also, it is very timeconsuming and difficult to analyze feature vectors in a high-dimensional space. Therefore Convert is used to pre-select a subset of features (e.g. no more than 10) from MaZda output file to form a low-dimensional feature vector, for more detailed analysis by means of B11. Three feature vector transformations are available in B11 to transform the data to a new feature space, in order to reduce the feature vector dimension and increase the discriminative power. These are principal component analysis (PCA), linear discriminant analysis (LDA) and nonlinear discriminant analysis (NDA). Program B11 also allows to perform classification tests on the input data using k-NN and artificial network classifier. As a result of this work, special program module for MaZda, which allows calculation of wavelet subband energy, was developed and tested.
1
2. DISCRETE WAVELETS TRANSFORM The discrete wavelet transform (DWT) is a linear transformation that operates on a data vector whose length is an integer power of two, transforming it into a numerically different vector of the same length. It is a tool that separates data into different frequency components, and then studies each component with resolution matched to its scale. DWT [3] is computed with a cascade of filterings followed by a factor 2 subsampling (Fig1).
x
L
↓2
a1
L
↓2
a2
H
↓2
d1
H
↓2
d2
Fig.1. DWT tree. H and L denotes high and low-pass filters respectively, ↓ 2 denotes subsampling. Outputs of this filters are given by equations (1) and (2)
a j +1 [ p] =
d j +1 [ p] =
+∞
∑ l[n − 2 p]a j [n]
(1)
n = −∞ +∞
∑ h[n − 2 p]a j [n]
(2)
n = −∞
Elements aj are used for next step (scale) of the transform and elements dj, called wavelet coefficients, determine output of the transform. l[n] and h[n] are coefficients of low and high-pas filters respectively One can assume that on scale j+1 there is only half from number of a and d elements on scale j. This causes that DWT can be done until only two aj elements remain in the analyzed signal These elements are called scaling function coefficients. DWT algorithm for two-dimensional pictures is similar. The DWT is performed firstly for all image rows and then for all columns (Fig.2). Columns
Rows aj
L
H
↓2
↓2
L
↓2
aLLj+1
H
↓2
dLHj+1
L
↓2
dHLj+1
H
↓2
dHHj+1
Fig.2. . Wavelet decomposition for two-dimensional pictures.
2
The main feature of DWT is multiscale representation of function. By using the wavelets, given function can be analyzed at various levels of resolution. The DWT is also invertible and can be orthogonal. Wavelets seem to be effective for analysis of textures recorded with different resolution. It is very important problem in NMR imaging, because high-resolution images require long time of acquisition. This causes an increase of artifacts caused by patient movements, which should be avoided. There is an expectation that the proposed approach will provide a tool for fast, low resolution NMR medical diagnostic.
3. TEXTURE FEATURES In this work only one set of DWT derived features is considered. It is a vector, which contains energies of wavelet coefficients calculated in subbands at successive scales. A special module for MaZda program was developed which allows evaluating of those features. To compute the wavelet features in the first step Harr wavelet is calculated for whole image. As a result of this transform there are 4 subband images at each scale (Fig.3).
dHL2 dLH2
dHL1
dHH2
dLH1
dHH1
Fig.3. Subband images.
Subband image aLL is used only for DWT calculation at the next scale. For the given image, the maximum of 8 scales can be calculated. The Harr wavelet is calculated only if output subbands have dimensions at least 8 by 8 points. In the next step, energy (3) of dLH, dHL and dHH is calculated at any considered sale in marked ROIs.
) ∑ (d xsubband ,y
2
E subband , scale =
x , y∈ROI
n
where n is the number of pixels in ROI, both at given scale and subband.
3
(3)
Of course, ROIs are reduced in successive scales in order to correspond to subband image dimensions. In a given scale the energy is calculated only if ROI at this scale contains at least 4 points. Output of this procedure is a vector of features containing energies of wavelet coefficients calculated in subbands at successive scales.
4. MATERIAL The concept of texture has no strict definition. There is also no specific pattern of texture. It causes that textures are very difficult to analyze. From those reasons there is a need of some reference for comparison different methods of texture analysis. Such a reference can be Brodatz catalogue [4], a widely recognized and used. Analysis was performed on 13 images (Fig.4) from this catalogue available at [5]. All images were recorded in 8-bit grayscale format with the size of 512x512 pixels.
grass
pressed calf leather
bark
straw
sand
water
pig skin
brick wall
herringbone weave woolen cloth
wood
raffia
plastic bubbles
Fig.4. Sample textures from Brodatz catalogue
5. METHODS For all pictures, the wavelet-derived features were calculated by means of MaZda for 32 different ROIs with sizes of 64x64 pixels and normalization “±3σ”. This normalization was done by changing the original grayscale to the range [µ-3σ, µ+3σ] where µ is the
4
image mean and σ denotes its standard deviation (both µ and σ are computed for whole image containing homogenous texture). The image intensity within the new range was quantized using 256 discrete levels. In the next step, using Convert program, for each pair of textures, Fisher (4) coefficient was calculated and.
F=
D V
(4)
where D – mean between-class separation, V – mean within-class variance. Ten features with highest F were used as an imput to B11 program where the nearest neighbor classification test (1-NN) [2] was performed.
6. RESULTS There were 78 pairs of textures analyzed in this study. Only two pairs of textures (grass – sand and bark – plastic bubbles) could not be classified with error equal zero. In these booth cases, 2 from 72 samples were misclassified which gives classification error at the level of 3%. For each remaining pair, there existed a set of DWT-derived features with allowed separate those textures by means of 1-NN classificator with no error. Table 1. Effectiveness of classification for pairs of textures
(2) d
d
d
y
y d d
plastic bubbles
brick wall
pig skin
raffia
wood
water
y
sand
y
calf
d
woolen cloth
herringbone weave
straw
bark
y
D (2) D
D (2) d Y
F coefficient < 5 y d -two misclassified samples -one feature enough for 0 classification error -two features required for 0 classification error -more than two features required for proper classification
5
D D
Grass Bark Straw Herringbone weave Woolen cloth Calf Sand Water Wood Raffia pig skin brick wall
For most of examined pairs of textures, the Fischer coefficient for the best feature was over 30 (table 2). Table 2.
Number of pairs of textures with F coefficient in given range Fisher coefficient F