Proceedings of the IEEE International Conference on Automation and Logistics Shenyang, China August 2009
Dispatching Optimization and Routing Guidance for Emergency Vehicles in Disaster Bowen Gong and Zhaosheng Yang
Ciyun Lin
Department of Traffic and Transportation University of Jilin Changchun, Jilin 130022, China
[email protected];
[email protected]
Department of Traffic and Transportation University of Jilin Changchun, Jilin 130022, China linciyun @email.jlu.edu.cn for emergency vehicles under disaster conditions in a largescale network. To maximize the use of the limited emergency supplies, we divide the casualties into different regions based on the pickup locations, quantity and severity of casualties by an adaptive spectral clustering method, and distribute the emergency supplies (such as stations and hospital) to the casualties by k-means clustering method based on the distance among them and the capacity of hospitals, etc. The optimal routes are offered according to the real-time forecasted travel time by centrally dynamic route guidance system based on a parallel computing platform.
Abstract - Based on the problem that disasters occur frequently all over the world recently. This paper aims to develop dispatching optimization and dynamical routing guidance techniques for emergency vehicles under disaster conditions, so as to reduce emergency response time and avoid further possible deterioration of disaster situation. As to dispatching for emergency vehicles, firstly, classify the casualties into several regions based on the pickup locations, quantity and severity of casualties by an adaptive spectral clustering method, and then work out dispatching strategies for emergency vehicles by kmeans clustering method based on the distance among casualties regions, emergency supply stations and hospitals. As to routing guidance for emergency vehicles, centrally dynamic route guidance system based on parallel computing technology is presented to offer safe, reliable and fast routes for emergency vehicles, which are subject to the network’s impedance function based on real-time forecasted travel time. Finally, the algorithms presented in this paper are validated based on the platform of ArcGIS by generating casualties randomly in random areas and damaging the simulation network of Changchun city randomly.
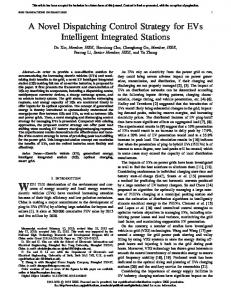
II. THE FRAMEWORK OF EMERGENCY RESPONSE SYSTEM In this paper, we take a dynamic post-earthquake environment as the research background. The emergency response system is composed of the integrative spatialtemporal database storing and dealing with the multi-sources information, emergency strategy formulation subsystems and centrally dynamic route guidance subsystem, etc., as showed in Fig. 1.
Index Terms - emergency vehicles dispatching; adaptive spectral clustering method; centrally dynamic route guidance system; parellel computing;
Centrally dynamic route guidance subsystem based on parallel computation subsystem
Waiting for dispatching
I. INTRODUCTION In recent years, serious disasters occur frequently all over the world, followed by large-scale collapsed buildings and casualties, etc. In 2008, earthquake occurred in Sichuan province of China, where the total number of directly affected people is more than 1000 million, and the human toll is more than 69,000. In the previous researches, people have carried out substantial work in common and small-scale rescue events and some relatively sophisticated theories and technical methods were presented [1, 2], but seldom considered the large-scale network situation and even no a really good method in the support of large-scale network dynamic route optimization based on real-time network traffic information, especially under a disaster condition with serious road damaged. So it becomes urgent and imperative to present rather an effective and reasonable implementation plan to dispatch and guide emergency vehicles to the casualty pickup location or hospitals in the shortest time in order to rescue the casualties as many as possible, simultaneously, avoid further possible deterioration of disaster situation to a great extent. This paper presents a practicable and feasible emergency plan including dispatching optimization and routing guidance
978-1-4244-4795-4/09/$25.00 © 2009 IEEE
Emergency Response System
Emergency vehicles
Routing guidance
Emergency strategy subsystems
detector
CCTV
bacon
Other subsystems
红外检测 Probe
car Remote sensing Telephone reports In-vehicle guidance
VMS
The city network
Fig 1.
the architecture of emergency response system
III. THE INTEGRATIVE SPATIAL-TEMPORAL DATABASE In a dynamic post-earthquake environment, beside the first sudden impact, aftershocks make additional effects in roads damaged and casualties increasing, etc [3]. It observably becomes the most crucial factor about how to utilize the limited emergency supplies in the best way according to the real-time information of road and traffic flow in the emergency work. Based on the on-going updating network
1121
topological structure, we consider an integrative spatialtemporal database system composed of static traffic information and dynamic traffic information as our basic database. The static information mainly refers to the fixed traffic management information and the dynamic information includes traffic flow information, traffic condition information and traffic incident information, etc. Fig. 2 shows the structure of the database.
Z = {z1 , z2 ," , zn } is expressed as network graph G = (V , E ) consisted of the node set V and the link set E , in which each element zi (i = 1, 2," n) owns two properties: the pickup location information L and severity ci of the casualty. And average distance of N-near-neighbors is taken as the scaling parameter σ to adjust measurement scale and standard the weight of links, the optimal cluster grouping k is automatically determined by the average difference between the adjacent eigenvectors used to keep the minimum error. The whole procedure is as: Step1: the estimation of scaling parameter σ Average distance of N-near-neighbor is taken as the approximate estimation of scaling parameter σ .
the on-going updating network topol ogical s tructure nodes updating links updating topological relation updating
Static traffic infor mati on
σi = d( Xi , X N ) Dynamic traffic infor mati on
Where, X N is the N-near-neighbor of X i .
travel flow turn restrictions
traffic condition
No Thoroughfare
traffic incident
#
#
n
N
j =1
i =1
σ = (1/ n)∑ (1/ N )∑ σ i
(2)
Step2: the determination of clustering grouping parameter k Step2.1: calculate scaling parameter σ based on Eq. (1~2) to construct the affinity matrix A ∈ R n× n as − d 2 ( zi , z j ) A(i, j ) = exp( ) if i ≠ j , wii = 0 2
spatial-te mporal database
Fig 2.
(1)
the structure of the spatial-temporal database
σ
IV. THE DISPATCHING STRATEGIES OF EMERGENCY VEHICLES
Where d ( zi , z j ) is the distance function, which is
An excellent dispatching strategy means more time saved and more lives survived. With the casualties distribution got from the analyzing result of the low-altitude/hedgehopping remote sensing data and reports of police and civilians, we divide the dispatching work into three parts: the clustering of casualties pickup locations, the dispatching of emergency vehicles from emergency supply stations to the casualties pickup regions, and the delivering of casualties from the pickup regions to hospitals.
Euclidean distance between zi and z j . Step2.2: define D as a diagonal matrix with Dii = ∑ j =1 Aij and construct the normalized affinity matrix n
L = D −1/ 2 AD −1/ 2 . Step2.3: solve the characteristic equation L to get the eigenvalue and eigenvector to construct the columns ( x1 , x2 ,
" , xi , " , xn ) of the eigenmatrix X in order of eigenvalues. Step2.4: determine the approximately best cluster grouping k based on the average difference between adjacent eigenvectors. Through calculating the ratio of the average difference among the top k adjacent columns in the eigenmatrix X to the first column until which is lower than a given threshold, and the corresponding k is the approximately best value. The absolute value of average difference between adjacent columns in X is defined as
A. the clustering of casualties pickup locations It’s a hierarchical cluster problem for the clustering of casualties pickup locations. First, in order to save emergency vehicles, we cluster casualties into several regions based on the pickup locations and quantity of the casualties, and then cluster the casualties in the same region into a few subsegments according to the severity of casualties to decide the picking up order. Adaptive spectral clustering algorithm [4, 5] is used as the basic clustering method which has been proved to be valid to solve the large-scale network clustering problem in recent researches, which has stronger adaptability, lower calculation cost, higher precision and doesn’t need estimate an explicit model of data distribution, instead of that, being a spectral analysis of the matrix of point-to-point similarities. 1) Adaptive spectral clustering algorithm Adaptive spectral clustering algorithm is based on graph theory, where the dataset composed of reports about casualties
H i −1,i =| X i −1 − X i | ; i = 1 , 2 , " , k , " , n
(3)
The ratio of the absolute value of average difference to the first column mean value (the eigenvetor corresponding to the maximal eigenvalue) is defined as J i = H i −1 / | X i | ; i = 1 , 2 , " , k , " , n
1122
(4)
means clustering method regarding emergency supply stations as the dispatching centers based on the straight-line distance among them.
Where J i decreases with i increasing. With the difference between the adjacent columns decreasing, the corresponding column plays a smaller and smaller role in the cluster grouping division. Step2.5: automatically select the top k eigenvetor eigenmatrix X and construct a new eigenmatrix X based on the resulting of step 2.4. Step2.6: standard each row in the new eigenmatrix X into unit vector Y Yij = X ij / (∑ X ij2 )2 ; Y ∈ R n×k
(5)
j
C. the delivering of casualties form the pickup regions to hospitals Under the consideration of the pickup location, the severity of casualties and the waiting time in hospitals, we also use k-means clustering method regarding hospitals as the delivery centers to allocate the nearest hospital for emergency vehicles as soon as possible.
V. CENTRALLY DYNAMIC ROUTE GUIDANCE SYSTEM BASED ON PARALLEL COMPUTING TECHNOLOGY
Step2.7: define each row in Y as the nodes belonging to the space R k , and divide which into k categories by K-means clustering algorithm. The K-means clustering algorithm [6] is described as Step2.7.1: begin with an initial set of cluster centers S = {Ci } , i = 1 , " , k , where Ci is determined randomly. Step 2.7.2: determine which category each data point belong to based on Eq. (6), the weight w ji = 1 if the data point
In the emergency work, it’s very crucial to offer emergency vehicles with optimal routes to avoid traffic congestion. Centrally dynamic route guidance system always is the best choice in such an environment. But until now, there hasn’t been any good method to cope with the complex computations for shortest path optimizing under a large-scale network in a traditional serial computational environment. It always meets with problems of too much time cost or resulting with an undetermined parameter though many new shortest path algorithms are presented along with the combination of the classic graph theory and the rapid development of computer data structures and algorithms [7,8]. We present to setup a centrally dynamic route guidance system based on parallel computing technology, which can efficiently achieve the shortest path optimization under a large-scale network with a reasonable time horizon. It includes four important components: the network impedance function estimating, the shortest path optimization algorithm of Dijkstra, hierarchical network decomposition algorithm and synchronization transition adaptive termination detection technology. Fig. 3 shows the cluster architecture.
zi belongs to category i , otherwise w ji = 0 . ⎧⎪1, if & X j − Cm &, ∀m ≠ j w ji = ⎨ others ⎪⎩0
(6)
And satisfy k
k
∑ w ji = 1, ∀j = 1,", n,
n
∑∑ w
i =1
ji
=n
(7)
i =1 j =1
Step2.7.3: calculate the objection function J according to Eq. (8). If the change of J is less than a threshold ε given in advance, it means that the clustering result has been steady and the iterative computation comes to the end, otherwise go back to step 2.7.4. k
k
n
J = ∑ J i = ∑∑ w ji & X j − Ci &2 i =1
memory
(8)
Computer N disk
Step2.7.4: update the cluster centers S according to Eq. (9), and go back to step2.7.2. ji
(9)
n
∑w
Network card
Network
Xj
i =1
Network card
Computer 1
n
Ci =
... P
i =1 j =1
∑w
micro-k
Ccache
Fig 3.
ji
shared-nothing cluster architecture pattern
A. the network impedance function estimating In the emergency work, more time saved means more lives survived, so it will be more suitable to use the real-time forecasted travel time T as the weight than distance in the shortest path computing process. In addition, a road reliability factor α should be added into the routine travel time computing since roads might be damaged at any time in the disaster environment. It can be attained from the spatial-temporal database where each road is
j =1
Step2.8: mark the raw data point si as category j Only if the row i in Y is marked as category j . B. the dispatching of emergency vehicles from emergency supplies stations to the casualties pickup regions Emergency supply stations are usually distributed in several different places around the disaster affected regions. To work out the dispatching strategy quickly, we use k-
1123
corresponded to a reliability factor which is mainly determined according to the analyzing result of some advanced road condition assessing instruments, the remote sensing image data and so on. The final weight computing formulation is as Eq. (10). W = T ×α
decomposes the entire computing task among the processors, and straightly affects the computation speed. We present to use a hierarchical network decomposition algorithm based on traveler behavior characteristic and recursive spectral bisection (RSB) method which can effectively reduces the local computing time and the cost of communication among processors. The process of hierarchical network decomposition strategy is as showed in Fig. 4. The computing model of RSB is based on the unstructured grid and astatism accompanying map, through solving the second eigenvector ϕ 2 corresponding to minimum and non-zero eigenvalue of the Laplacian matrix defined as Eq. (11), namely the Fiedler vector, using the median of which to finish the network decomposition.
(10)
Where W is the weight of the link L . B. the shortest path optimization algorithm of Dijkstra Define the graph G (V , E ) as an oriented weighted network, where V and E are the set of nodes and the set of links. And define the adjacency adjacent matrix of the link weight as W , where the weight should satisfy w(i, j ) > 0 , i, j ∈ V V = {0,1," , N − 1} . Define dist ( s ) as the shortest path length, where s ∈ S and i ≠ s . The shortest path algorithm of Dijkstra [9] is: Suppose that exist a node table VL searched, do dist ( s ) ← 0, dist (i ) = ∞(i ≠ s ) , VL = V . Select such a node u
if (vi , v j ) ∈ E ⎧ −1 ⎪ Qij = ⎨deg(vi ) if i = j ⎪0 others ⎩
(11)
The concrete executive steps of this method are: Step1: define variable x for each node according to spectrum strategy, which can be algebraic representation as +1 or −1 corresponding to both sides of the partition line. Step2: solve the second eigenvector ϕ 2 by Rayleigh quotient iteration and map it to an akin vector in the bisection vector p attained when the load is balance. Through finding out the median of the vector ϕ 2 , map the components beyond which as +1, otherwise as -1. Step3: classify the nodes based on the vector Fiedler; set each component of the vector p to the corresponding xi , then the location of the partition line is determined. Step4: divide the traffic network into 2 N parts and make sure that every part has an approximately equal node by iterative computations.
from VL (non -Null) whose dist (u ) is the minimum and appoint u as the searching node. For each node v still in VL , update dist (v) by dist (u ) + w(u, v) if (u , v) ∈ E and dist (u ) + w(u, v) < dist (v) , simultaneously, delete u from VL , terminate the computing until VL being empty set. Input: the adjacency matrix of link weight W (suppose that the w(i, j ) = ∞ and w(i, i ) = 0 when no connection between the node i and the node j ), where the symbol of the node computed is s . Output: dist (0 : N − 1) , where dist (i ) (1 ≤ i ≤ N ) is the shortest distance between the node s and the node j . procedure Dijkstra Begin (1) dist ( s ) = 0 (2) for i = 0 to N − 1 do if i ≠ s then dist (i ) = ∞ end for (3) VL = V (4) for i = 0 to N − 1 do (4.1) Select such a node u from VL whose dist (u ) is the minimum (4.2) for (each node v ∈ VL ) and ( < u , v >∈ E ) do if dist (u ) + w(u , v ) < dist (v) then dist (v) = dist (u ) + w(u , v ) end if end for (5) VL = VL − {u}
Urban network spectral bisection strategy subdistrict
subdistrict
... subdistrict
traveler behavior characteristic strategy subdistrict Fig 4.
subdistrict
... subdistrict
the process of hierarchical network decomposition strategy
D. synchronization transition adaptive termination detection technology To decrease the synchronous processing frequency and the cost of system resource, we use synchronization transition adaptive termination detection technology which can reduce the idle time of busy processors to zero. The concrete executive steps of this method are: Place all sources in local subnetwork into local queue.
end for End
C. the hierarchical network decomposition algorithm Network decomposition algorithm [10] plays an important part in the parallel computation process, which
1124
While termination criteria is not true (1) Solve the shortest path for one source in local queue. (2) Send the changed boundary node labels to neighbors. (3) Receive the boundary node labels from neighbors and place in queue. If processor pt receives token back (4) Perform global operation for termination detection. End if End while.
Fig 5.
The clustering of all casualties pickup locations
VI. SIMULATION Based on the platform of ArcGIS and the network of Changchun city (3420 nodes, 5771 links), we simulate the earthquake scenario for one hour, where casualties are generated randomly in random areas and the simulation network is damaged randomly. Each casualty is assigned an ID number and the road damaged degree is expressed by a road reliability parameter. At the same time, all the generated data are received and dealt with in the spatial-temporal database. There are 20 emergency vehicles and 17 hospitals composed of four large-scale hospitals and 13 small-scale hospitals in the network. And the entire emergency work includes clustering the pickup location of casualties into regions, dispatching emergency vehicles to those regions and then delivering to hospitals.
Fig 6.
2) The rooting guidance system In centrally dynamic route guidance system, we setup two platforms for testing the parallel computation procedure. The platform 1: 4 common PC clusters CPU: Intel (R) Celeron (R) CPU 3.06GHz, memory: 500mB, Gigabit Switch (TP-Link 24 Port Gigabit Ethernet). The platform 2: 4 Lenovo-services CPU:Intel (R) Xeon (R) CPU 3065 @ 2.33GHZ dualcore processor, memory: 1GB. The scales of testing networks are: The network 1: 2000 nodes, 3570 links; The network 2: 3420 nodes, 5771 links. Based on the above platforms and test networks scales, we test the time cost to finish the shortest path optimization of 2000 nodes to all nodes, where the weight is the forecasted travel time. The testing results show that the time cost are less than 5min, just as showed in table II and table III.
A. Testing result 1) The dispatching optimization Based on the adaptive spectral clustering algorithm, the optimal clustering grouping for all casualties pickup locations is k=11, the final clustering centers is as showed in TABLE I and the distribution of regions is just as showed in Fig. 5. Fig. 6 shows the detail result on subsegments division based on the severity of casualties and routes in region 4 and region 11. In region 4, it’s divided into 4 subsegments and the emergency vehicles are divided into two groups (one group with z4.1 and z4.4, the other group with z4.2 and z4.3). TABLE I.
The subsegments division and routing guidance of region 4 and region 11
THE FINAL CLUSTER CENTERS OF CASUALTIES TABLE II.
Region R1
R2
R3
R4
R5
R6
information Longitude 125.2827 125.3365 125.3767 125.2511 125.304 125.3823 Latitude 43.92771 43.92137 43.91791 43.90101 43.90715 43.87634 The number 43 33 10 53 10 26 of casualties R7 R8 R9 R10 R11 Longitude 125.3371 125.3116 125.2510 125.4023 125.2985 Latitude 43.88805 43.8688 43.8584 43.84927 43.83961 The number 16 12 43 47 42 of casualties
The number of process
The network a (s)
The network b (s)
3
272
227
4
139
164
5
94
127
6
85
91
7
90
155
TABLE III.
1125
THE TEST RESULTS OF PLATFORM 1
THE TEST RESULTS OF PLATFORM 2
The number of process
The network a (s)
The network b (s)
3
232
198
4
121
159
5
80
116
6
67
76
7
67
137
8
68
214
9
70
251
3) The emergency response time Fig. 7 shows the transformation of response time with casualties, from which we can see that response time is small at the start because of the enough emergency supplies. But with the increasing of casualties, the response time takes on a trend which first increases and then reaches a plateau.
program, with the Grant NO. 2007AA12Z242 and Grant NO.2007AA11Z218. REFERENCES [1]
Haghani A, Tian Q, Hu H. A Simulation Model for Real-Time Emergency Vehicle Dispatching and Routing. Transportation Research Record, 1882 pp 176-83, 2004. [2] Sherali HD, Desai J, Glickman TS. Allocating Emergency Response to Risk with Equity Considerations. American Journal of Mathematics and Management Science, 24 (3) pp 367-410, 2004. [3] Arun Jotshi, Qiang Gong and Rajan Batta. Dispatching and Routing of Emergency Vehicles in Disaster Mitigation Using Data Fusion. SocioEconomic Planning Sciences, 43 pp 1-24,2009. [4] Qingliu Zhong, Zixing Cai. Adaptive Spectral Clustering Algorithm for Color Image Segmentation. Computer Application Research, 25 (12) pp 3697-3699, 2008. [5] AZRAN A, GHAHRAMANIZ. Spectral Methods for Automatic MultiScale Data Clustering. Proc of IEEE Computer Society Conference on Computer Vision and Pattern Recognition Washington: IEEE Computer Society, pp 190-197, 2006. [6] Jim Z.C. Lai, Yi-Ching Liaw. Improvement of the K-Means Clustering Filtering Algorithm. Pattern Recognition. 41 pp 3677-3681, 2008. [7] Guoliang Chen. Parallel Computing --- Structure, Algorithm and Programming. High Education Press, pp 285-416, 1999. [8] Zhihui Du. Parallel Programming High-Performance Computing Technology-- MPI Parallel Programming. Tsinghua University Press, pp 95-258, 2001. [9] Tongcheng Huang. Basic Operations Research Tutorial. Shanghai People's Press, pp 119-124 , 2004. [10] Chan T F, Ciarlet P, Szeto W K. On the optimality of the median cut spectral bisection method[J]. SIAM J Sci Cornput, 18(3) pp 943-948, 1997. [11] Zhou Chun-hua. A method of non-structured mesh partition for parallel computation[J]. Journal of Aviation, 25(3) pp 229-232, 2004. [12] MICHELLE R HRIBAR, VALERIE E TAYLOR.Termination Detection for Parallel Shortest Path Algorithms[R]. Chicago: Technical Report CSE-97-004, Computer Science-Engineering, EECS Department, Northwestern University, 1997.
response time
2500 2000 1500 1000 500 0 0
50
100
150
200
casualties
Fig 7.
Transformation of response time with casualties
VII. CONCLUSIONS AND FUTURE WORK Based on the clustering method and parallel computing technology, this paper successfully achieves the dispatching optimization and dynamic routing guidance for emergency vehicles in disaster environment. The simulation testing results show the validity of these algorithms. In the future research work, we will impose on optimizing the algorithm architecture to improve the computing speed further. ACKNOWLEDGMENT The authors wish to thank National High-tech Research and development program committee to support the “863”
1126