INTERNATIONAL JOURNAL OF COGNITIVE ERGONOMICS, 1998, 2(4), 307—320 Copyright © 1998, Lawrence Erlbaum Associates, Inc.
Displaying Information in Two and Three Dimensions J. G. Hollands Department of Psychology University of Idaho Moscow, Idaho Byron J. Pierce Air Force Research Laboratory Mesa, Arizona Lochlan E. Magee Defence and Civil Institute of Environmental Medicine Toronto, Ontario, Canada ABSTRACT We compared the effectiveness of 3 display types for graphically presenting paths of vehicular movement over time in 2 experiments. The display types were 2-dimensional (2D), 3-dimensional with monocular cues (3D mono), and 3-dimensional with monocular cues and stereopsis (3D stereo). In Experiment 1, participants judged whether the paths were diverging or converging (trend estima tion task). In Experiment 2, participants estimated how far apart the paths were at specified points in time (difference estimation task). The results showed advantages for 2D displays, but the advantages were moderated by other factors. For trend estimation, there was an advantage for 2D displays at me dium and large rates of divergence/convergence, but a slight advantage for 3D stereo was evident at smaller rates. For difference estimation there was an advantage for the 2D display when the distance from a graduated scale was small, but the advantage decreased as distance from the scale increased. The results are discussed in terms of the proximity compatibility principle and possible mental oper ations used.
1.
DISPLAYING INFORMATION IN TWO AND THREE DIMENSIONS
The recent development of affordable computer graphics technology has spawned the wide spread use of three-dimensional (3D) displays as a means for visually representing numeri cal data, yet little is known about the efficacy of this technique relative to more common two-dimensional (2D) display formats. A large number of tasks require rapid and accurate interpretation of multidimensional data by a human operator, and a 3D display may have a
Requests for reprints should be sent to Justin G. Hollands, Department of Psychology, University of Idaho, Mos cow, ID 83844—3043. E-mail:
[email protected]
308
HOLLANDS, PIERCE, MAGEE
potential advantage for these tasks. In particular, tasks requiring an observer to assess the po sitions of moving vehicles over time may be able to take advantage of the integration of three dimensions into one display. We were interested in determining if it would be advantageous to view a graph that integrates three variables (x, y, and time) into one display, or if it would be beneficial to plot x versus time and y versus time separately, so they can be read without potential interference.
1.1.
Predictions of the Proximity Compatibility Principle fPCP)
The PCP, a framework for display design developed by Wickens and colleagues (Carswell & Wickens, 1987; Wickens & Carswell, 1995), proposes that for tasks requir ing the integration of information across different data points in the display, more inte grated displays should produce superior performance. for tasks requiring a focus of attention on one or a few elements of the display, less integrated displays should produce superior performance. One method for integrating information is to combine data dis played in separate 2D displays into one 3D graph (Wickens, Merwin, & Lin, 1994). Sev eral methods can be used to portray depth information on a display surface; these typically rely on the use of monocular depth cues such as shading, interposition, relative size, and linear perspective. The kinetic depth effect refers to the perception of depth pro duced by viewing a 2D representation of an object undergoing a rotation around its hori zontal or vertical axis. This monocular depth cue can also be effective in displays (e.g., Sollenberger & Milgram, 1993). The available evidence comparing 2D and 3D displays is partially consistent with the predictions of the PCP. Wickens et al. (1994) had participants establish which of three fic tional companies had the highest value of three variables, and found that 3D displays using monocular cues (3D mono) produced shorter response times than did 2D displays. Partici pants using the 3D mono display also performed better on a subsequent test requiring a global estimate of stimulus properties. There was no advantage for the 2D displays in their focused attention task, however. Wickens and Todd (1990) showed that, although partici pants took longer with 3D displays, certain emergent features in the 3D display reduced er ror for an integration task. for their focused attention task, the 2D displays produced larger error but shorter latencies than did the 3D displays. In addition to the monocular depth cues typically used in 3D data displays, stereopsis (the fusion of slightly different information presented to each eye) is a compelling depth cue for most people. It provides a performance advantage in a path-tracing task, for example (Sollenberger & Milgram, 1993). Wickens et al. (1994) found that 3D displays using stereopsis (3D stereo) produced superior performance across a range of task types, but espe cially for tasks requiring information integration.
1.2.
Summary of Experiments
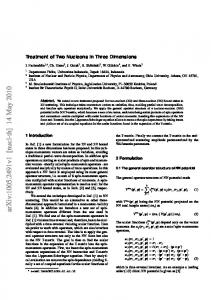
The primary aim of this study was to compare the effectiveness of 2D, 3D mono, and 3D stereo displays for showing paths of vehicular movement in two experiments. Examples of the displays used in the experiments are shown in Figures 1 and 2. In the first experi ment, participants performed a trend estimation task, in which they estimated whether
309
2D VERSUS 3D Are the vehicles converging or diverging?
100
0
Y
x
An example of a three-dimensional display used in the experiments. The instructions are for the trend estimation task (Experiment 1). The participant could rotate the cube using the mouse.
FIGURE 1
two vehicles were generally (i.e., considering both x and y dimensions) diverging or con verging over time. In the second experiment, participants performed a difference estima tion task, in which they estimated the distance (in one dimension) between the two vehicles at a given time. Because the trend estimation task requires a more global, inte grated judgment than difference estimation, the PCP predicts better performance for the more integrated 3D display in Experiment 1. Information required to perform this task in the 3D displays is derived by estimating the difference in Euclidean space between points on each path and determining whether this difference increases (diverges) or decreases (converges) over time. For the 2D display, this information is derived by integrating the distance information presented in the separate graphs. Because the difference estimation task requires a less integrated, more focused judgment than trend estimation, the PCP predicts better performance for the less integrated 2D displays in Experiment 2. The re suits of Wickens et ai. (1994) suggest that stereopsis may be more effective for an infor mation integration task; hence stereopsis should be more likely to have an effect in Experiment 1, where accurate perception of the relative depths of the two paths at differ ent times is important.
370
HOLLANDS, PIERCE, MAGEE What is the diffetence nY at lime 5?
‘\\__
,,
Time 45
t0
0
10
20
3D
40
50
60
70
80
90
00
x
0
10
20
30
40
50
60
70
80
90
Y
FIGURE 2 An example of a two-dimensional display used in the experiments. The instructions are for the difference estimation task (Experiment 2).
A second aim of the experiments was to explore possible strategies or mental operations that participants might use to perform the two tasks. Manipulating a quantitative variable over a range and determining whether it interacts with the display type is a useful technique for investigating mental operations in graphical perception (Hollands & Spence, 1994). This was done in both experiments.
1.3.
Combining Three Dimensions
It is important in many transportation domains (e.g., navigating ships or flying aircraft, in formation) to know the distance between vehicles in one dimension, regardless of variation in the other. When training groups of people for these tasks, instructors need to have access to precise information about the relative location of multiple vehicles. One might argue that a 2D (x vs. y) map or planar representation might be an effective representation for an instruc tor. However, the position of two vehicles at one point in time may differ in both x andy di mensions. Hence, the designer must find some method for coding time (e.g., using color or symbols), and the observer must decode that representation. Further, it may be difficult to ig nore variation in the irrelevant dimension. If asked to make an estimate of the difference in x at a particular time, the observer may find it difficult if the difference in y was large, as shown in Figure 3. Indeed, it has been shown that a large separation on the irrelevant dimension im pairs perception of distances on the relevant dimension when judging maps (Rossano, Adam, Booker, & Middleton, 1996). This would not be a problem for the 3D display shown in Figure 1, or the 2D display shown in Figure 2, because the height indicates the time in question. The planar representation might also present a problem for establishing divergence
00
2DVERSUS3D
311
Whc,t is the difference in X?
0
0
20
30
40
50
60
70
00
90
00
x FIGURE 3 An example of a two-dimensional planar display. Xand Ypositions are plotted on the ordinate and abscissa, respectively. Time could be plotted using changes in color, alphanumerics, or with symbols, as shown here.
and convergence of vehicles (trend estimation) if it is unclear when the vehicles are at partic ular locations. Hence, it would appear important to represent time explicitly as one of the di mensions in the display for both difference and trend estimation to be performed accurately. Additionally, if we are to consider the generalizability of the results to other vehicular domains, or outside the vehicular domain (e.g., pressure, temperature, and time), it may be crucial to plot all three dimensions explicitly, as in figures 1 and 2, and not implicitly, as in the planar display.
2.
EXPERIMENT 1
In Experiment I, participants made trend estimation judgments (“Are the two vehicles di verging or converging overtime?”). The rate at which the Euclidean distance (i.e., the short est, straight-line distance between the vehicles) increased (or decreased) was manipulated in Experiment I. There were three rates at which this distance converged or diverged. These are referred to as Euclidean verging rates: small, medium, and large. A small Euclidean verging rate should be most difficult to detect, with medium and large verging rates being progres sively easier. If accuracy increases with verging rate at the same rate for the three display types, it is consistent with similar operations being used in each case; if not, different pro cesses may be at work. Because trend estimation involves integrating information from many data points, a 3D display integrating x, y, and time data should produce superior perfor mance according to the PCP. Hence, the 3D displays should produce better performance than the 2D display in Experiment 1. Consistent with the results of Wickens et al. (1994), we would expect that stereopsis might improve performance for this integrative task.
312 2.7.
HOLLANDS, PIERCE, MAGEE
Method
2.7.7. Participants. Twelve adult participants employed by the Defence and Civil Institute of Environmental Medicine with normal or corrected-to-normal vision were re cruited. They were randomly assigned to a participant number, which determined the order of the various experimental conditions, and received payment for participating. 2.7.2. Stimuli and apparatus. A set of six monotonically increasing exponential functions was generated. The functions were of the form
f (t) = 5, e1’’’
)/K,
where i was one of the integers from Ito 6, t was time, and K1 and K2 were constants (set to 15 and 30, respectively, for all functions). The minimum and maximum values for t and ftt) were 0 and 100. Values of S were: S = 1.5,S2= 1.5125,53=1.5375,54= 1.5875, S5 = 1.6875, and S6 = 1.8875. Hence, S6 produced the largest rate of change, and S the smallest. The sign of S was switched to obtain six corresponding decreasing functions, producing 12 functions in total. For the six increasing functions, three converging function pairs were created (Si—S6, S2—S5, and S3—S4), each having a different verging rate (large, medium, and small, respectively). The intercept values (where functions met the x or y axis) were determined when functions were combined. The intercept for the S6 function was a randomly chosen integer between 0 and the difference between 100 and the maxi mum value of the function, ensuring that the entire function would be shown when plotted. The intercept for the Si function was a randomly chosen integer with the constraints that it was larger than the intercept for the S6 function, and the Sj func tion could not cross the 56 function. Hence, the S function was placed above the S6 function to form the first pair of functions. S2—S5 and S3—S4 pairs were produced sim ilarly. To create three diverging pairs of increasing functions, a similar procedure was followed so that the intercept for the Si function was smaller than the 56 inter cept and the functions did not cross. The 52—55 and 53—54 pairs were constructed in the same manner, producing three rates of divergence in total. Six pairs (three con verging, three diverging) of decreasing functions were combined analogously, pro ducing 12 function pairs in total. Two pairs of monotonic functions were shown on each trial. Each of 12 function pairs was combined with 4 other function pairs from the set of 12, producing 48 pair combina tions (or more technically, permutations). When function pairs were combined, one pair represented the relation between x and time, and the other between y and time, as shown in Figure 2. Hence, 24 pair combinations were the x—y reversals of 24 other combina tions. All converging pairs were combined with diverging pairs whose verging rate dif fered (e.g., if the rate of convergence was small, that function pair was combined once with a medium-divergence pair and once with a large-divergence pair). Thus, there were three verging rate combinations: small—medium, small—large, and medium—large. The Euclidean verging rates were small with a small—medium pair combination, medium with a medium—large pair combination, and large with a small—large combination. Each Eu clidean verging rate can be represented as a function of t, and the mean derivative values
2D VERSUS 3D
313
of the functions at t = 100 were .061 for small, .112 for medium, and .174 for large Eu clidean verging rates. The 48 pair combinations were plotted using three different display formats: 2D, 3D mono, and 3D stereo. Graduated axes were shown for all display types, with a labeled tickmark at each 10-unit increment. Vertical and horizontal grid lines were shown at 25-unit increments. Each axis was labeled. The frameworks were drawn as black on a gray back ground. The distance represented by 100 units (x, y, or time) was approximately 16 cm for all display formats. Figures 1 and 2 show examples of the 3D and 2D displays, respectively. The figures were slightly modified from the stimuli to be more readable when printed on pa per without using color. In the 2D display, the left graph was a plot of x versus time, and the right graph a plot of y versus time. The position of one vehicle was represented by two red functions (one on each plot), and the position of the other was represented by two blue functions. For the 3D displays a cubic space was shown, with x, y, and time forming the three di mensions of the cube. The functions displayed were the same as in the 2D display, but inte grated so that the position of each vehicle was represented by one colored function (red or blue). When positioned so that a rear surface of the cube was coplanar to the display screen, the 100-unit distance on the rear surface was 12 cm. The rear and base surfaces of the cube were green. The cube was rendered using linear perspective, interposition, relative size, and shading as monocular depth cues, as Figure 1 shows. For the 3D displays, movement of the graph using the mouse provided motion-based depth cues (kinetic depth and motion parallax). The initial position on each trial was as shown in Figure 1. The rotational limits (relative to this initial position) were: —52.7° to 52.7° in the x dimension, and —8° to 45° for the y dimension. A Silicon Graphics Indigo2 workstation was used to present the displays and record each participant’s responses. Graphics displays and experimental control software were created in C++ using the SGI graphics library. The monitor was 48.3 cm (measured diagonally) with a resolution of 1280 x 1024 pixels (horizontal x vertical). The design characteristics of the 3D stereo display were the same as the 3D mono display, except that participants achieved stereopsis by viewing the display through a pair of liquid-crystal shutter stereo glasses (the Crystal eyes Stereoscopic System, model CE—PC). For all display conditions, text height was approximately 3 mm and did not vary with depth or rotation of the 3D dis plays. Participants were screened for binocular vision using the circles subtest of the Titmus Stereo Test. Eleven of the 12 participants reported no difficulty fusing the 3D stereo dis plays nor did they report other artifacts (e.g., ghosting). The data for one participant that re ported slight diplopia for the 3D stereo display did not differ from those of the others and were therefore included in the analyses.
2.1.3. Design. Experiment I had a 3 x 3 within-subjects design, with display type and verging rate serving as independent variables. Participants completed a block of 48 trials for each of the three display types. The order of the blocks was counterbalanced across par ticipants. There were 16 small, 16 medium, and 16 large verging rate trials within each block; thus, there were 16 trials in each condition. The order of the 48 trials within each block was randomized for each participant. Hence, the various levels of verging rate were presented in a random order. The primary dependent variable was the proportion of correct responses in each condition. Response time and mouse movement data were also collected.
314
HOLLANDS, P[ERCE, MAGEE
2.1.4. Procedure. At the beginning of the session, participants were seated at the workstation at a distance of approximately 50cm. After participants took the stereo test, they read instructions on the display, specifying that they would see the position of two vehicles plotted as a function of time with different display types, and that they could control the viewing position by moving the mouse with the 3D displays. When participants began the experiment, they were asked to estimate whether the two vehicles were generally diverging or converging overtime. Participants were shown each graph for 5 sec. After the graph was cleared from the display, a “diverge” and a “converge” box were shown, and the participant responded by selecting one box with the mouse. Participants performed $ practice trials fo] lowed by the 144 experimental trials. After completing the experiment, which required ap proximately 25 mm, participants were debriefed.
2.2.
Results
2.2.1. Accuracy. For each participant, the proportion of correct trials was com puted for each of the nine conditions. These data were submitted to a 3 x 3 within-subjects analysis of variance (ANOVA) with display type and Euclidean verging rate serving as inde pendent variables. As figure 4 shows, the relative effectiveness of the display types de pended on the verging rate, producing a significant interaction, F(4, 44) = 5.79, MS = O.OIOS,p < .01. Tests for simple effects indicated that there were differences among the dis plays for medium and large verging rates, F(2, 22) = 10.5, MS. = 0.009, p < .001 for medium; F(2, 22) = 5.66, MS. = 0.007, p < .025 for large, but no differences among displays for the small verging rate, although the test approached conventional significance levels, F(2, 22) = 2.99, MS. = .0 13, .07
.45. Separate ANOVAs performed on response times for correct trials versus incorrect trials also showed no effects. Hence, there was little evidence to suggest a speed—accuracy tradeoff. 2.2.3. Mouse movements. Participants could adjust the orientation of the 3D cube in both 3D mono and stereo conditions by moving the mouse. To examine the amount of movement of the 3D display space, two measures of mouse movement were computed for each trial: number of movements and distance traversed. The number of mouse movements was computed by determining if the mouse had moved or not during a short period (1/60th of a second), and summing the number of move periods. The mouse was said to have moved if the cursor arrow moved at least two pixels. The measure therefore indicated how often the mouse moved, but was insensitive to the size of the movement during each period. Mean values were computed for each participant in each condition and these data were submitted to a 2 x 3 within-subjects ANOVA with dis play type (3D stereo and 3D mono) and verging rate serving as independent variables. The 3D mono condition produced a greater number of mouse movements than the 3D stereo condition, ff1, 11) = 4.92, MSe = 366.82, p < .05. No other effects reached conventional sig nificance levels. Distance traversed was computed by taking the total distance traversed in the x dimen sion, squaring it, adding it to the squared distance traversed in the y dimension, and taking the square root. Units for distance were the number of pixels traversed by the tip of the cur sor arrow shown on the screen. Mean values were computed for each participant in each condition and these data were submitted to a 2 x 3 within-subjects ANOVA. There was no difference between 3D mono and stereo conditions in distance traversed, f(1, 11) = 0.31, MSe = 77920.3, p> .59, nor did any other effect reach conventional significance levels.
2.3.
Discussion
The 3D displays were not as effective for trend estimation as 2D displays with medium and large verging rates. It may not have been immediately clear to the participant what viewing position provided the clearest demonstration of Euclidean divergence or convergence with the 3D displays. The 3D displays used in the experiment may not have provided emergent features (Bennett & Flach, 1992; Wickens et al., 1994) that mapped onto the trend estimation task requirements. There was a general improvement in accuracy as verging rate increased for the 2D dis plays, but the pattern for 3D displays was less consistent. This suggests a different sequence of mental operations for the different displays. It is possible a sequence of slope estimation
316
HOLLANDS, PIERCE, MAGEE
operations (Hollands & Spence, 1992, 1994) was being used with the 2D displays to estab lish which pair of functions is converging (or diverging) at a larger rate. With the 3D dis plays, participants appeared to orient the cube to a position providing the clearest demonstration of Euclidean vergence, and may have then performed two slope estimation operations to estimate the convergence or divergence. With the 3D mono display, partici pants had difficulty correctly detecting the trend unless it was large. Although not signifi cant, there appeared to be a small advantage for stereo when the verging rate was small. Stereopsis may have helped in orienting the 3D display to an appropriate vantage point for establishing trends with small verging rates. The 3D mono condition produced more mouse movements than did the 3D stereo condi tion, although the distance traversed by the mouse in the 3D mono and stereo conditions did not differ. This suggests that participants were making a larger number of small mouse move ments in the mono condition. Participants may have used small jiggling movements to en hance their perception ofdepth using the motion-based depth cues. In the stereo condition, the information provided by stereopsis may have rendered such movement unnecessary. Infor mal observation ofthe participants during the experiment is consistent with this explanation. The results of Experiment 1 are at odds with the predictions of the PCP. Participants gen erally performed better with the less integrated 2D display for trend estimation, an informa tion integration task. Stereopsis did improve performance (although the difference did not reach conventional significance levels) when the verging rate was small, consistent with the notion that stereopsis should improve performance for an integrative task.
3.
EXPERIMENT 2
In Experiment 2, participants were required to make difference estimation judgments (e.g., “What is the difference in y at Time 50?”). We manipulated the height of the to-be-estimated difference from the base of the graph. If participants use a graduated scale in estimating dif ferences (the scale lookup operation; Hollands & Spence, 1992, 1994), one might expect greater error as the distance from the scale increased. There is evidence that scale distance af fects the scale lookup operation: Churchill (1956) found that increasing the distance of a pointer from a graduated scale increased error, and more recently, Gillan and Neary (1992) found that increasing the distance from a scale increased the time required to compare two quantities in a line graph. However, if participants compare the difference to the width of the display instead (a ratio estimation operation; Hollands & Spence, 1994, 1998), then one would expect little effect on error as the distance from the scale increased. Hence, in Experi ment 2, display type and the value of time (height) were manipulated. Absolute error (the ab solute value of judged minus true difference), response time, and mouse movement mea sures were obtained. Difference estimation involves focusing attention on only a few data points out of the many displayed. Hence, the less integrated 2D display should produce better performance than the 3D displays in Experiment 2, according to the PCP.
3.1.
Method
The participants in Experiment 2 were the same as those in Experiment 1. The stimuli and ap paratus were essentially the same as in Experiment 1. Participants saw the same functions, the same display formats, and completed the same number of trials.
2D VERSUS 3D
317
Experiment 2 had a 3 x 12 within-subjects design, with display type and height (values of serving as independent variables. The t values used were: 0, 5, 10, 20, 30, 40, 50, 60, 70, 80, 90, and 100, and were randomly assigned to the 48 function pair combinations described in Experiment 1. The assignments were the same for all display conditions. As in Experi ment 1, participants completed a block of 48 trials for each display type and the order of the blocks was counterbalanced across participants. The order of the 48 trials within each block was randomized for each participant. There were 4 trials for each of the 12 values of t within each block. Thus there were 4 trials in each condition and the various levels of height were presented in a random order. The primary dependent variable was absolute error (absolute value of estimated difference minus true difference). The procedure for Experiment 2 required participants to estimate the distance (in one di mension, x ory) between the two vehicles at a specified time, and to respond by typing an in teger between 0 and 100 on the numeric keypad and pressing the enter key. Participants were shown each display for 10 sec. Other procedural details were as in Experiment I. t)
3.2.
Results
3.2.7. Absolute error. For each trial, an absolute error value was obtained. Out liers (values exceeding three standard deviations above the mean) were eliminated from fur ther analysis. This resulted in the removal of 28 trials out of 1728, or 1.6% of all trials. The re maining 1,700 trials were used as raw data for all subsequent analyses (including those performed on response time and mouse movements). A mean absolute error score was computed for each participant in each condition. These data were submitted to a 3 x 12 within-subjects ANOVA, with display type and height serv ing as independent variables. Means are shown in FigureS. There was a difference between 2D and 3D displays when the difference to be judged was close to the base of the graph and 4.0
3D STEREO
3D MONO
20 3.5
•
3.0 ••_•
•.
,
V
. U] U]
U)
I
— _,
I
—
I
1.5
.
—-—-
•
—
3 0
__——-r •
2.5
.
•
I I
1.0
0.5
0.c 0102030405060708090100
0102030405060708090100
0102030405060708090100
HEIGHT,
FIGURE 5 Difference estimation task: Absolute error as a function of height squares regression functions are shown as dashed lines.
(t)
and display type. Least
318
HOLLANDS, PIERCE, MAGEE
when the difference was at the top of the graph, but not otherwise. The interaction was sig nificant, f(22, 242) = 2.67, MS = 0.958, p < .0005. Simple comparison tests indicated that the 2D display produced smaller absolute error than 3D displays (mono and stereo aver aged) when t = 0, 5, 10, 20, 30, 40, and 100, all ps < .05, but not otherwise. Simple compari Sons also indicated that there were no differences between mono and stereo 3D displays at any height, all PS> .05. Absolute error was regressed on height for each display type to obtain slope estimates. Slopes are expressed as the increase in absolute error for each 10-unit increment in height. The slope value for 2D displays was 0.15, R = .16, f(1, 142) = 27.18, p < .0001. This in creased to 0.21 when absolute error at t= 100 was dropped from the analysis, R2 = .27, f(1, 130) = 49.10, p < .0001. The small slopes for the 3D displays (0.017 for 3D mono and 0.045 for 3D mono) were not significant, R2 = .002, F(1, 142) = 0.27,p> .60 for 3D mono; R2 = .015, f(l, 142) 2.13, p> .14 for 3D stereo.
3.2.2. Response time. for the difference estimation task, a mean response time score was computed for each participant for each display—distance combination. These data were submitted to a 3 x 12 within-subjects ANOVA, with display and height serving as inde pendent variables. There were no differences among the three display type conditions, F(2 ,22) = 1.04, MS = 2.39, p> .35, nor did display interact with height, p> .13. 3.2.3. Mouse movements. As in Experiment 1, measures of number of mouse movements and distance traversed by the mouse were obtained for 3D stereo and mono con ditions, and mean values were obtained for each participant. A 2 x 12 within-subjects ANOVA was performed on number of mouse movements. The 3D mono condition produced more mouse movements than did the stereo condition, except when height equaled 100, F(1 1, 121) = 1.89, MSe = 129.82, p < .05. The distance traversed data were submitted to a 2 x 12 within-subjects ANOVA with dis play type and height serving as independent variables. There was no difference between 3D mono and stereo conditions in distance traversed, F(1, 11) = 0.79, MSe = 22477.0, p > 0.39. No other effect reached conventional significance levels.
3.3.
Discussion
Generally, the advantages for the 2D display occurred when the difference to be judged was close to the scale. With the 2D displays, absolute error increased about 1.5 units over the 100-unit (16 cm) range of height values manipulated in Experiment 2. No increase was evi dent for the 3D displays. The results appear consistent with participants performing scale lookup operations with 2D displays and ratio estimation operations with 3D displays. If par ticipants compared the difference to the width of the cube (or the 25-unit vertical grid lines) then one would expect little effect of the distance from the scale on error. Participants may have been inclined to use ratio estimation with the 3D displays because they needed time to position the cube to an appropriate orientation to make the judgment, leaving less time for the judgment proper. If participants used scale lookup to estimate the difference, one might ex pect poorer accuracy with larger distances from the scale. Placing the difference at the top of
2D VERSUS 3D
319
the graph (t = 100) may have aided the participant in mentally aligning the difference to the graduated axis at the bottom. finally, there did not appear any appreciable advantage to pro viding binocular parallax information in the 3D displays for this task. As in Experiment 1, participants moved the mouse more frequently in the 3D mono con dition, but the total distance moved by the mouse did not increase significantly. Again, this may have resulted from small jiggling motions intended to improve depth perception. The exception occurred when the height of the to-be-estimated difference was maximal (t = 100). Perhaps participants did not have much difficulty locating the height of the difference in this salient location, and hence extra mouse movements for the 3D mono condition would not be necessary. The results of Experiment 2 were generally consistent with the PC?. The PCP predicts that a less integrated display (the 2D displays in Experiment 2) should produce performance superior to that produced by more integrated displays (the 3D displays used in Experiment 2) for a more focused task (difference estimation). 4.
CONCLUSIONS
Participants were more accurate with the 2D display for trend and difference estimation tasks (Experiments 1 and 2, respectively), but only in certain situations: when the diverging or converging trend was larger, and when the difference to be estimated was close to a gradu ated axis. There was no advantage for 3D displays, except for a marginal advantage for 3D stereo in estimating trend with small verging rates. The results are consistent with the PC? in that the less integrated 2D displays produced superior performance for the less integrative task, difference estimation. However, this advantage was moderated by the distance of the to-be-judged difference from the scale. If participants use the scale to estimate differences, their judgment becomes one of information integration, and performance should degrade as the various cues to be integrated are placed farther apart. Hence, from this perspective the Experiment 2 results offer further support for the PCP. However, the Experiment 1 results showed that the more integrated 3D displays did not produce superior performance for an information integration task (trend estimation), and this result is inconsistent with the predictions of the PCP. The result also stands in contrast to the results of Wickens et al. (1994) and Wickens and Todd (1990), both of whom found results showing some 3D advantage. The lack of predictive power may be a result of factors the PCP does not consider, such as the need for orientation of the 3D space prior to judg ment. In speeded tasks such as those used in the current experiment, this results in decreased accuracy. Presumably, in an unspeeded task, it would result in greater time to make the judgment. To obtain a 3D advantage for these tasks, the cube could be oriented to a precomputed “best” position. Alternatively, the Euclidean distance could be portrayed as a colored surface or a mesh whose shape would represent the divergence or convergence of the vehicles. Presenting integrated dimensions may be insufficient to estimate the diver gence or convergence of vehicles; an effective display may need to contain emergent fea tures that map onto integration task requirements. The 3D mono condition produced a greater number of mouse movements than the ste reo condition, but there was no difference between mono and stereo in distance traversed by the mouse in either experiment. Participants make a larger number of small mouse movements in the 3D mono condition, presumably to enhance their perception of depth using motion-based cues. There was little evidence for any other performance difference
320
HOLLANDS, PIERCE, MAGEE
between stereo and mono conditions. Thus, it appears that stereo vision had little benefi cial effect for these tasks, except perhaps for a small advantage in estimating trend with small verging rates.
ACKNOWLEDGMENTS These experiments were conducted at the Defence and Civil Institute of Environmental Medicine while Justin G. Hollands was supported by a Canadian Government Labora tory Visiting Fellowship, and while Byron J. Pierce served as a U.S. Air force Ex change Scientist. We thank Brian Dyre, Ken Kubo, Ralf Kuehnel, Vivian Lee, Tim Meserth, and Drew Miller for technical assistance. Some of the results were presented at the 39th Annual Meeting of the Human factors and Ergonomics Society, San Diego, September 1995.
REFERENCES Bennett, K. B., & Flach, J. M. (1992). Graphical displays: Implications for divided attention, focused attention, and problem solving. Human Factors, 34, 513—533. Carswell, C. M., & Wickens, C. D. (1987). Information integration and the object display: An interaction of task de mands and display superiority. Ergonomics, 30, 511—527. Churchill, A. V. (1956). The effect of scale interval length and pointer clearance on speed and accuracy of interpola tion. Journal of Applied Psychology, 40, 358—361. Gillan, D. J., & Near)’, M. (1992). A componential model of human interaction with graphs. 11. Effects of the dis tances among graphical elements. In Proceedings of the Human Factors Society—36th annuat meeting (pp. 365—368), Santa Monica, CA: Human Factors Society. Hollands, J. G., & Spence, 1. (1992). Judgments of change and proportion in graphical perception. Human Factors, 34, 313—334. Hollands, 3. G., & Spence, 1. (1994). Mental operations in graphical perception. In Proceedings ofthe 12th Triennial Congress of the International Ergonomics Association (Vol. 6, pp. 235—237). Mississauga, Canada: Human Factors Association of Canada. Hollands, J. G., & Spence, 1. (1998). Judging proportion with graphs: The summation model. Applied Cognitive Psychology, 12, 173—190. Rossano, M. J., Adam, G.E., Booker, J. C., & Middleton, S. E. (1996). Semantic and visual factors affecting the rep resentation of map information. Perception, 25, 677—700. Sollenberger, R. L., & Milgram, P. (1993). Effects of stereoscopic and rotational displays in a three-dimensional path-tracing task. Human Factors, 35, 483—500. Wickens, C. D., & Carswell, C. M. (1995). The proximity compatibility principle: Its psychological foundation and relevance to display design. Human Factors, 37, 473494. Wickens, C. D., Merwin, D. H., & Lin, E. 1. (1994). Implications of graphics enhancements forthe visualization of scientific data: Dimensional integrality, stereopsis, motion, and mesh. Human Factors, 36, 44—61. Wickens, C. D., & Todd, S. (1990). Three dimensional display technology for aerospace and visualization. In Pro ceedings of the Human Factors Society—34th annual meeting (pp. 1479—1483). Santa Monica, CA: Human Factors Society.