ISSN (Online): 2349-056X International Journal of Pharmacy Education and Research Apr-Jun 2014; 1(2): 74-80. Available online: www.ijper.net Email:
[email protected]
Research Article
Dissolution method development and validation for combination of meloxicam and paracetamol tablets Tirunagari MAMATHA*1, Zareena YASMEEN2, Nandagopal ANITHA3 1
Department of Pharmaceutics, Sultan-Ul-Uloom College of Pharmacy, Road No.3, Banjara Hills, Hyderabad – 500 034, Telangana State, INDIA. 2 Department of Quality Assurance, Sultan-Ul-Uloom College of Pharmacy, Road No.3, Banjara Hills, Hyderabad – 500 034, Telangana State, INDIA. 3 Department of Pharmacology, Sultan-Ul-Uloom College of Pharmacy, Road No.3, Banjara Hills, Hyderabad – 500 034, Telangana State, INDIA. Received on: 23 June, 2014 Revised on: 26 June, 2014 Accepted on: 26 June, 2014
*Corresponding author: T. Mamatha Sultan-Ul-Uloom College of Pharmacy, Road No.3, Banjara Hills, Hyderabad – 500 034, Telangana State, INDIA. Mobile #: +91-98497-02431 Email id:
[email protected]
ABSTRACT The aim of this investigation was to develop and validate a dissolution method for combination of meloxicam and paracetamol tablets using ultraviolet spectrophotometric method. The analytical method was developed by simultaneous estimation of multicomponent samples using absorbance ratio method which involves the measurement of absorbance at two wavelengths 243 nm as the λmax of paracetamol and 261.8 nm as isoabsorptive point. The method was validated according to international conference on harmonisation guidelines which include accuracy, precision, linearity and analytical range. In addition, stability and solubility of both the drugs in different media i.e., water and phosphate buffer of different pH were studied. Based on this, the established dissolution conditions were 900 ml of 0. 2 M phosphate buffer pH 7.4 as dissolution medium at 37 ± 0.5 °C, using USP apparatus II at a stirring rate of 75 rpm for 1 h. The corresponding dissolution profiles were constructed and the selected brand showed more than 80% drug release within 45 minutes. Thus, the proposed dissolution method and analytical method can be applied successfully for the quality control of meloxicam and paracetamol in marketed tablets. Key words: Analgesic, Dissolution, ICH guidelines, NSAID, UV Spectrophotometric method.
Therefore, it is considered as one of the most important quality control parameter for solid pharmaceutical dosage forms[1].
INTRODUCTION The dissolution test is a simple and useful in vitro tool that can provide valuable information about drug release similarity among different batches and brands. It describes about manufacturing reproducibility, product performance similarity and biological availability of drug from its formulation.
Chemically, Meloxicam (MEL) is 4hydroxy-2-methyl-N-(5-methyl-2-thiazolyl)-2H-1, 2benzothiazine-3-carboxamide-1,1-dioxide (Figure 1). Meloxicam is a Non-steroidal anti-inflammatory drug 74
Tirunagari et al.
IJPER | Apr-Jun, 2014; 1(2): 74-80.
(NSAID)[2]. Chemically, Paracetamol (PCM) is N-(4hydroxyphenyl) ethanamide (Figure 2). It is widely used as analgesic and anti-pyretic [3].
MATERIALS AND METHODS CHEMICALS Meloxicam and Paracetamol were received as gift samples from Aurobindo Pharmaceuticals Ltd. (Hyderabad, India). Potassium dihydrogen orthophosphate and Sodium hydroxide pellets were procured from SD Fine Chem. Ltd. (Mumbai). All reagents and solvents used were of analytical grade. UV-METHOD DEVELOPMENT AND VALIDATION Solubility studies[7] Solubility refers to the ability of a solute to be dissolved in a solvent. Solubility data was used as the basis for the selection of the best solvent for dissolution of Paracetamol (PCM) and Meloxicam (MEL) drugs. It was expressed as percentage of drug dissolved. For equilibrium solubility studies, excess of both the drugs, MEL and PCM was placed separately in 25 ml beakers containing different media: distilled water and phosphate buffer of pH 7.4. The samples were gently rotated in water bath shaker for 48 h. An aliquot (2 ml) was removed from each beaker and filtered using 0.45 µ syringe filter. One ml of the filtered aliquot was diluted with corresponding medium and analyzed spectrophotometrically in triplicate to determine the absorbance at their respective λ max. The amount of drug dissolved was calculated using the calibration curve.
Both the drugs are available in combined tablet dosage form, as NSAIDs. The literature survey revealed that number of methods are reported for the individual drugs and combinations using RP-HPLC, UV methods[4-6] but no method is so far reported for the simultaneous estimation of both drugs in combined dosage form for dissolution studies. Aim of the present work is to develop simple, precise, accurate, linear and specific method for simultaneous determination of Meloxicam and Paracetamol in tablet dosage form and application of the method for the dissolution study. The method was validated according to the International Conference on Harmonization guidelines (ICH Q2 R1).
Stability studies[8] Stability studies were performed by preparing sample solutions of both pure drug mixture and tablet formulation and preserving it for 2 days. An accurately weighed quantity of MEL and PCM each were transferred to 100 ml volumetric flask, dissolved in sufficient quantity of phosphate buffer pH 7.4. The volume was made up to the mark with phosphate buffer pH 7.4 to get the concentration of 100 μg/ml. The solutions of 10 µg/ml were prepared in three replicates. The solutions were kept at room temperature. Aliquots of samples were analyzed spectrophotometrically at 0 h, 4 h and 8 h. The data for stability studies is given in Table 1.
This present investigation describes the method for simultaneous determination of Meloxicam and Paracetamol drugs in dissolution test of tablets. The procedure is based on the use of UV Spectrophotometric multicomponent analysis i.e.; Absorbance ratio method.
Table 1: Stability data of Meloxicam and Paracetamol Absorbance Pure drug mixture Paracetamol
Marketet tablet
Meloxicam
Paracetamol
Meloxicam
0h
4h
8h
1h
4h
8h
0h
4h
8h
0h
4h
8h
0.695
0.695
0.693
0.420
0.419
0.418
0.676
0.675
0.674
0.405
0.402
0.398
0.694
0.692
0.692
0.421
0.418
0.417
0.669
0.665
0.664
0.408
0.405
0.400
0.694
0.697
0.696
0.419
0.418
0.416
0.675
0.669
0.668
0.400
0.396
0.395
75
Tirunagari et al.
IJPER | Apr-Jun, 2014; 1(2): 74-80.
Determination of max
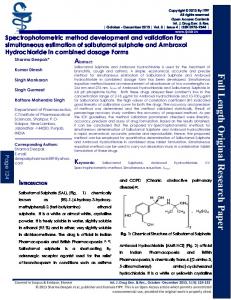
Fig. 5: Calibration curve of MEL
Preparation of Meloxicam standard stock solution An accurately weighed quantity of MEL (5mg) was transferred in 100ml volumetric flask. By adding sufficient quantity of methanol it was sonicated to dissolve it completely. The volume was made up to the mark with phosphate buffer pH 7.4 (Concentration: 50μg/mL). An aliquot (2ml) portion of this solution was diluted with phosphate buffer pH 7.4 in a 10ml volumetric flask up to mark to get final concentration 10μg/ml. The standard solution of MEL was scanned in the range of 200 to 400nm in 1cm cell against solvent phosphate buffer 7.4 using UV spectrophotometer (Shimadzu, Japan) and spectra was recorded to determine the λmax of the drug. Figure 3 shows the overlain spectra of MEL and PCM drugs.
Preparation solution
Fig. 3: Overlain spectra of MEL and PCM
of
Paracetamol
standard
stock
An accurately weighed quantity of PCM (10mg) was transferred in 100ml volumetric flask, dissolved in sufficient quantity of phosphate buffer pH 7.4. The volume was made up to the mark with phosphate buffer pH 7.4 (Concentration: 100μg/ ml). An aliquot (1ml) portion of this solution was diluted with phosphate buffer pH 7.4 in a 10ml volumetric flask up to mark to get final concentration 10μg/ml. The standard solution of Paracetamol was scanned in the range of 200 to 400nm in 1.0cm cell against solvent phosphate buffer pH 7.4 using UV spectrophotometer and spectra was recorded to determine the λmax of the drug. Figure 3 shows the overlain spectra of MEL and PCM drugs.
Preparation of standard solution and Calibration curve
Preparation of standard solution and Calibration curve
From the stock solution of Meloxicam (50 μg/ml) which was prepared in phosphate buffer 7.4. MEL in the concentration range of 2 µg/ml to 20 µg/ml was obtained by transferring (0.4, 0.8, 1.2, 1.6, 2.0, 2.4, 2.8, 3.2, 3.6, 4.0) of stock solution (50 µg/ml) to the series of 10 ml of volumetric flasks and then phosphate buffer 7.4 was added to each volumetric flask up to 10 ml. All dilutions were scanned in wavelength range of 200 nm to 400 nm. The absorbances were plotted against the respective concentrations to obtain the calibration curve of MEL. The UV spectra for the linearity of MEL are shown in Figure 4. The calibration curve of MEL drug is shown in Figure 5.
Paracetamol in the concentration range of 2 to 20µg/ml was obtained by transferring (0.2, 0.4, 0.6, 0.8, 1.0, 1.5, 2.0) of stock solution (100 µg/ml) to the series of 10 ml of volumetric flasks and then phosphate buffer 7.4 was added to each volumetric flask up to 10ml. All dilutions were scanned in wavelength range of 200nm to 400nm. The absorbance was plotted against the respective concentration to obtain the calibration curve. The UV spectra for the linearity of PCM is shown in Figure 6. The calibration curve of PCM drug is shown in Figure 7. Fig. 6: UV spectra for the linearity of PCM
Fig. 4: UV spectra for the linearity of MEL
76
Tirunagari et al.
IJPER | Apr-Jun, 2014; 1(2): 74-80.
Fig. 7: Calibration curve of PCM pure drug
Estimation of MEL and PCM in marketed formulation, ie., Melodol For the estimation in commercial formulation, twenty tablets of brand MELODOL, containing 7.5mg Meloxicam and 325mg Paracetamol were weighed accurately and ground to a fine powder. A quantity equivalent to 217 mg of PCM was transferred to a 100ml volumetric flask. MEL present in this tablet powder was 5mg. The powder was dissolved in 20ml of methanol with vigorous shaking, sonicated and then the volume was made to mark with phosphate buffer pH 7.4. The sample solution was then filtered through Whatman filter paper. The solution was further diluted to get final concentration of 2-20µg/ml of MEL and PCM. Absorbance of each of the resulting solution was measured at 243nm, 261.8nm in 1.0cm cell using phosphate buffer pH 7.4.
Determination of Absorptivity value[9] The absorbance of each of the final dilution (10μg/ml MEL and 10μg/ml PCM) were measured in triplicate in 1.0cm cell against solvent using phosphate buffer pH 7.4 at 243nm and 261.8nm respectively and A(1% 1cm) values were calculated using the following formula:
Validation parameters Validation of the proposed methods was carried out for its linearity, range, accuracy and precision according to ICH guidelines[11]. Linearity and Range
Absorbance ratio method
For the determination of linearity, sample solutions of different concentrations were prepared for MEL and PCM. The absorbance of the above solutions was measured at 243nm and 261.8nm respectively. A graph of absorbance vs concentration is plotted and correlation coefficient was calculated. The linearity data of both drugs the in Melodol was presented in Table 2. The linearity curves are depicted in Figure 8.
[10]
Absorbance ratio method of analysis is based on the absorbance at two selected wavelengths, one of which is an isoabsorptive point and the other being the wavelength of maximum absorption of one drug. From the overlain spectra (Figure 3), 243nm (λmax of PCM) and 261.8nm (isoabsorptive point) are selected for the formation of Q absorbance (Eq. 1 and Eq. 2). The absorptivity values determined for the PCM are 583.9 (ax1), 267.6 (ax2) and for MEL are 244.5 (ay1), 267.6 (ay2) at 243nm and 261.8nm, respectively. These values are mean of six estimations. The absorbance and absorptivity at these wavelengths were substituted in equation 1 and 2 to obtain the respective concentration of drugs.
Acceptance Criteria: Correlation coefficient should be within 0.997 – 0.999. Fig. 8: Linearity curves of MEL and PCM in marketed tablets
Where, Cx = concentration of Paracetamol; Cy = concentration of Meloxicam; A = absorbance of mixture at isoabsorptive point; Qm = ratio of absorbance of laboratory mixture at 243nm and 261.8nm; Qx = ratio of absorptivity of Paracetamol at 243nm and 261.8nm; Qy = ratio of absorptivity of Meloxicam at 243nm and 261.8nm.
Accuracy To check the accuracy of the proposed method, recovery studies were carried out at 50, 100 and 150% of the test concentration as per ICH 77
Tirunagari et al.
IJPER | Apr-Jun, 2014; 1(2): 74-80.
guidelines for both the drugs. The recovery study was performed in triplicate at each level. The result of the recovery studies for the marketed formulation was reported in Table 3.
The absorbance of the standard solutions of 50%, 100% and 150% at 243nm and 261.8nm were measured for MEL and PCM respectively. From this, individual recovery and mean recovery values were calculated.
Table 2: Results for linearity reading of MEL and PCM in MELODOL Sl. No.
Concentration (μg/ml)
1 2 3 4 5 6 7 8 9 10
2 4 6 8 10 12 14 16 18 20
Absorbance (Mean SD) MEL & PCM (216.8nm) 0.066 0.02 0.120 0.01 0.118 0.03 0.266 0.02 0.331 0.01 0.380 0.01 0.444 0.02 0.500 0.03 0.581 0.02 0.656 0.01
MEL (243nm) 0.094 0.01 0.196 0.02 0.298 0.02 0.405 0.03 0.508 0.02 0.617 0.02 0.716 0.03 0.803 0.01 0.911 0.01 1.007 0.01
PCM (243nm) 0.221 0.02 0.326 0.02 0.454 0.01 0.547 0.04 0.678 0.03 0.778 0.02 0.909 0.01 1.024 0.03 1.182 0.02 1.345 0.01
Table 3: Results for recovery studies Meloxicam % conc. at specific levels
Paracetamol
Amount added (mg)
Amount recovered (mg)
% recovery
Mean SD
Amount added (mg)
Amount recovered (mg)
% recovery
Mean SD
2
1.980
99.00
5
5.03
101.32
2
1.984
99.25
99.13 0.125
5
5.08
101.58
101.45 0.130
2
1.982
99.15
5
5.10
101.46
4
3.991
99.01
10
10.16
101.73
4
3.994
99.85
10
10.20
101.92
4
3.998
99.99
10
10.18
101.85
6
5.94
99.00
15
15.20
101.33
6
5.95
99.16
15
15.25
101.66
6
5.96
99.33
15
15.18
101.20
50
100
150
99.58 0.175
99.16 0.116
101.83 0.109
101.39 0.105
Table 4: Results for repeatability Concentration (μg/ml) 4
6
Hour 0 4 6 0 4 6
Meloxicam Concentration found (μg/ml) 4.2 4.6 4.6 6.0 6.2 6.2
SD 0.03 0.05 0.02 0.02 0.04 0.05
78
Paracetamol Concentration found (μg/ml) 3.9 3.8 3.7 5.1 4.9 4.9
SD 0.04 0.05 0.03 0.06 0.05 0.04
Tirunagari et al.
IJPER | Apr-Jun, 2014; 1(2): 74-80. soluble in phosphate buffer pH 7.4, so it is selected as the dissolution medium.
Precision The precision was determined by studying the intermediate precision and repeatability. The percentage relative standard deviation (%RSD) was calculated.
Stability Studies The stability studies were performed by analyzing sample solution of concentration of 10μg/ml prepared by appropriate dilutions from the stock solution of pure drug mixture and tablet powder and preserving for 8 h at room temperature. All the samples were prepared in triplicate. The results of stability studies are given in Table 1.
Repeatability To check the degree of repeatability of the methods, suitable sample solutions of 4 and 6µg/ml were prepared and statistical evaluation was carried out. Repeatability was performed for six times with tablets formulation. SD is shown in Table 4.
PCM and MEL in pure drug mixture and marketed tablet are stable for 8 h at room temperature and complete dissolution studies can be performed within 8 h.
Dissolution method development and validation One tablet was placed in each of the six vessels of the dissolution apparatus USP type II (Tablet dissolution tester, USP model: TDT-06P, Electro labs, India), containing 900ml of 0.2M Phosphate buffer (pH 7.4), preheated at 37±0.5°C and the dissolution medium was stirred at 75rpm. Aliquots of the dissolution medium (5 ml) were withdrawn at 10, 20, 30, 45 and 60min and filtered, discarding the first portions of the filtrate; the amount of drug dissolved was determined by UV using the Absorbance ratio method.
UV method development and validation Determination of λ max Figure 3 shows the overlain spectra of MEL and PCM drugs. From this spectra it has been determined that the λmax of paracetamol is 243nm and the λmax of meloxicam is 363nm. Preparation of Calibration Curve Beer’s law was followed in concentration range of 2-20µg/ml for MEL. Beer’s law was followed in concentration range of 2-15µg/ml for PCM.
Analysis of the dissolution sample The diluted samples of dissolution were analyzed UV spectrophotometrically by the developed UV method and percentage drug release was calculated and shown in Table 5.
Estimation of MEL and PCM in marketed formulation (MELODOL) The diluted samples of MEL and PCM in concentration 10µg/ml were prepared from the stock solution of marketed tablet. The samples were scanned to determine the absorbance. The values were substituted in the absorbance ratio method equations and the concentration is determined. The Melodol contains 99.8% label claim for both the drugs.
Acceptance Criteria: All the 6 tablets must show % drug release of more than 85%. Table 5: Results for dissolution of marketed tablets Sl. No
Time (min.)
1
% Drug release (MeanSD) MEL
PCM
10
68 3.2
74 3.1
Linearity and Range
2
20
73 2.5
81 2.5
3
30
80 3.5
91 3.2
4
45
96 3.4
99 2.4
PCM shows linearity in concentration range of 2-15µg/ml at 243nm and 261.8nm and MEL in range of 2–20µg/ml. The results of linearity are depicted in Table 2.
5
60
110 3.4
108 2.4
CONCLUSION
VALIDATION PARAMETERS
Dissolution method was developed and validated for MEL and PCM tablets using UV spectrophotometric method. The method was validated according to ICH guidelines which include accuracy, precision, linearity and analytical range. Stability and solubility of both the drugs in different media i.e., water and phosphate buffer pH 7.4 was studied. Dissolution conditions were 900ml of 0.2M phosphate buffer pH 7.4 as dissolution medium at 37±0.5°C; using USP apparatus II at a stirring rate of 75rpm for 1 h. Thus, the proposed dissolution method
RESULTS AND DISCUSSION Solubility Studies Solubility of MEL at 25ºC in water and phosphate buffer pH 7.4 was found to be 0.1779 mg/ml and 0.6790 mg/ml respectively. Solubility of MEL is marginally enhanced from water to phosphate buffer pH 7.4. Solubility of PCM at 25ºC in water and phosphate buffer pH 7.4 was found to be 14 mg/ml and 4.7mg/ml respectively. Both the drugs are found to be 79
Tirunagari et al.
IJPER | Apr-Jun, 2014; 1(2): 74-80.
and analytical method can be applied successfully for the quality control of MEL and PCM in marketed tablets.
6.
Dhandapani B, Eswara SM, Susutha N, Rama swetha, Sonia SK, et al. Spectrophotometric estimation of Meloxicam bulk and its pharmaceuticals formulations. International Journal of Pharmaceutical Sciences and Research. 2010; 1(4): 217-221.
7.
Soni T, Nagda C, Gandhi T, Chotai NP. Development of discriminating method for dissolution of aceclofenac marketed formulations. Dissolution Technologies. 2008; 15(2): 31-35.
8.
Rossi RC, Dias CL, Bajerski L, Bergold AM, Froehlich PE. Development and validation of discriminating method of dissolution for fosamprenavir tablets based on in vivo data. Journal of Pharmaceutical and Biomedical Analysis. 2011; 54(01): 439-444.
9.
Khan F, Lohiya R, Umekar MJ. Development of UV spectrophotometric method for the simultaneous estimation of Meloxicam and Paracetamol in tablet by simultaneous Equation, Absorbance ratio and Absorbance correction method. International Journal of ChemTech Research. 2010; 2(3): 1586-1591.
ACKNOWLEDGEMENTS The authors are thankful to the Management, Sultan-Ul-Uloom College of Pharmacy, Hyderabad, Telangana State, India for providing necessary facilities. REFERENCES 1.
Dressman J, Kramer J. Pharmaceutical dissolution testing. Taylor and francis group editors. Dissolution testing: Guidance for industry, New York. Marcel Dekker. 2005; 352353.
2.
Sweetman SC, Martindale: The Complete Drug Reference. 34th edition. Great Britain: The Pharmaceutical Press. 2002. 76.
3.
The United States pharmacopoeia. 34th edition, Rockville, MD: United States Pharmacopoeia Convention, Inc. 2008; 2372-2375.
4.
Madhusudhana Reddy I, Bhagavan RM, Rajendra PY, Pavankumar RK, Meechel A, et al. Simultaneous Quantification of Paracetamol and Meloxicam in Tablets by HPLC. Tropical Journal Pharmceutical Research. 2011; 10(4): 475-478.
5.
Ramesh S, Rupali J, Deepali K, Varsha S. Development and Validation of Spectrophotometric methods for simultaneous estimation of Paracetamol and Meloxicam in pure and tablet dosage form. Der Pharmacia Lettre. 2010; 2(2): 471-478.
10. Beckett AH, Stenlake JB. Practical pharmaceutical chemistry, 4thed. Part 2, Continuum international publishing group, New York. 2001; 284-286. 11. International Conference on Harmonization Q2 (R1). Draft Guideline on Validation of Analytical Procedures, Definitions and Terminology, Federal Register. 60, 11260.
--------------------------------------------------------------------------------------------------------------------------------------International Journal of Pharmacy Education and Research Copyright© 2014 www.ijper.net
[email protected] ----------------------------------------------------------------------------------------------------------------------------- ----------
80