Distributed Change-Point Detection of DDoS Attacks over Multiple Network Domains∗ Yu Chen, Kai Hwang, and Wei-Shinn Ku University of Southern California, Los Angeles, CA 90089
Abstract: Distributed denial of services (DDoS) attacks post a major threat to Internet security. This paper proposes a distributed system to detect flooding DDoS attacks at the earliest possible time. At the launching stage of a DDoS attack, some changes in traffic fluctuation are detectable at the router or gateway level. We develop a distributed change-point (DCP) detection architecture using change aggregation trees (CAT). This DCP scheme detects abrupt traffic changes across multiple network domains serviced by the same ISP or managed by the same organization. The early detection of flooding attacks enables timely countermeasures to minimize damages to the edge networks or to hot-spot victim systems serviced by the provider. Each network domain corresponds to a single autonomous system (AS). The AS domain is equipped with a CAT server to aggregate traffic change information detected at the routers. All CAT servers exchange flooding alert information to make global detection decision across multiple domains. To resolve the conflicts in security policies at different provider domains, a new secure infrastructure protocol (SIP) is developed to establish the trust among them. We report scalable performance results on implementing the DCP detection system over 16 domains in the DETER testbed. The simulated Internet setting reveals that 4 domains are sufficient to yield 98% detection accuracy of TCP SYN and UDP flooding attacks with less than 1% false alarms. By using ISP-controlled AS domains, the DCP system is proven scalable to 84 domains, which appeals to real-life deployment in the Internet environments. Key Words: Network security, DDoS attacks, change-point detection, Internet infrastructure, security protocols, Internet service providers, and overlay networks.
∗
Manuscript submitted to IEEE Transaction on Parallel and Distributed Systems, on August 14, 2006. The research work reported here was supported by National Science Foundation ITR Grant 0325409. All rights reserved by the coauthors and publishers. The preliminary concept was presented in IEEE International Symposium on Collaborative Technologies and Systems (CTS 2006), Las Vegas, May 15-17, 2006. Corresponding author: Kai Hwang, USC Internet and Grid Research Lab, EEB 212, Los Angeles, CA 900892562. E-mail:
[email protected], Tel.: (213) 740-4470, Fax: (213) 740-4418.
August 13, 2006
Page 1 of 30
1. Introduction To defend against distributed denial of services (DDoS) attacks, we wish to achieve realtime detection of incurred network anomalies. Today’s DDoS detection systems are mostly based on detecting the flooding consequences rather the causes of the traffic surges [7], [8], [18], [31], [41], [42]. Flooding consequences are displayed by congestions on communication links [27], overflow in half-open SYN queue [26], or imbalance between incoming and outgoing traffic on router ports [46]. Unfortunately, the damages have already done when these flooding consequences are observed. Thus, it is highly desired to detect the launching of DDoS attacks at the very early stage, instead of waiting for the flooding to become widespread. A comprehensive solution to DDoS attacks requires covering the global effects over the entire Internet. Obviously, the global-scale defense is too costly for a real-life implementation. Even the DETER project [4] can only emulate partial Internet activities on a controlled number of network domains. To implement an efficient defense system, we must leverage the network topology and use distributed traffic monitoring and detection. In other words, we have to build up a scalable DDoS defense system involving only a small number of provider network domains that are closest to the edge network attached to protected user group. In the sequel, we consider each autonomous system (AS) a single network domain, such as the core network of an ISP (Internet service provider). According to the ISO 3166 Report [20] on AS resource allocations, there are 34,998 AS domains reported in August 2006. Dimitropoulos et al. [13] identified that among these AS domains, 67.7% belongs to customer companies, organizations, or universities that run their own networks, 30.3% are ISP controlled domains, the remaining 2% are Internet exchange points (IXPs) or network information centers (NICs). Majority customer AS domains do not share their networks with competitors. Therefore, they are unlikely to take part in collaborative DDoS defense. However, it is possible to convince a small percentage, say 5% of the ISP-controlled domains to join collective effort in combating DDoS attacks. This amounts at most few hundreds of domains to form a consortium for collective DDoS defense. We will prove through statistical analysis that less than 84 AS domains working together would be sufficient to cope with most DDoS flooding attacks. At the early stage of a DDoS attack, the traffic changes are difficult to detect because very little fluctuations in traffic are observable. Monitoring the Internet traffic at August 13, 2006
Page 2 of 30
individual flow level is cost prohibitive to cover all possible flows with the same source/destination IP and protocol. Meanwhile, the global traffic aggregated at wide-area network is tremendously large to perform real-time detection of network anomalies, effectively. To be cost-effective, we propose to monitor the traffic at a superflow level. A superflow contains all packets destined for the same network domain from all possible source IP addresses and applies various protocols such as TCP or UDP, etc. This level lies between the level of largescale aggregate traffic and individual traffic flows. This approach is inspired by the classless inter-domain routing (CIDR) idea [16]. All packets of a superflow have the same destination domain IP address. Motivated by the desire to have lightweight detection with low complexity [3], [9], [46], we propose a distributed change-point (DCP) detection architecture using a new mechanism, called change aggregation tree (CAT). The preliminary concept of CAT was first presented in CTS 2006 [11]. This CAT mechanism is designed at the router level for detecting abrupt changes in traffic flows. When a DDoS attack is launched, the routers can observe some changes in spatiotemporal distribution of traffic volumes at the router ports. The domain server uses the traffic change patterns detected at attack-transit routers to construct the CAT, which represent the attack flow pattern. Usually these changes in traffic flows present a directionality converging towards the victim. Random fluctuations incurred with legitimate traffic flows do not present such converging properties. On the DETER testbed [4], [12], we implemented the DCP scheme over 2 to 16 network domains. We carried out intensive experiments to evaluate the effectiveness of the CAT-based DCP scheme. Under flooding attacks, our scheme is capable of detecting the start of DDoS attacks quickly with high accuracy and low false alarms. The rest of this paper is organized as follows: Section 2 briefly reviews related works. Section 3 presents the principle of change detection methods and the algorithms for raising attack alerts in individual routers. The intra-domain CAT constructing algorithm is given in section 4. The inter-domain change detection algorithm is presented in section 5 along with a new secure infrastructure protocol (SIP). This protocol supports the inter-domain change aggregation operations. Section 6 reports the experiments setups and the performance results based on the DETER experiments. Section 7 discusses scalability issues and deployment limitations. Finally, we conclude with a summary of contributions and discuss further research work needed. August 13, 2006
Page 3 of 30
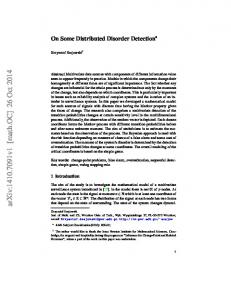
2. Related Work and Our Approach As shown by Fig.1, the DDoS attacker often exploits the huge resource asymmetry between the Internet and the victim systems. The flooding traffic is large enough to crash the victim machine by communication buffer overflow, disk exhaustion, or connection link saturation, etc. A plethora of defense and response mechanisms have been suggested in the past, including IP traceback [1], [25], [48], packet filtering [24], [34], [43], [45] and flood pushback [19]. More sophisticated DDoS attacks [10], [23], [47] have been also studied. Recently, researchers suggested choking DDoS flooding traffic by an offensive approach [42].
Figure 1. Traffic flow distribution of a typical DDoS flooding attack Different options exist regarding where the DDoS defense is deployed. MULTOPS [17] and D-WARD [29] suggested filtering or rate limiting on suspicious flows at the source end. The security managers often focus on protecting their own networks and choose a local detection approaches [7]. For instance, the COSSACK [33] and DefCOM [28] deploy detectors at the victim side and send alert to filter or to rate limiter located at the source side. Chen and Song [9] proposed a perimeter-based defense scheme for ISP to enable anti-DDoS services to their customers. Their scheme relies on the edge routers to identify the flooding sources and use ratelimiting filters. Researchers also use change-point detection theory to detect abnormal Internet traffic caused by DDoS attacks [5], [35], [40], and [46]. Lacking accurate statistics to describe the prechange and post-change traffic distributions, nonparametric CUSUM schemes were developed for simplicity and low computational complexity [5]. These schemes monitor the short-term behavior shift from long-term behaviors. Once the cumulative difference reaches certain threshold, an attack alert is raised. August 13, 2006
Page 4 of 30
Researchers at University of Michigan [46] have suggested a centralized DDoS defense scheme to monitor the change points at the gateway level. They adopted the nonparametric CUSUM method to detect TCP SYN flooding attacks. Peng et al. [35] took a similar approach to monitoring the source IP addresses. Due to the source IP address spoofing, there are many new source IP addresses appeared during DDoS attack. It requires an offline database to keep track of IP addresses in normal traffic. Recently, Soule et al. [40] implemented a defense scheme that combines filtering and statistical methods. Under TCP SYN flooding, the difference between them is distinguished by a CUSUM algorithm [46]. Once the sum exceeds a certain threshold, the TCP SYN DDoS attack is detected. Some theoretical analysis was reported by Blazek, et al [5] to model change-point detection for DDoS defense In this paper, we propose a new distributed aggregation scheme based on change-point detection across multiple network domains. This paper is significantly extended from the preliminary concept presented in CTS 2006 [11]. We extend the architecture from single-domain detection to work over multiple network domains. All DETER experimental results are newly generated. Many previous distributed solutions assumed that networks are willing to cooperate in DDoS defense. This assumption is weakened by lack of trust-negotiation among them, because domains owned by different organizations may not cooperate due to policy conflicts. In fact, the victim-end solution may miss the chances of raising early warning of DDoS attacks at the upstream routers. Our distributed change-detection solution is meant to amend this inadequacy. We build up the cooperation among communicating networks by using a new secure infrastructure protocol (SIP) to resolve the security conflicts among them. This enables the building of an earlier DDoS defense system across multiple ISP domains. Our DCP scheme is capable of tracing back automatically, once the detection is successfully carried our. The global CAT tree covers all related network domains, where the anomalies are observed on the fly.
3. Framework of Distributed Change Detection The DCP scheme detects the start of DDoS flooding attacks by monitoring the abrupt traffic changes at distributed network points. Once a sufficiently large CAT tree is constructed which exceeds certain preset threshold value, a suspicious attack is declared. This section
August 13, 2006
Page 5 of 30
presents the principles behind the DCP system. In this section, change detection is conducted at individual router. In next two sections, we will extend the DCP scheme across network domains. 3.1 Distributed Change Detection System Figure 2 presents the system architecture of the DCP scheme. The system is deployed over multiple AS domains. There is a central CAT server in each domain. The system detects the traffic changes, aggregates detected changes, and collects alerts over collaborative CAT servers. Routers are in charge of attack detection and raising alert, whereas the CAT servers aggregate distributed alerts. The root of the CAT is located at the last-hop domain server. Each tree node corresponds to an attack-transit router (ATR). Each tree edge corresponds to a link between the attack-transit routers. The CAT servers at different domains could form an overlay network or communicate with each other through virtual private network (VPN) channels or an overlay network. The router monitors the incoming and outgoing traffic flows at its input and output ports. Periodically, each router reports the traffic status to the CAT server in its domain. If a router observes abrupt traffic variations, which are far above the historical average, an alert message is sent to the CAT server. The server is responsible to construct the CAT tree for the entire domain. The CAT server also exchanges CAT information with other domain severs.
(a) Multi-domain defense system
(b) Inter-domain communications via VPN tunnels or overlay network atop the CAT servers
Figure 2. Distributed change detection of DDoS flooding attacks over multiple asynchronous systems (AS) or multiple AS domains. In the sequel, AS domains and ISP core networks are used interchangeably. The CAT detection scheme does not need to specify an absolute threshold on traffic volume. The detection is done by checking the number of nodes (routers) raising the alerts from the CAT subtree. August 13, 2006
Page 6 of 30
Figure 3 illustrates how a CAT subtree is constructed at a single domain server. Figure 3(a) shows a flooding attack launched from 4 zombies, the routers along the routing path to the victim detect abnormal surge of traffic at their I/O ports. They report the suspicious flows with the involved upstream and downstream routers to the CAT server. Using Algorithm 2 in section 4, the server constructs a CAT rooted at the end router R0 in Fig. 3(b). The server recursively scans through all upstream routers to construct the tree. The CAT presents a traffic-flow tree pattern rooted at the router connected to the edge network, where the victim is attached. With sufficient exchange of alert information from related domains, the system can detect the DDoS flooding attack at very early launching stage, before the superflows reaching the victim network.
(a) Traffic pattern of a DDoS flooding attack
(b) CAT subtree rooted at router R0
Figure 3. An illustration of change aggregation tree (CAT) constructed at the end router (R0) connected to the victim system. 3.2 Change-Point Detection Principles In change-detection problems, if pre-change and post-change distributions are known, the CUSUM statistic has been suggested to solve the problem [5]. We adopt a non-parametric approach for its simplicity. Let t1, t2, …. , tm be discrete time instants and x(tm, i) be the number of packets received by a router during time slot m at port i. The historical estimate average number of packets X (tm , i ) is defined iteratively by: X (t m , i ) = (1 − α ) ⋅ X (t m−1 , i ) + α ⋅ x(t m , i )
(1)
where 0 < α < 1 is an inertia factor showing the sensitivity of the long-term average behavior to the current traffic variation. Higher α implies more dependence on the current variation. We define below Sin(tm, i) as the deviation of input traffic from the average at time slot tm. Sin (t m , i ) = max{0, Sin (t m−1 , i ) + x(t m , i ) − X (t m , i )}
August 13, 2006
Page 7 of 30
(2)
The subscript in indicates that this is the statistics of the incoming traffic. While a DDoS flooding attack is being launched, the cumulative deviation is noticeably higher than the random fluctuations. Since Sin(tm, i) is sensitive to the changes in the average of the monitored traffic [5], we measure the abnormal deviation from historical average as follows. Let deviation from average (DFA) is the ratio of such an attack indicator. The incoming traffic DFA is defined below at time tm and at port i: DFAin (t m , i ) = Sin (t m , i ) X (t m , i )
(3)
If the DFA exceeds a router threshold β, the measured traffic surge is considered a suspicious attack. The threshold β measures the magnitude of traffic surge over the average traffic value. This parameter is preset based on previous router use experience. In a monitoring window of 100 ms to 1 s, a normal superflow is rather smooth due to statistical multiplexing of all independent flows heading for the same destination [21]. If there is no DDoS attack, we expect a small deviation rate far below β. In section 6, we will discuss the impact on the performance of the CAT detection scheme, when β is chosen between 2 ≤ β ≤ 5. Let τ be the earliest time when a router detects abnormal deviation in traffic volume. This time instant is formally defined below:
τ = min{t m : Sin (tm , i ) / X (tm , i ) ≥ β }
(4)
For outgoing traffic, we define y(tm, i) as the number of packets in time tm leaving at port i and Y (tm , i ) be the historical average number of leaving packets. Similarly, we have: Y (t m , i) = (1 − α ) ⋅ Y (tm−1 , i) + α ⋅ y (t m , i )
(5)
S out (t m , i ) = max{0, S out (t m−1 , i ) + y (t m , i ) − Y (t m , i )}
(6)
All above equations are used to specify the change-detection algorithms in subsequent sections. 3.3 Change Detection at a Single Router
Each router monitors traffic variations and counts the packet number within each monitory window at each I/O port. We use the term traffic pattern to refer to the combination of traffic surges at all I/O ports of a router. In general, a router with m-input ports and n-output ports may encounter 2m+n possible traffic patterns. The height of the black boxes in Fig.4 signifies the magnitude of traffic volume at the relevant I/O links. The raised block height indicates a surge detected and the lower height stands for normal traffic flow.
August 13, 2006
Page 8 of 30
All packets of a superflow must be homing towards the same destination network. Before entering the destination domain, the flow paths present a converging homing-tree pattern. Only at the destination domain, the superflow scatters packets towards a particular edge network specified by the destination IP address. There exist 16 possible traffic patterns fro a 2 х 2 router. For simplicity, we illustrate in Fig.4 only 4 basic traffic patterns at a 2 х 2 router with m = n = 2. The remaining 12 traffic patterns can be specified, similarly. a. Flow-through pattern: This traffic pattern is shown in Fig.4(a). The router forwards the
entire traffic flow from an input port to a selected output port without subdividing or diverting the traffic to other outgoing port. b. Partial aggregation pattern: All the incoming flows are merged at one outgoing port iout,
not all incoming flows contain traffic surges as shown in Fig. 4(b). c. Full aggregation pattern: The outgoing flow merges multiple incoming flows, all containing traffic surges exceeding the threshold β. This router is considered a merge point on the attacking path (Fig.4(c)). d. Scatter pattern: The incoming flow scatters at this router. This pattern is not part of a
DDoS attack (Fig. 4(d)). This pattern is observed only in the destination domain.
(a) Flow through
(b) Partial Aggregation
(c) Full Aggregation
(d) Scatter Pattern
Figure 4. Four basic traffic patterns of traffic changes at a 2 х 2 router I/O ports
Another statistical parameter, deviation ratio (DR), is defined below to measure the ratio of incoming packets from port iin have propagated to output port iout. DR is the ratio of traffic deviations between the input and output ports. DR(iin , iout ) = Sout (tm , iout ) Sin (tm , iin )
August 13, 2006
Page 9 of 30
(7)
If DR > 1, the router amplifies the input deviation. This corresponds to a full surge of traffic volume. DR ≈ 1 implies the router merely plays the role of a forwarder. This phenomenon is observed in the partial surge at one input port. Meanwhile, the case of DR < 1 indicates that the incoming wave is scattered to multiple ports. It is not part of the convergence traffic of DDoS attacks. Therefore, by checking the DR value, a router determines whether the pattern is part of a CAT tree incurred with a DDoS attack. To be more precise, we specify a local detection algorithm for suspicious traffic pattern here. When a router detects that a DFAin exceeds the deviation threshold β, it calculates the deviation rate between the outgoing and incoming ports. If DR is close to one, the traffic aggregation pattern is considered suspicious. The router generates an alert message and reports the pattern to the CAT server. Otherwise, the router sends a regular status message indicating no anomaly observed. Essentially, the DR specifies how much the incoming traffic propagates through the router. This DR measure is directly related to the detection rate. Below is the pseudo code of Algorithm 1 for local change detection at the router level. Algorithm 1: Attack detection at router level Input: x(t, i) and y(t, i): Incoming and outgoing packets at time t and port I, respectively X ( t m − 1 , i ) : Historical average of packet arrivals up to time m-1 at port i
Y ( t m − 1 , i ) : Historical average of outgoing packets up to time m-1 at port I Router detection threshold β based on past experience Output: Alert messages sent to the central CAT server. Procedure: 01: Update historical average of I/O packets in a flow 02: Calculate DFAin using Eq. (3) 03: If DFAin ≥ β Then Calculate DR using Eq. (7) 04: If DR ≈ 1.0 Then Suspicious pattern detected. Send out an alert message to CAT server. 05: Else Nothing suspicious. Send out a regular status message CAT server.
4. Construction of CAT Subtrees at Domain Servers This section describes the details of CAT subtree construction at each CAT server in a single network domain. Different subtrees are generated at different network domains. The global CAT tree is generated by merging all subtrees. While the flooding traffic merges at the victim end, the routers along the paths capture suspicious traffic patterns. In this section, we concentrate the subtree construction in a single network domain. Algorithm 2 specifies the subtree construction at a single domain CAT server.
August 13, 2006
Page 10 of 30
The router also reports the ID of a superflow causing the traffic surge. Besides the number of upstream and downstream routers, the alert message provides the upstream and downstream router IDs. Since all routers are under the same authority and work cooperatively, each router knows their immediate neighbors connected through the ports. The alert message provides information for CAT server to include the routers in the CAT subtree. Table 1 summarizes the information carried in a typical alert message from an attack-transit router. Table 1. Information in an Alert Message Sent from a Router Parameter nd_id fl_id up_num dn_num up_id dn_id Router status
Brief Definition The router ID, The superflow ID Number of upstream nodes Number of downstream nodes node ID of upstream node node ID of downstream node Suspicious attack or normal traffic
Algorithm 2: CAT Subtree Construction in a Single Domain Server Input: Traffic alert messages received from all routers In the same AS domain Output: A data structure describing the CAT subtree constructed in this domain Procedure: 01: Read all suspicious patterns in and arrange them according to router ID 02: Start from the suspicious node with minimum ID Rmin 03: root Å Rmin 04: read the upstream node number up_num 05: read the downstream node number dn_num 06: node_number Å node_number + up_num - 1 07: While up_num > 0 08: Read in one upstream node Rup 09: Add Rup as a leaf node 10: scan through its upstream nodes 11: up_num Å up_num – 1 12: End While 13: While dn_num = 1 14: Read the downstream node Rdn; 15: root Å Rdn 16: node_number Å node_number + 1 17: Scan through other upstream nodes of new root; 18: dn_num Å dn_num of the new root 19: End While
The major purpose of sending the flow status message is to report where the suspicious flows are captured. To indicate the location of a suspicious flow, the router identifier has to be sent. It is also mandatory to identify the superflow identifier of the n-bit prefix of the destination IP addresses. To construct the CAT, the status report provides the upstream and downstream router identifiers instead of router I/O port numbers. Since all routers are under the same ISP
August 13, 2006
Page 11 of 30
authority and work cooperatively, each router knows their immediate neighbors. Using the reported status information, the domain server detects based on the CAT tree constructed. To clarify the control flow, this construction process is specified by a flowchart in Fig. 5. The output of Algorithm 2 is a single-domain CAT subtree similar to the one shown in Fig.3(b). The CAT tree is specified by a hierarchical data structure. The tree starts from the root node, which carries the superflow ID, the number of routers involved, root node ID, and the count of child nodes at the next level. The next level lists the pair of information {L1 node ID, count of children at next level L2}. This process continues until reaching the leave nodes of the tree. The CAT subtree is eventually sent to the CAT server of the destination domain. In Algorithm 2, the domain server constructs the CAT subtree based on collected status reports from the routers. Routers detected no attacks are not involved in the tree construction.
Figure 5. Control flow in constructing the CAT subtree specified in Algorithm 2.
Starting from the node Rmin with a minimum ID in Fig.5, the CAT server takes it as the root node. The server scans through upstream child nodes identified by up_id. This descendent search is performed iteratively until the leaf nodes are reached. If there is a downstream router Rdn, we take router Rdn as the new root and repeat the procedure. Meanwhile, the descendent search procedure is repeated for all upstream routers of root Rdn. Then we check the downstream router of Rdn and repeat the procedure until the downstream router is out of the domain boundary. August 13, 2006
Page 12 of 30
5. Merging CAT Subtrees from Multiple Domains This section describes the extension of the single-domain detection scheme to work on multiple network domains. After presenting the mechanism of cross-domain attack detection, we analyze the complexity of the global CAT tree growth. In addition, we introduce a new protocol that supports inter-domain communications, trust negotiation, and collaborative detection. 5.1 Global CAT Tree Construction at the Victim End
In a DDoS flooding attack, the attacker often recruits many zombies distributed over the Internet. The flooding traffic may travel through multiple AS domains before reaching the edge network, where the victim is physically attached. Routers at the upstream domains observe the suspicious traffic flows earlier than routers at the downstream networks. Our DCP detection system was designed to have strong collaborations among all domain servers along the superflow paths. Algorithm 3 specifies the merge of CAT subtrees for detecting DDoS attacks across multiple network domains. Algorithm 3: Global CAT Tree construction and detection decision CAT subtree description from participating domain servers, the server detection threshold θ. Output: The global CAT tree over multiple AS domains. Raise the alert for an imminent DDoS attack. Procedure: 01: Construct the local CAT sub-tree (Algorithm 2) periodically 02: Receiving sub-trees from other CAT servers 03: If local subtree exists, Then Check the superflow ID, 04: If this domain is the destination domain, Then Set distance r = 1 05: Merge subtrees from domains at distance r to the current global tree 06: r Å r+1 07: While { there are un-checked sub-trees }, generate the CAT profile 08: If CAT profile ≥ θ Then DDoS attack is detected and raise an alert 09: Else Check the root router position 10: If root router is connected to other domain 11: Then Sent the global CAT tree to the destination domain server 12: Else Raise an attack alert based on the global tree merged Input:
The CAT subtrees constructed at all traversed domains must be merged to yield a global CAT tree at the destination domain. The final declaration of a DDoS attack is the result of threshold detection using the global CAT tree. Not only the victim network launches appropriate countermeasures, but also some traceback actions are to be taken by all attack-transit routers along the superflow paths. The actions include dropping of suspicious packets or rate limiting against the flows. The global CAT tree shows the propagation pattern of flooding attack flows. August 13, 2006
Page 13 of 30
The leaf nodes are directly related to the zombies used. The height of the global CAT tree corresponds to the superflow hop count. Some highly distributed attacks may recruit hundreds of zombies, the global CAT tree may cover a wide area on the Internet. Therefore, we use the global CAT tree profile θ as a global detection threshold. The CAT profile indicates how many routers have observed abnormal traffic surges. Thus θ is an integer bounded by the domain size or by the number of ATRs. The tree width and height thus reveal the scope of the DDoS attack. Through experiments on DETER testbed, we obtain the global detection threshold value by training from some attack datasets. Theses threshold values have yielded the highest detection rate and lowest false positive rate during the training period. On receiving subtrees from upstream CAT servers, the CAT server in the destination domain builds the global CAT tree from its local subtree. Once the global CAT tree is formed, the server compares the CAT profile with the global detection threshold θ to decide on a DDoS attack. An alert is raised and necessary countermeasure is triggered, accordingly. Figure 6 shows an example network environment involving 6 AS domains. The victim system is located in the AS1 domain. Zombies are scattered widely in Internet outside the illustrated domains. By detecting abnormal traffic changes in each domain, the CAT server creates a CAT subtree locally at each domain using Algorithm 2.
(a) DCD architecture over 6 domains
(b) Merging 6 subtrees to yield a global CAT tree
Figure 6. An example 6-domain global CAT tree construction environment
Figure 6(b) shows three steps taken to merge the 6 subtrees generated by 6 CAT servers of 6 AS domain. All 6 subtrees are resulted from checking the packets belonging to the same superflow traffic destined for the same domain AS1. Five subtrees generated at AS 2, 3, 4, 5, and August 13, 2006
Page 14 of 30
6 at upstream domains are sent to AS1 at Step 2. Then, the concatenated CAT subtrees are connected to the downstream subtree at AS1. Thus the global CAT tree is finally rooted at the last hop router to an edge network R0 that is attached to the victim system. 5.2 CAT Tree Growth Complexity Analyses
The complexity of the CAT growth is analyzed below based on Internet topology data available from open literature [20], [38]. Figure 7 illustrates the process of the CAT tree growth out of merging subtrees from closer to remote domains. Let r be the logical distance of an AS domain to the destination domain. The server checks the received subtrees in increasing order of distance r. The system merges the subtrees from ASs located in distance r = 1 first to form a partial global tree. Next, it merges the subtrees from domains at distance r = 2. The merging process repeats with distances r = 3, 4, until all subtrees are merged into a large global CAT tree.
Figure 7 Merging CAT subtrees from nearby domains to outer domains to build the global CAT tree, where AS 0 is the victim destination domain
We analyze below the complexity of global CAT tree growth at intra-domain and interdomain levels. The routers monitor traffic conditions and report anomalies to their domain CAT server, periodically. The local setting parameters α and β affect the size of the local CAT subtrees constructed at routers. Given a domain consisting of N routers, the number of alerts that CAT server receives is proportional to N. The passing-threshold CAT subtrees constructed (Algorithm 2) equal to the number of alerts received by the server. Therefore, the detection time is approximated by O(N) within each domain. Of course, different domain sizes (N) may end up with a variable subtree generation times. At the inter-domain level, the complexity of global CAT tree merging is highly dependent on the network topology. We treat the Internet as an undirected graph G of M nodes August 13, 2006
Page 15 of 30
and E edges. The diameter of the graph is denoted as δ. Siganos et al. [38] models the Internet neighborhood as an H-dimensional sphere with a diameter δ. H is the dimension of the network topology [15]. For example, H = 1 for a ring topology and H = 2 for a 2-dimensional mesh. Any two nodes are within the effective diameter, δef hops away from each other. Faloutsos estimated δef by the following expression: δ ef = (
M2 1H ) M + 2E
(8)
As of Feb. 28, 2002, the dimension of Internet was calculated as H = 5.7 in an average sense. The ceiling of this diameter δef is thus set to 6. Let NN(h) be the number of domains located at distance h from a typical domain in the Internet. Table 2 gives the domain distribution – the probability of an AS domain residing exactly h hops away from a reference domain , and the exact number of domains in that distance range. Table 2. Internet Neighborhood Distribution based on Report in August 2006 [20] Hop Count, h
1
2
3
4
5
6
≥7
Domain Distribution, ph
0.04%
8.05%
38.55%
38.12%
12.7%
2.25%
0.29%
Domain Count, NN(h)
14
2,818
13,493
13,342
4,445
788
102
Although the actual number of Internet AS domains keeps increasing with respect to time, the Faloutsos reports [15] and [38], indicated that this AS distribution is pretty stable over time. This implies that a packet can reach almost all domains in the Internet by traversing through 6 hops. Therefore, we set the maximum hop count rmax = 6 in Fig.7. Let ph be the probability of having AS domain located at distance h from the reference point. Therefore, the average number of domains used to build a global CAT tree is upper bounded by: rmax
T = ∑ NN (h) × ph
(9)
h =1
Substituting the entries in Table 2 into Eq.(9), we obtain the expected domain count T = 14×0.004+2818×0.0805+13493×0.3855+13342×0.3812+4445×0.127+788×0.0225+102×0.0029 =11,097 domains used in various Internet applications. This domain count posts a loose upper bound on the expected number of ISP domains involved in building the global CAT tree. In reality, only a handful of the ISP-controlled AS domains may commit to defend DDoS attacks, collaboratively. On the conservative side, consider 5% of ISP AS domains are committed to August 13, 2006
Page 16 of 30
defend DDoS attacks, collectively. Thus the above upper bound could be reduced to only 168 ISP domains, provided that they all conform to the distribution in Table 2. Furthermore, as long as the partially merged CAT tree profile exceeds the detection threshold θ, the decision process can be ended much earlier. Our DETER experimental results (Section 6) suggest that at most 4 to 8 out of 16 domains will suffice to detect TCP SYN and UDP flooding attacks. Based on these 25% to 50% domain involvement, we find, on the average, that the DCP detection system can scale well to cover T×30.3%×5%×(25% to 50%) = 42 to 84 domains in ISP controlled domains. The actual number of AS domains involved could be even fewer, if the whole defense system is built by collaboration among domains controlled by a single ISP or just by a handful of cooperative ISP companies. 5.3 Secure Infrastructure Protocol (SIP)
Inspired by the ICMP protocol, we propose a new secure infrastructure protocol (SIP) that enables secure anomaly detection across multiple domains. The ICMP was used as a measure of error control when a network device or host requires reporting an error in datagram processing [36]. The SIP is designed as an integral part of IPv4 standard. The protocol and message formats can be easily extended to apply the proposed IPv6. SIP protocol supports packet scanning, filtering, and flow analysis functions at the router level in each domain. The protocol has three levels of communication as illustrated in Fig.8.
Figure 8 Three levels of communication in using the SIP (secure infrastructure protocol) between two CAT servers in two autonomous systems.
Three SIP levels support CAT server for trust negotiation and attack analysis. Inside each domain, the routers exchange information and report traffic anomalies detected locally to the domain server. At the inter-domain level, the CAT servers communicate with each other. Besides traffic monitoring, SIP supports many network-layer security functions. For example, the
August 13, 2006
Page 17 of 30
detection and isolation of worms, DDoS attack detection, or offers support to a distributed intrusion detection systems (IDS) [6], [32]. SIP provides a secure information exchanging mechanism in a layer closer to the physical network. SIP is a lightweight protocol that is suitable for supporting Internet infrastructure security, where network-layer collaborations among the routers are desired. In addition of setting different security policies, ISPs may not want competitors to map on their networks. The available bandwidth limits requestor from joining the defense. The SIP addresses issues at the policy level far beyond authentication, authorization, or channel encryption. We adopted the trust negotiation of multilateral security suggested by Ryutov et al. [37]. Using their Gneric Authorization & Access-control (GAA) interface, SIP can help establish trust among AS domains and enter a collaborative DDoS defense system agreement.
6. Performance Results of DETER Experiments We verify the performance of the newly proposed DCP detection scheme with DDoS attack experiments on the 200-node DETER testbed [4], [12] at USC Information Sciences Institute. The experimental setting and performance results are reported below. 6.1 Experimental Setting on DETER testbed
To evaluate the performance of the CAT-based DDoS detection system, we allow variations in network topology, background traffic, and attack generation. We adopt the real-life ISP topologies downloaded from the Rocketfuel Project at University of Washington [2]. We report below the DETER results on up-to-16 collaborative domains. Within each domain, we consider a typical configuration of 7 to 12 routers. Due to the limited nodes in DETER testbed, we choose the smallest ISP configuration topology from the Rocketfuel dataset. For example, 34 routers were simulated over 4 AS domains. The link bandwidth among the network domains was set at 100 MB/s. To generate the background traffic closer to reality, we use the OC48 trace dataset from the CAIDA project [30] to regenerate Internet traces using the Harpoon traffic generator [39]. To generate DDoS attacks, we use the toolkit Stacheldraht V4 [14]. Stacheldraht can generate ICMP and UDP, TCP SYN flooding and Smurf attacks. 6.2 Performance Metrics Used
August 13, 2006
Page 18 of 30
The performance of our DCP detection scheme is evaluated with three metrics: detection rate, false-positive alarms, and system overhead. All metrics are measured under different attacks using TCP, UDP, and ICMP protocols. The detection accuracy is measured in three ways: the detection rate Rd, is defined by: Rd = a / n
(10)
where a is the number of DDoS attacks detected by our DCP system and n is the total number of attacks generated by the toolkit Stacheldraht during experimentation. Now consider the experiments on regular traffic containing no DDoS attacks. Let p be the total number of alerts raised by the CAT server out of m CAT trees constructed for normal traffic without any attacks during one monitory window. The false-positive rate is defined by: Rfp = p / m
(11)
The ROC (receiver operating characteristic) curve shows the tradeoff between the detection rate and false-positive rate. Section 6.4 reports the detection accuracy measured under different detection thresholds. Another critical issue is the time overhead to detect the launch of DDoS attacks. The average detection time τ measures from the start of a DDoS attack to the time to raise the attack alarm. The monitory window should be greater than this detection time. 6.3 DETER Experimental Results
To evaluate the effectiveness of the DCP detection scheme, we report the alerts raised at routers and analyze the CAT subtree properties. The DETER experiments choose the inertia factor α in the range (0.1, 0.5) and the router detection threshold β in the range (2, 5). A. Alert Magnitude vs. Router Threshold used
We reveal the effects of choosing different values of the inertia factor α and router threshold β on the DCP system design. We used 34 routers divided into 4 ASs in the DETER testbed. When the traffic flow exceeds the router threshold β, the router raises the alerts. Otherwise, no alert is raised, if no anomaly is detected at router ports. Figure 9 compares the total numbers of alerts raised by the routers with SYN flooding compared with the cases of no attacks. More alerts are raised with attacks, compared with the cases of no attacks. The two left bars in Fig.9 in each group correspond to heavy-dependence on the past average traffic. Under attacks, the leftmost bars stay around 20 alerts, rather insensitive to
August 13, 2006
Page 19 of 30
increasing threshold β. Without attacks, the second (gray) bars reduce from 12 to 5 alerts as β increases. This implies that β = 3.5 is a good choice to distinguish attacks from no attacks, when α is chosen as low as 0.1. The two right bars (fabric vs. black) are associated with the aggressive choice of a high inertia factor α = 0.3. The fabric bars with attacks are much higher than the black bars without attacks. For α ≥ 0.3 and β ≥ 3.5, the alert bars reduce to zero, meaning attacks and no attacks are no longer distinguishable.
Figure 9. Total alerts raised plotted against the router threshold applied on 34 routers in 4 AS domains using a 500 ms monitory window
B. The Global CAT Profiles
Figure 10 plots the global CAT tree profile in terms of the number of ATRs involved. On the average, there are 20 router nodes (alerts) in the CAT subtree raised by actual attacks, compared with fewer than 5 nodes in the tree triggered by regular traffic without attacks. These results suggest an optimal router threshold β ≥ 3.5, when the inertia ratio α is chosen as low as 0.1. With 20 routers involved out of 34 routers available, the router utilization is 20/34 = 58%.
Figure 10. Variations of the global CAT size over 4 AS domains in 500 ms monitory window
August 13, 2006
Page 20 of 30
C. Effects of Monitory Window Size
We report in Fig.11 the influence of monitoring window size on the total number of alerts raised in 4 AS domains. We find the optimal monitoring window size w to be 100 ms in DETER experiments. Figure 11 shows that 22 alerts are raised with attacks, compared with only 3 alerts (false alarms) from no attacks. The false positive alarms increase steadily with increasing window size. However, the number of 22 raised alerts from real SYN attacks stays about the same level for all window sizes monitored.
Figure 11. The router alerts detected with and without DDoS attacks plotted against the monitoring window size
We study below the detection accuracy of the DCP scheme under TCP SYN, UDP, and ICMP attacks with different packet rates. The reported results correspond to α = 0.1, β = 2.0, and w = 500 ms. In Stacheldraht [14], the UDP and ICMP packet rate for each individual zombie is
adjustable through setting different UDP and ICMP packet sizes. The longer is the packet length, the lower is the packet rate. The TCP SYN attacks use fixed packet size of 64 bytes with a fixed packet rate. The maximum UDP and ICMP packet size is limited to 1024 bytes in Stacheldraht. We observed similar detection rate for TCP SYN and UDP/ICMP attacks with 128-byte packets. 6.4 Detection Accuracy vs. False-Positive Alarms
The accuracy is reflected by having higher detection rate. The False positive alarms should be maintained as low as possible. Tradeoffs exist between these two measures. A. Detection Rate of DDoS Attacks
Figure 12 plots the variances of the detection rate (Eq.7) with respect to different server detection threshold θ applied. The TCP SYN attack has the highest detection rate close to 100%
August 13, 2006
Page 21 of 30
for θ ≤ 12. The low-rate UDP attacks have lower detection rate than that of TCP attacks. For UDP attacks have 512-byte packets, the detection rate can be kept above 80% with θ ≤ 9. As the packet size increases to 1024 bytes, the detection rate drops to zero when θ ≥ 7. These results suggest that in order to maintain high detection rate on TCP and UDP SYN attacks, we need to make θ rather low, such as θ = 5 and maximize the packet size to 1024 bytes.
Figure 12. Effects of server threshold on the detection rate of 3 DDoS attack types. B. False-Positive Alarms
Figure 13 plots the false positive alarm rate against the CAT server threshold θ. The CAT incurred by random fluctuation in normal traffic is much smaller. With a server detection threshold θ = 4, the false positive rate drops to less than 1%. However, the real challenge lies in the fact that highly distributed attacks may use low packet rates to escape from being detected [40]. Only after sufficient attack flows are merged, the deviation is detected by the routers. Hence, a lower threshold is mandatory to make the detection accuracy high with very low false positive rate as revealed in Fig.13.
Figure 13. Effects of threshold on false-positive rate in detecting TCP SYN attacks C. The ROC Curve
The ROC curve shown in Fig.14 reveals the tradeoffs between the detection rate and false positive rate under different attack types. Our DCP detection scheme achieves a detection rate as August 13, 2006
Page 22 of 30
high as 99% with less than 1% of false positive rate for high-rate DDoS attacks. All three curves in Fig.14 support this claimed advantage. Even for low-rate UDP attacks, our choice of low CAT threshold θ maintains a detection rate of 91% at a false-positive rate of 23%. This result proves the effectiveness of the DCP detection system.
Figure 14. ROC curve showing the tradeoff between detection rate and false-positive rate
7. Scalability Analysis and Limitations The complexity of DDoS attack patterns keeps growing as new vulnerabilities and more sophisticated attack tools appear. To deploy a distributed security scheme in ISP core networks, the scalability is often related to the network size, domain number, data rate, link capacity, or router number involved. This section studies the scalability of the DCP scheme in terms of detection performance and system overhead experienced. Then we discuss flash crowd, security holes, and limitations of the DCP system. 7.1 Domain Scalability Analysis
One advantage of cross-domain DDoS attack detection is its enlarged coverage area. For a small AS domain, it is rather difficult to distinguish normal traffic fluctuations from malicious flooding traffic. This is due to inadequate alert information collected locally. We have to use the CAT subtrees constructed by upstream domains to assess the earlier impact of the superflow traffic caused by the DDoS attack. Even before the target network is overwhelmed, an early warning could be raised. Through experiments on DETER testbed, we studied the effectiveness of cross-domain cooperation up to 16 AS domains. Figure 15 plots the detection rates of three DDoS attack types
August 13, 2006
Page 23 of 30
against the number of domains involved. The detection rate becomes saturated after sufficient number of AS domains are involved. The results are obtained under the system settings: α = 0.1, β = 2.0, w = 500 ms, and θ = 5. Recall, we assumes 8 to 10 routers per domain in the DETER experiments. With a small AS domain containing 8 routers, θ = 5 implies that more than half of the routers are generating alerts as attack transits on the superflow path.
Figure 15.
Scalability of the distributed change-point detection system over increasing number of AS domains
For 64-byte TCP SYN and UDP attacks, the optimal domain number is 4. For UDP 512byte packets, the detection rate saturates at 8 domains. For UDP 1024-byte packets, again 4 AS domains would be sufficient. This implies only 25% (4/16) to 50% (8/16) of the participating domains would be sufficient to detect the DDoS attacks. With this proportion, we have assessed in section 5.2 the scalability of the DCP system to cover 42 to 84 ISP-controlled AS domains in fighting the TCP SYN and UDP flooding attacks, collectively. These numbers are manageable in real-life deployment of DCP system, considering the added monitoring burden of the routers and the role of the CAT server employed in each domain. 7.2 Other Options and Implementation Limitations
It is a big challenge to discriminate DDoS attacks from fluctuation of legitimate traffic patterns, called flash events [7], [22]. When flash crowd happens, the CAT server creates a similar tree and could raise a false alarm. We suggest adding a few new features to separate the real DDoS attack traffic from the flash crowd. The idea is to check newly appeared source IP addresses. For each superflow, in addition to traffic volume, we need to monitor the distribution of source IP addresses. More new source IP addresses will appear in DDoS attacks than that in a August 13, 2006
Page 24 of 30
flash crowd [34]. Packet content matching offers another potential solution. However, this option is limited by packet payload being encrypted or not allowed to be examined. Compromised insiders are often the most difficult problem to solve in security control. Infected routers may hide suspicious traffic patterns or send false alarms to the CAT server. These false alarms can weaken the use of the CAT tree as a means of attack detection. Our detection scheme is deployed in ISP core networks. We can make it more robust by introducing a topology verification procedure. Knowing the network topology, the CAT server is capable of rectifying the falsely reported traffic patterns according to the upstream and downstream relationship. Single or limited number of Byzantine defectors could be blocked this way. As discussed in Section 5, the CAT server in the destination domain need to merge all received CAT subtrees for the purpose of global detection. The global CAT tree actually provides useful information for traceback or pushback. In the literature, packet marking offers another option to trace the path of attack flows [1], [19], [43] and [48]. The victim launches traceback or pushback operations only after DDoS attack is fully detected. In contrast, our DCP system finishes the traceback task as soon as the merged CAT tree becomes sufficiently large. Our system pushes the defense line to upstream domains, where traffic surges are first observed. The analysis on average Internet topology suggests to use at most 84 domains to cope with TCP SYN and UDP flooding attacks. These correspond to the saturated detection rate (98%) and low false alarm rate (below 1%). If we lower to 65% detection rate with and higher false alarms (say 15%), the server detection threshold (θ) can be further lowered. This implies that fewer AS domains could make the global decisions. Based on DETER experiments, we feel that it would be sufficient to involve only 28 ISP domains in detecting DDoS flooding attacks.
8. Conclusions and Further Research It is critical to detect the DDoS flooding attacks at their early stage before damage done to legitimate applications. This paper developed an early DDoS detection scheme based on the new CAT mechanism. Our major contributions are summarized in 4 technical impact aspects: A. Detect changes at attack-transit routers: Based on the anomaly pattern detected in related network domains, our scheme detects a DDoS flooding attack before the victim is
August 13, 2006
Page 25 of 30
overwhelmed. This approach captures the abrupt traffic changes at attack-transit routers. The high detection rate of DDoS attacks was achieved with very low false positive rate. B. Scalable Performance over Multiple ISP Domains: Our DCP detection scheme is suitable for deployment at the ISP core networks. The provider-level cooperation can eliminate the need of intervention by edge networks. Our FETER experimental results prove that 4 to 8 domains are sufficient to yield 98% detection rate of TCP SYN and UDP flooding attacks. Based on recent Internet AS domain distribution and the DETER domain coverage, we conclude through an averaging analysis that the DCP scheme scales well to cover up to 84 ISP-controlled network domains in real-life Internet environments. C. A New SIP Protocol for Trust Negotiation among AS Domains: To support inter-AS collaboration, the SIP protocol is proposed to resolve policy conflicts and regulate alert message format. Our SIP protocol is part of USC/ISI effort in securing Internet infrastructure against DDoS or worm attacks [10], [37] that threaten the availability, reliability, and dependability of Internet services. D. Valuable Design Parameters from Intensive DETER Experiments: We have verified the effectiveness of the DCP scheme through intensive experiments on the DETER testbed. The engineering data on the inertia factor α, router threshold β, global detection threshold θ, and monitory window size w are very useful design parameters for building future DCP prototype or production systems against DDoS attacks in real-life Internet environments. Our distributed detection scheme automatically performs the traceback during the detection of suspicious traffic flows. Once a DDoS flooding attack is detected, we know the exact router or network domain that the anomaly was observed. In our ongoing efforts, we are developing efficient flow-level filtering techniques to protect legitimate flows. In particular, we use spectral analysis [10] to filter out shrew DDoS attacks. Considering the high data rate in ISP core networks, it is desired to push the security functions down to a lower packet-processing layer. For this purpose, we suggest hardware approaches to implementing the CAT mechanism and the SIP protocol using network processors or reconfigurable FPGA devices. This may demand the integration of signature-based IDS with
August 13, 2006
Page 26 of 30
anomaly detection systems [6]. The ultimate goal is to promote real-time detection and response against DDoS attacks with automatic signature generation. Acknowledgements: This work was supported by NSF ITR Grant ACI-0325409 at USC Internet
and Grid Research Laboratory. We gratefully thank Mr. Kevin Leahy and our colleagues at the USC Information Science Institute for their cooperation to carry out the large-scale experiments on the DETER testbed. We appreciate the valuable suggestions from our GridSec team members.
References [1]
H. Aljifri, “IP Traceback: A New Denial-of- Service Deterrent,” IEEE Security and Privacy Magazine, May/June 2003, pp. 24-31.
[2]
T. Anderson, R. Mahajan, N. Spring, and D. Wetherall, “Rocketfuel: An ISP Topology Mapping Engine,” http://www.cs.washington.edu/research/ networking/rocketfuel/, 2006.
[3]
S. Bellovin, J. Schiller, and C. Kaufman, “Security Mechanism for the Internet”, Network Working Group, RFC 3631, IETF, 2003.
[4]
T. Benzel, B. Braden, D. Kim, C. Neuman, A. Joseph, K. Sklower, R. Ostrenga, and S. Schwab, “Experience with DETER: A Testbed for Security Research”, Second IEEE Conf. on Testbeds and Research Infrastructures for the Development of Networks and Communities (TridentCom2006).
[5]
R. Blazek, H. Kim, B. Rozovskii, and A. Tartakovsky, “A Novel Approach to Detection of DoS Attacks via Adaptive Sequential and Batch-sequential Change-Point Detection Methods,” Proc. of IEEE Workshop on Information Assurance and Security, June 2001.
[6]
M. Cai, K. Hwang and Y. Chen, “Integrating Misuse and Anomaly-based Intrusion Detection Systems with Weighted Signature Generation”, IEEE Trans. On Dependable and Secure Computing, revised Sept. 2005.
[7]
G. Carl, G. Kesidis, R. Brooks, and S. Rai, “Denial-of-Service Attack Detection Techniques,” IEEE Internet Computing, January/February 2006.
[8]
A. Chakrabarti and G. Manimaran, “Internet Infrastructure Security: A Taxonomy”, IEEE Network, November 2002.
[9]
S. Chen and Q. Song, “Perimeter-Based Defense against High Bandwidth DDoS Attacks,” IEEE Trans. on Parallel and Distributed Systems, Vol. 16, No. 6, June 2005.
[10] Y. Chen and K. Hwang, "Collaborative Detection and Filtering of Shrew DDoS Attacks
using Spectral Analysis," Journal of Parallel and Distributed Computing, Special Issue on Security in Grids and Distributed Systems, 2006.
August 13, 2006
Page 27 of 30
[11] Y. Chen and K. Hwang, “Collaborative Change Detection of DDoS Attacks on
Community and ISP Networks”, IEEE International Symposium on Collaborative Technologies and Systems (CTS 2006), Las Vegas, May 15-17, 2006. [12] DETER and EMIST Network Project, “Cyber Defense Technology Networking and
Evaluation,” Communications of the ACM, Vol.47 (2004), No.3. [13] X. Dimitropoulos, D. Krioukov, G. Riley, and K. Claffy, "Revealing the Autonomous
System Taxonomy: The Machine Learning Approach," the Passive and Active Measurement (PAM) Workshop in 2006. [14] D. Dittrich, “The ‘Stacheldraft’ Distributed Denial of Service Attack Tool,”
http://staff.washington. edu/dittrich/, 2000. [15] M. Faloutsos, C. Faloutsos, and P. Faloutsos, "On Power-law Relationships of the Internet
Topology," Proc. of ACM SIGCOMM, Aug. 1999. [16] V. Fuller, T. Li, J. Yu, and K. Varadhan, “Classless Inter-Domain Routing (CIDR): an
Address Assignment and Aggregation Strategy,” Network Working Group, RFC 1519, IETF, 1993. [17] T. Gil and M. Poletto, “MULTOPS: a Data-Structure for Bandwidth Attack Detection,” in
Proceedings of 10th USENIX Security Symposium, August 2001. [18] K. Houle, G. Weaver, N. Long, and R. Thomas, "Trends in Denial of Service Attack
Technology", 2001, www.cert.org/archive/pdf/. [19] J. Ioannidis and S. M. Bellovin, “Implementing Pushback: Router-Based Defense Against
DDoS Attacks,” Network and Distributed System Security Symposium (NDSS), San Diego, California, Feb. 6-8, 2002. [20] ISO 3166 Report,”AS Resource Allocations”, 2006, http://bgp.potaroo.net/iso3166/ascc.html [21] H. Jiang and C. Dovrolis, “Why is The Internet Traffic Bursty in Short Time Scales?”
SIGMETRICS’05, June 6-10, 2005, Banff, Alberta, Canada. [22] J. Jung, B. Krishnamurthy, and M. Rabinovich, “Flash Crowds and Denial-of-Service
Attacks: Characterization and Implications for CDNs and Web Sites,” Proceedings of Int’l World Wide Web Conference, ACM Press, 2002. [23] S. Kandula, D. Katabi, M. Jacob, and A. Berger, "Botz-4-Sale: Surviving Organized DDoS
Attacks That Mimic Flash Crowds", 2nd Symposium on Networked Systems Design and Implementation (NSDI), Boston, MA, May 2005. [24] Y. Kim, W. C. Lau, M. C. Chuah, and H. J. Chao, “PacketScore: Statistics-Based Overload
Control Against Distributed Denial of-Service Attacks,” Proc. INFOCOM 2004. [25] T.K.T. Law, J.C.S. Lui, and D.K.Y. Yau, "You can run, but you can't hide: an effective
statistical methodology to trace back DDoS attackers," IEEE Trans. on Parallel and Distributed Systems, Vol. 16, no. 9, Sept. 2005.
August 13, 2006
Page 28 of 30
[26] J. Lemon, “Resisting SYN Flooding DoS Attacks with a SYN Cache”, Proceedings of
USENIX BSDConf 2002, February, 2002. [27] R. Mahajan, S. Bellovin, S. Floyd, J. Ioannidis, V. Paxson, and S. Shenker, "Controlling
High Bandwidth Aggregates in the Network," Computer Comm. Review, July 2002. [28] J. Mirkovic, M. Robinson, P. Reiher, and G. Kuenning, “Alliance Formation for DDoS
Defense,” Proc. of the New Security Paradigms Workshop, ACM SIGSAC, August 2003. [29] J. Mirkovic and P. Reiher, "D-WARD: A Source-End Defense Against Flooding DoS
Attacks," IEEE Trans. on Dependable and Secure Computing, July 2005, pp. 216-232. [30] T. Monk and K. Claffy, “Cooperation in Internet Data Acquisition and Analysis,”
Coordination and Administration of the Internet Workshop, Cambridge, MA., Sept. 8-10, 1996, (CAIDA Project), http://www.caida.org/. [31] D. Moore, G. Voelker, and S. Savage, “Inferring Internet Denial-of-Service Activity,”
Proc. of the 10th USENIX Security Symposium, 2001. [32] P. Ning, S. Jajodia, and X. S. Wang, “Abstraction-based Intrusion Detection in Distributed
Environment”, ACM Trans. On Information and System Security, Nov. 2001, pp. 407-452. [33] C. Papadopoulos, R. Lindell, J. Mehringer, A. Hussain, R. Govindan, "COSSACK:
Coordinated Suppression of Simultaneous Attacks," Proc. of DISCEX III, 2003, pp. 2—13. [34] K. Park and H. Lee, “On the Effectiveness of Route-Based Packet Filtering for Distributed
DoS Attack Prevention in Power-Law Internet,” Proc. ACM SIGCOMM 2001. [35] T. Peng, C. Leckie, and K. Ramamohanarao, "Detecting Distributed Denial of Service
Attacks by Sharing Distributed Beliefs," The Eighth Australasian Conference on Information Security and Privacy (ACISP 2003), Wollongong, Australia, July 9-11, 2003. [36] J. Postel, “Internet Control Message Protocol,” Network Working Group RFC 792, 1981. [37] T. Ryutov, L. Zhou, C. Neuman, T. Leithead, and K. E. Seamons, "Adaptive Trust
Negotiation and Access Control," ACM Symposium on Access Control Models and Technologies (SACMAT'05), Stockholm, Sweden, June 1-3, 2005. [38] G. Siganos, M. Faloutsos, P. Faloutsos, and C. Faloutsos, "Power-Laws and the AS-level
Internet Topology", ACM/IEEE Trans. on Networking, pp. 514-524, Aug. 2003. [39] J. Sommers and P. Barford, “Self-Configuring Network Traffic Generation,” in Proc. of
ACM Internet Measurement Conference, Taormina, Sicily, Italy, Oct. 25-27, 2004. [40] A. Soule, K. Salamatian, and N. Taft, “Combining Filtering and Statistical Methods for
Anomaly Detection,” in Proc. of ACM Internet Measurement Conf., Berkeley, Oct. 2005. [41] S. M. Specht and R. B. Lee, “Distributed Denial of Service: Taxonomies of Attacks, Tools
and Countermeasures,” Proc. of Parallel and Dist. Comp. Systems , S. F., Sept. 2004. [42] C. Schuba, I. Krsul, M. Kuhn, G. Spafford, A. Sundaram, and D. Zamboni, “Analysis of a
denial of service attack on TCP,” Proc. of IEEE Symp. on Security and Privacy, May 1997.
August 13, 2006
Page 29 of 30
[43] M. Sung and J. Xu, “IP Traceback-Based Intelligent Packet Filtering: A Novel Technique
for Defending Against Internet DDoS Attacks,” IEEE Trans. Parallel and Distributed Systems, vol. 14, no. 9, Sept. 2003. [44] M. Walfish, M. Vutukuru, H. Balakrishnan, D. Karger, and S. Shenker "DDoS Defense by
Offense," ACM SIGCOMM 2006, Pisa, Italy, September 2006. [45] H. Wang and K. G. Shin, “Transport-Aware IP Routers: A Built-In Protection Mechanism
to Counter DDoS Attacks,” IEEE Trans. Parallel and Dist. Systems, Sept. 2003. [46] H. Wang, D. Zhang, and K. Shin, “Change-Point Monitoring for the Detection of DoS
Attacks,” IEEE Trans. on Dependable and Secure Computing, Vol. 1, Oct.-Dec., 2004. [47] X. Wang, S. Chellappan, P. Boyer, and D. Xuan, “On the Effectiveness of Secure Overlay
Forwarding Systems under Intelligent Distributed DoS Attacks,” IEEE Trans. on Parallel and Distributed Systems, Vol. 17, July 2006. [48] A. Yaar, A. Perrig, and D. Song, "FIT: Fast Internet Traceback," INFOCOM 2005, Miami,
Florida, March 13-17, 2005.
Biographical Sketches Yu Chen is a Ph.D. candidate in Computer Engineering at University of Southern California
(USC) and works at the Internet and Grid Research Laboratory. His research interest includes Internet infrastructure security, DDoS attack detection and defense, Internet traffic analysis and distributed security infrastructure. He is a student member of IEEE and SPIE. He can be reached at
[email protected]. Kai Hwang is a Professor of Electrical Engineering and Computer Science and Director of Internet and Grid Research Laboratory at the University of Southern California. He received the Ph.D. from the University of California, Berkeley. An IEEE Fellow, he specializes in computer architecture, parallel processing, Internet and wireless security, and Grid and P2P computing. Presently, his group at USC develops security-binding techniques and self-defense systems against system intrusions, malicious peers, network worms, and DDoS attacks in large-scale Grid and P2P applications. Dr. Hwang can be reached at USC via Email:
[email protected] or
through the URL: http://GridSec.usc.edu/ Hwang.html. Wei-Shinn Ku is a PhD candidate in Computer Science Department at the University of Southern California. His research interests include spatial/temporal data management, geographical information systems, network security, and peer-to-peer systems. He is a student member of the ACM and the IEEE. Contact him at
[email protected].
August 13, 2006
Page 30 of 30