saturation deficit and m is a shape parameter (note that T-t = K0m). .... Ettercon3 and an individual recession segment was defined as a period of at least 21 days.
HydroGIS 96: Application of Geographic Information Systems in Hydrology and Water Resources Management (Proceedings of the Vienna Conference, April 1996). IAHS Publ. no. 235, 1996.
157
Distributed parameterization of a large scale water balance model for an Australian forested region
FRED G. R. WATSON Department of Civil and Environmental Engineering, Cooperative Research Centre for Catchment Hydrology, University of Melbourne, Parkville, Victoria 3052, Australia
ROBERT A. VERTESSY CSIRO Division of Water Resources, Cooperative Research Centre for Catchment Hydrology, GPO Box 1666, Canberra, Australian Capital Territory 2601, Australia
LAWRENCE E. BAND Department of Geography, University of Toronto, Toronto, Ontario MSS 1A1, Canada
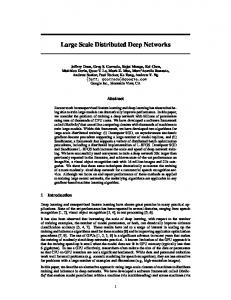
Abstract The parameterization of a large-scale hydrological model (RHESSys) for a forested region is described. Using the GRASS GIS, a range of topographic, vegetative, climatic, and edaphic parameters were mapped over the region. A regional DEM was validated by ground-truthing and shown to give an excessively smooth representation of the terrain which influences moisture distribution predictions. LAI was mapped by regressing shade-corrected satellite imagery against ground-based measurements and applying the regression equations to the imagery. Precipitation was mapped using both elevation lapse rates and a more data-intensive 3D spline interpolation, the latter proving more appropriate. Areal estimates of soil properties were made through inverse determination from baseflow analysis but a regional distribution was not performed. These diverse improvements to previous parameterization techniques are discussed with respect to their likely effect on RHESSys operation. INTRODUCTION A regional-scale, distributed-parameter, hydrological modelling study is under way in the forested central highlands of Victoria, Australia (Fig. 1). The study aims to model water yield from five, large, forested basins (total area 161 km2) and, in so doing, to explain the hydrological processes and external influences controlling water yield. A strong relationship is observed between water yield and forest age, which can be explained by high transpiration in regrowth forests. Evapotranspiration is controlled in part by soil moisture and leaf area so the heterogeneity of these variables is of key interest. Topography is also investigated as control of évapotranspiration (through radiation) as well as saturation excess surface runoff. Precipitation is the input to the water cycle so accurate mapping of its distribution is of paramount importance.
Fred. G. R. Watson et al.
158
• 1244 m
Fig. 1 Location and elevation of the Maroondah region in southeastern Australia showing the five main water supply basins and one of the 17 experimental basins: Ettercon3.
THE MODEL The North American modelling system, RHESSys (Band et al., 1993), is used to predict water yield and understand the processes by which it occurs. RHESSYs operates in conjunction with the GRASS GIS (V. 4.1) and is a combination of previously developed models of hillslope hydrology, canopy hydrology and climate - TOPMODEL, FOREST-BGC, and MT-CLIM (Beven et al., 1994; Running & Coughlan, 1988; Running et al, 1987). RHESSys models hydrologically self-similar areas, defined according to a topography-soil index (1ST) as shown in equation (1): TSI=ln(aTe/(Ti tan (3))
(1)
where a is the up slope area per unit contour length (m), j3 is the slope gradient, Tt is the local soil transmissivity (m2 day"1) and Te is a measure of the mean value of Tv If transmissivity is assumed to be homogeneous, we are left with an index of topography alone. Lateral subsurface flow is modelled implicitly according to a distribution function based on the assumption that the saturated hydraulic conductivity of the soil declines exponentially with soil saturation deficit:
Distributed parameterization of a large scale Australian water balance model
K = Z 0 exp(-5/m)
159
(2)
where K0 is the saturated hydraulic conductivity at the soil surface, S is the local saturation deficit and m is a shape parameter (note that T-t = K0m). The distribution of hillslope saturated moisture can then be given as: S = S' + m(\ - TSI)
(3)
where S" is the mean hillslope saturation deficit and X is the mean value of the TSI assuming spatially constant transmissivity. The required parameters for RHESSys are leaf area index (LAI), root zone water capacity, m from equations (2) and (3), K0 from equation (2), elevation, slope and aspect. The required climatic inputs are daily precipitation and temperature (max. and min.) at a base station. TOPOGRAPHIC INPUTS Elevation, slope and aspect were estimated as a 25 X 25 m gridded DEM (Fig. 1) fitted as a spline surface from 1:25 000 digital contour data. The contour data were constructed from air-photo interpretation (API). The API DEM exhibited an excessively smooth representation of valley bottoms which was thought to significantly influence the prediction of wetted areas using equation (2). A ground-truthing exercise was undertaken to investigate the quality of the DEM and its effect on valley bottom smoothing. A detailed topographic survey of a small basin (Ettercon 3, 15 ha, Fig. 1) was made. Approximately 700 topographic points were surveyed and 25 m and 12.5 m DEMs were fitted to the data. The extent of valley smoothing was assessed by taking sections across the basin from each DEM (Fig. 2). The two ground-surveyed DEMs present very similar cross-sections indicating that basins of this size are equally well represented by 25 and 12.5 m DEMs. The API DEM however, describes a significantly smoother cross-section. Representa820
-25 m API DEM — 25 m ground survey DEM - - 12.5 m ground survey DEM
810
//
800
UJ 780 770 - • 760 375500
375750
376000
Easting (m) Fig. 2 Exaggerated cross-sections through three DEMs for the Ettercon3 experimental basin.
160
Fred. G. R. Watson et al.
tion of forested basin topography at this scale using a DEM derived from air-photo interpretation is clearly not ideal. The effect of valley smoothing on model behaviour was studied using a comparison between distributions of the ln( ÎS 0.4
e 5
0.2
0.0
10
16
In(a / tan p ) 1.0