IEEE TRANSACTIONS ON POWER SYSTEMS, VOL. 21, NO. 3, AUGUST 2006
1029
Distribution System Temperature Adaptive Load Transfer Using Colored Petri Net Approach Ying-Chun Chuang, Yu-Lung Ke, Senior Member, IEEE, Chao-Shun Chen, Member, IEEE, and Yuan-Lin Chen
Abstract—This paper derives appropriate decisions for load transfer among distribution feeders by switching operations to improve system operating performance by combining the load characteristics and the variations among customers as a result of temperature increases using a switching operation decision inference mechanism based on a colored Petri net (CPN) approach. A practical distribution system with 19 feeders, daily load profiles, and corresponding data on temperature sensitivity (TS) is used to perform computer simulations to demonstrate the effectiveness of the proposed methodology. It is concluded that the proposed CPN inference mechanism can enhance the system operating performance with the proper switching operation by considering the TS of customer power consumption served in each service zone of distribution feeders. Index Terms—Colored Petri net (CPN), feeder reconfiguration, load balance, load transfer, service restoration, switching operation, temperature sensitivity.
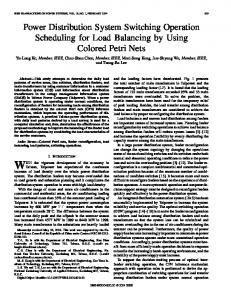
I. INTRODUCTION HE increasing power consumption and peak load demand in Taiwan following a steady increase in national earnings and ongoing improvements in national living has caused the spinning reserve of Taiwan power system to fall below a reasonable operating level, as indicated in Fig. 1. The distribution feeders and main transformers that serve commercial and residential customers in urban areas commonly become overloaded in the intensive hot summer because the load on the Taiwan Power Company (Taipower) system increases sharply as air conditioners are extensively used. Load surveys by Taipower have indicated that the system peak load demand has grown substantially due to increasing use in air conditioners in recent years and will be increased by 600 MW for per Celsius temperature rise when temperature is over 28 degrees. Air conditioners contributed over 35% of the system peak load demand, and the difference between the system peak and off-peak loading in the summer rose from 4577 MW in 1989 to 9443 MW in 2000. With the environment concern of electromagnetic interference (EMI), it becomes more difficult to increase service capacity of main transformers. For this reason, distribution substations in urban areas are frequently overloaded, and the interruptible load
T
Manuscript received April 6, 2005; revised December 28, 2005. Paper no. TPWRS-00194-2005. Y.-C. Chuang and Y.-L. Ke are with the Department of Electrical Engineering, Kun Shan University, Tainan, Taiwan, R.O.C. (e-mail:
[email protected];
[email protected]). C.-S. Chen is with the Department of Electrical Engineering, National Sun Yat-Sen University, Kaohsiung, Taiwan, R.O.C. (e-mail:
[email protected]). Y.-L. Chen is with the Institute of Electro-Mechanical Engineering, MingChi University of Technology, Taipei, Taiwan, R.O.C. Digital Object Identifier 10.1109/TPWRS.2006.879309
Fig. 1. Load data of Taipower system.
control program has to be implemented to reduce system peak load demand and prevent possible generation shortages. With the dramatical increase of system peak load in Taipower during summer, the system power consumption reached 27 120 MW on June 25, 2002, and the peak load spinning reserve has been reduced to 3.5%. Several mobile transformers have to be used to provide extra substation capacity, which causes the difficulty of system operation for Taipower distribution engineers. To resolve the problem, Taipower has made significant effort to prevent the overloading of main transformers by implementing feeder reconfiguration to achieve load transfer among distribution feeders and main transformers. To further enhance system operation, Taipower has launched integrated distribution automation system (DAS) projects since 1998 to solve the above problem and improve the operating performance of the distribution system. Several functions have been included in the DAS system, which include supervisory control and data acquisition (SCADA), fault detection, isolation, and restoration (FDIR), capacitor bank control (CBC), optimal feeder reconfiguration (OFR), transformer load survey, automatic meter reading, protection coordination, optimal capacitor placement, data archiving, distribution load flow, short circuit analysis, dispatcher training simulation, outage schedule, trouble call analysis, and load management. To improve service reliability, the FDIR is performed to restore the unfaulted but out-of-service areas rapidly by executing the appropriate switching operation. Losses after balancing the loads of the feeders and main transformers are minimized by reconfiguring the network according to the OFR [1]–[7]. The current flows of the distribution feeders and loading of the line switches are recorded by feeder terminal units (FTUs) in the SCADA system. When a fault occurs on the distribution feeder,
0885-8950/$20.00 © 2006 IEEE
1030
only the overcurrent relays of the upstream FTUs are activated, and the faulted section is thus identified according to the relay status. Switching operation is determined by considering the practical current flows of the line switches and the loading levels of the distribution feeders and main transformers over the study period. Many of Taipower’s feeders and main transformers are loaded near their rated capacities during the summer peak period. When a single fault occurs, the switching operation for solving the problem of the contingency may introduce a further overloading problem due to the load being transferred following service restoration. The essential reconfiguration of distribution systems is performed by changing the open/close status of the line switches and open tie switches under normal operating conditions based upon the capacities of the distribution feeders and the main transformers to achieve loading balance and loss minimization of distribution systems. Reconfiguring the system network permits the line sections to be transferred from one feeder to another feeder to increase service reliability of customers in case of emergencies that affect the distribution system [8]–[10]. Consequently, the feeder reconfiguration procedure can be used as a real-time control or a planning mode to adjust the structure of distribution feeders with time change [9], and this allows distribution engineers to determine interfeeder switching for long-term plans and short-term contingencies. The short-term switching operation is applied to restore the contingency system to a normal or safe state by preventing the distribution feeders from being overloaded or three-phase unbalance. On the other hand, long-term planning of switching operations minimizes the system losses and improves the system reliability with the system demand increases [5]. The feeder reconfiguration is a complicated combinatorial and constrained optimization problem because of the enormous number of potential switching combinations involved. Hence, reconfiguring the distribution network based only on the experience of distribution operators is very difficult. A more systematic operation and computer decision support strategy should be implemented to solve the problem and effectively to obtain the operating strategy of distribution systems. This paper develops the proper operating strategy for distribution operators to perform the verification before execution by including the utility operating regulations. Since the load density in urban areas increases with the system load demand, an effective computer tool is required to help the operators to make correct and quick decisions regarding the interfeeder switching operations when a contingency situation arises in the distribution system. In this paper, the inference mechanism based on the colored Petri net (CPN) approach by including knowledge of operating rules is applied to determine suitable combinations of switching operations for transferring loads among distribution feeders under normal operating conditions so that the out-of-service areas can be minimized by integrating the daily load profiles. The daily load profile and the effects of temperature change to the loading of each distribution feeder in the studied distribution system can be determined from the typical load profiles of various customers using the outage management information system (OMIS), the customer information system (CIS), and corre-
IEEE TRANSACTIONS ON POWER SYSTEMS, VOL. 21, NO. 3, AUGUST 2006
Fig. 2. Typical load patterns of various customers in the summer.
sponding temperature sensitivity (TS) of customer loading. The inference mechanism based on the CPN method considers the rules of system operation, which applies the parallel-like inference characteristics, to identify the combinations of switching operations to solve simultaneously the problems of overload and multicontingencies. CPN is a powerful graphical modeling method and has been successfully used in scheduling restoration activity [11]; fault section estimation [12]; rule-based evaluation [13]; and protecting the power system [14]. In this paper, the inference mechanism for switching operation decision by combining the CPN with utility operation rules is used to achieve the appropriate feeder reconfiguration for transferring loads among distribution feeders and main transformers. To improve the operating performance of distribution systems more effectively, the customer load characteristics and load variation due to TS are included in the simulations. The CPN approach performs very efficiently because of its parallel-like inference capability to determine the appropriate switching operations for solving the contingencies of distribution operations. II. LOAD STUDY A load survey investigation is undertaken to determine the typical load patterns of residential, industrial, and commercial customer classes and provide useful information to be used in operating and planning a power system. Fig. 2 shows the typical load patterns of various classes of customers of Taipower. All of the customers served by the studied distribution feeder and the main transformer are identified, and their monthly power consumption is extracted from Taipower’s CIS. The power consumed by the sample test customers is considered with the weather information to determine the sensitivity to temperature of hourly power consumption for each class of customers. The hourly loading of each service zone and its variation due to increases in temperature are obtained according to the power consumed by the customers and related sensitivity to temperature. With the weather of high temperature and high humidity, the temperature in Taipei City reached 37.8 degrees Celsius on July 14, 2003. With such a high temperature, the system peak power demand increases dramatically due to air conditioner loading in the commercial and residential customer sections. For year
CHUANG et al.: DISTRIBUTION SYSTEM TEMPERATURE ADAPTIVE LOAD TRANSFER
1031
Fig. 4. Typical data on TS for various classes of customers.
Fig. 3. Power consumption of a test residential customer against temperature.
2003, the system peak load demand is 28 350 MW, and the system net supply capability is 30 380 MW at the same time. The system spinning reserve is 2650 MW or 9.4 %, which is much less than the amount required maintaining service reliability. For Taipower system, the tripping of a single generator with 1000-MW capacity will not cause the system to be unstable; however, the loss of Taichung thermal plant with 4000 MW, which represents more than 15% of generation system total load during off peak period, does result in the system being unstable. The load profile in the distribution system is determined by the load characteristics of customers served within the service territory. According to the load survey study in Taipower, the daily and seasonal load patterns of residential, commercial, and industrial customers are quite different. Load profiles vary from distribution feeder to feeder due to the load composition of different customer classes. Therefore, feeders can be reconfigured to transfer load, reduce losses, and improve the utilization of distribution system capacity due to diversified load profiles of customers served in the distribution system [15]. III. TEMPERATURE SENSITIVITY ANALYSIS The increase in power consumption with temperature varies significantly among classes of customers, according to the TS analysis. The power consumed by a particular class of customer can be represented as a polynomial function of temperature, determined by regression analysis. The increase in power consumed by each service customer class during each hour is determined from TS and daily load. A plot of actual power consumption against temperature for commercial, residential, and industrial customers reveals that the power consumption increases quadratically with temperature. The TS analysis explicates the increase in power consumed by different customer classes with temperature. The increase in the power consumed by each service class during a studied daytime period is determined from the TS and the daily load composition. Fig. 3 plots the normalized power consumption of residential customers in southern Taiwan. The power consumption increases quadratically with temperature, and the proposed corresponding regression model, obtained by statistical regression
analysis [16], [17], is a quadratic function of temperature, as indicated in the following:
(1) is the normalized power consumption, is the norwhere malized temperature, and , , and are coefficients of the regression model. The TS of power consumption for each customer class is obtained as in (2) by differentiating the load models in (1) with respect to the temperature (3) specifies the increase in power consumed with each 1 temperature rise (2) (3) It is found that the power demand of commercial customers temperature rise because of will be increased by 2% for 1 high percentage of air conditioner loading used. On the other hand, there is a much less significant increase of power demands for industrial customers when temperature rises. Fig. 4 plots the sensitivity to temperature of power consumed by various classes of customers during the daytime period in the summer. The typical load patterns and the corresponding TS of power consumption of each type of customers are derived by statistics analysis for load survey studies. The TS will be updated on a yearly basis according to the load survey performed. The stochastic loading change of each specific customer is not considered in this paper. According to the hourly TS of each type of customer and temperature forecasting by the weather bureau, the future loading demands of all service zones are estimated to support the derivation of switching operation for temperature adaptive load transfer. IV. COLORED PETRI NET AND INFERENCE MECHANISM FOR SWITCHING OPERATIONS [18]–[21] A. Colored Petri Net (CPN) A CPN is a bipartite directed multigraph with a sextuple , where structure with
1032
IEEE TRANSACTIONS ON POWER SYSTEMS, VOL. 21, NO. 3, AUGUST 2006
finite non-empty set of place nodes; finite non-empty set of transition nodes. and are disjoint; that is, and ; finite set of types called color sets, which determine the operations and functions to be used in the net inscription; transfer function of input token color, which transmits information between the colors of place nodes and colors of transition nodes; transfer function of output token color, which transmits information between the colors of place nodes and colors of transition nodes; initial marking.
Fig. 5. The proposed colored Petri net model for switching operations. TABLE I THE RELATIONSHIP BETWEEN INPUT PLACE NODES AND OUTPUT PLACE NODES FOR EACH TRANSITION ACTION
B. Enabled Transition Node A place node is an input place node of a transition node and is represented by ; is an output place and is represented by node of a transition node . In a CPN, each token color can carry complex informais enabled with respect to color for tion. Transition node the marking , if and only if the number of tokens in all the of transition node is not less than the input place node by the input function of the directed arc number of colors that connects place node to transition node . Equation (4) [18]–[21] specifies the enabling rule of a transition node in a CPN (4) C. Firing of an Enabled Transition Node , An enabled transition node , with respect to a color can be fired. The new marking is obtained after the firing of transition node with respect to the color . This new marking is obtained from the current marking by the following relationship [18]–[21]: if if if otherwise. V. INFERENCE IN A COLORED PETRI NET (CPN) The CPN views a system by describing the state transition of systems in term of place nodes to represent conditions and transition nodes to represent events or activities. If all of the input place nodes of a transition node get required token colors, the transition node is then enabled. If the guard function of the enabled transition node is evaluated to take action, then the transition node is activated or fired. The activated transition node
can execute its function, and the token colors of the input place nodes and the output place nodes of the fired transition node are modified. Several tokens may be present, and several transition nodes may be activated simultaneously in a CPN. Consequently, passing of tokens can be processed along many paths simultaneously to achieve the parallel-like inference characteristic. In practical modeling of a distribution system switching operation by proposed CPN, by using place nodes to indicate the on/off states of sectionalizing switches and energized/de-energized/terminal states of service zones, Fig. 5 [18]–[21] illustrates the switching operation model by using a CPN. The , transition nodes , numbers of required place nodes and directed arcs in a CPN are calculated by (5)–(7) [18]–[21], where , , , and represent the numbers of service zones, line switches, feeders, and faulted zones, respectively. Table I and (8)–(11) [18]–[21] list the relationships between the input place nodes and output place nodes of each switching operation of switch (5) (6) (7)
(8) (9) (10) (11)
CHUANG et al.: DISTRIBUTION SYSTEM TEMPERATURE ADAPTIVE LOAD TRANSFER
1033
A. Operation Rules for Switching Operations [11], [18]–[20] This paper uses the following operation rules. Rule 1) All of the switches in the out-of-service areas will be opened first. All the terminal zones that are located in the overloaded feeders are regarded as the candidate objective zones. For a fault contingency in Taipower, the feeder circuit breaker (CB) will be tripped, and all line switches along the feeder will be opened automatically due to de-energization. After that, the CB is closed, and the line switches are closed sequentially until it hits the faulted zone. The feeder CB is tripped again, and the boundary switches of the faulted zone are locked out. The feeder CB is then reclosed again to complete the service restoration of upstream line sections. The whole process of fault detection, isolation, and upstream restoration does not involve any remote controlled action of line switches. Rule 2) A switch that connects an unfaulted but out-of-service zone to an energized zone is regarded as a candidate switch for switching operation. For the execution of system switching for non-interruptible load transfer, the voltage magnitudes and angels between both ends of open line switches to be closed have to be less than 0.1 p.u. and 10 . By this way, the voltage sag problem can be avoided. Rule 3) A switching operation can release only one objective zone and transfer its loading to the other adjacent feeder. A switching operation can pick up only single candidate object zone to maintain the radial structure of the power distribution system after the switching operation is executed. Rule 4) If there are several candidate objective zones to be considered to release, the higher service priority (HSP) objective zones have less opportunity to be disconnected and will be restored with higher opportunity. Rule 5) If there are several switch candidates, the one with the relatively heavy loading and that is close to the feeder outlet will be considered. If there are several candidate objective zones, the candidate objective zones with relatively smaller loading is selected to prevent the feeders from overloading after the switching operation is executed. Rule 6) If the candidate switch is absent, no feasible switching operation is found, and the inference process will be terminated. VI. COMPUTER SIMULATIONS To implement the inference process for load transfer switching operation decision making, the object-oriented programming language C++ is used to generate the object-oriented database of service sections, line switches, distribution feeders, and main transformers and to constitute the inference
Fig. 6. Overall temperature adaptive load transfer switching operation process using the CPN inference mechanism.
mechanism for determining the proper switching operations to improve the operating performance of distribution systems. For the back-up to this computer-based system, the distribution operator can check the change of feeder loading with temperature. Based on the temperature sensitivities of power loading of all service zones, which have been derived, the load transfer can be determined with default strategies. A practical distribution system with 19 distribution feeders, serving a mixture of customers, is simulated using a computer to demonstrate the effectiveness of the proposed CPN inference mechanism for determining the decisions on adaptive switching operations to temperature, to handle the overloading/fault contingency of distribution systems. The initial load flow analysis is executed to solve the hourly load demand of each service zone under a specified temperature. With the temperature change, the hourly load demand of each service zone is updated by corresponding TS accordingly for load transfer. It is not necessary to execute the load flow analysis for load transfer with the changes of study hour and temperature. Fig. 6 presents the overall temperature adaptive switching operation process, and Fig. 7 shows a one-line diagram of the study system, in which the current rating of each feeder is 400 A. Figs. 8–11 show the original load profiles of distribution feeders from 8 A.M. to 5 P.M. Feeders #3, 4, 5, 7, 8, 9, 10, 13, 15, and 17
1034
IEEE TRANSACTIONS ON POWER SYSTEMS, VOL. 21, NO. 3, AUGUST 2006
Fig. 7. One-line diagram of the study distribution system.
Fig. 8. Original load profile of Feeder #1 to #5.
in the study system serve the commercial customers, and the rest of feeders serve the residential customers. Figs. 12–15 present the corresponding power consumption against temperature and data on TS with respect to two classes of customers. The load profile of each feeder considering temperature sensitivity in the study system is shown in Figs. 16–19. A. Case A. Overloading Contingency It is found that Feeder #4 is slightly overloaded at 11 A.M., 3 P.M., and 4 P.M.; Feeder #11 is overloaded from 11 A.M. to 4 P.M., and the maximal overloading of 22 A occurred at 3 P.M.
Fig. 9. Original load profile of Feeder #6 to #10.
To solve the overload contingency since 11 A.M. by the CPN inference mechanism, feasible switching operations are proposed by opening switch s28, closing switch s98 to transfer the load demand of z23 from feeder #4 to feeder #3 and opening switch s61, and closing switch s120 to transfer the load demand of z69 from feeder #11 to feeder #10. The overloading contingency of feeder #4 and feeder #11 over the daytime period have been effectively handled by the proposed two switching operation pairs (s28, s98) and (s61, s120) derived by the CPN inference mechanism. The updated feeder configuration according to the proposed switching operations for solving the problem of multifeeder overload is shown in Fig. 20, and the corresponding
CHUANG et al.: DISTRIBUTION SYSTEM TEMPERATURE ADAPTIVE LOAD TRANSFER
1035
Fig. 14. Power consumption of residential customers versus temperature in northern Taiwan at 2 P.M.
Fig. 10. Original load profile of Feeder #11 to #15.
Fig. 15. Hourly TS tendency diagram of power consumption for residential customer in northern Taiwan.
Fig. 11. Original load profile of Feeder #16 to #19.
Fig. 16. Load profile with TS of Feeder #1 to #5.
Fig. 12. Power consumption of commercial customers versus temperature in northern Taiwan at 1 P.M.
Fig. 13. Hourly TS tendency diagram of power consumption for commercial customer in northern Taiwan.
feeder load profiles following switching operations are updated as shown in Fig. 21. It is found that the current loading of Feeder
#4 and #11 at 11 A.M. has been reduced from 402 A to 393 A and from 407 A to 386 A, respectively, and the overload problem of Feeder #4 and #11 over the daytime period has been completely solved. To solve the overload contingency and further better load distribution among distribution feeders, all sectionalizing switches are opened first, and the zone loading is then picked up one by one until the feeder loading approaches the average loading level. For this purpose, a feasible solution is proposed by execution of the following switching operation pairs (s21, s114), (s20, s105), (s71, s123), (s72, s104), (s65, s122), (s29, s102), (s59, s121), (s54, s116), (s28, s98), and (s61, s120). Figs. 22 and 23 plot the corresponding load profiles following proposed switching operations for load balancing among distribution feeders. The load distribution among distribution feeders is distributed even more effectively, better so that the system losses are reduced, and the system operation performance is improved.
1036
Fig. 17. Load profile with TS of Feeder #6 to #10.
IEEE TRANSACTIONS ON POWER SYSTEMS, VOL. 21, NO. 3, AUGUST 2006
proposed switching operation decisions by CPN for solving the overload and fault contingencies are determined as the feeder reconfiguration by the switching operation pairs (s28, s98), (s61, s120), (s18, s105), opening s12, closing s113, and s114. By executing the switching operation pairs (s28, s98) and (s61, s120) to relieve the loading of z23 and z69 to the neighboring Feeder #3 and #10 resolves the overload contingency of Feeder #4 and #11. However, downstream power service of faulted zone is completed by transferring the loading of z21, z22, and z83 to Feeder #13 by opening s18 and closing s105. The service restoration of downstream zone z13, z14, and z15 is implemented by opening s12 and closing s113, and the service restoration of downstream zone z63, z18, z17, z19, z20, z23, and z16 is implemented by opening s12 and closing s114. After execution of the proposed switching operations, both the fault contingency and overload problem have been solved simultaneously. Fig. 24 shows the updated feeder configuration, and Figs. 25 and 26 show the updated load profiles after solving fault and overload contingencies. It is found that the loading level of Feeder #3 has been significantly reduced after 11 A.M. due to the fault isolation and the load transfer to the other feeders. The loading level of Feeder #7 is increased from 166 A to 339 A because it takes over the partial loading from Feeder #3 following fault service restorations. C. Case C. Load Balancing After Solving Overload and Fault Contingencies
Fig. 18. Load profile with TS of Feeder #11 to #15.
Fig. 19. Load profile with TS of Feeder #16 to #19.
B. Case B. Overload and Fault Contingencies It is assumed that a fault occurs at zone z12 in Fig. 7 at 11 A.M., the circuit breaker cb3 of Feeder #3 has been tripped by checking the over-current relay status of all sectionalizing switches along the feeder, and the fault location is identified. The sectionalizing switch s9 and s10 that connected to z12 are locked to isolate the faulted area. The circuit breaker cb3 is then closed to restore the upstream power service of Feeder #3. The
It is assumed that the fault of zone z12 has been cleared after successfully solving the overload and fault contingencies before long. Based on the feeder configuration in Fig. 24, we redistribute the loading distribution among distribution feeders via the switching operation pair (s7, s95), (s71, s123), (s72, s104), (s65, s122), (s59, 121), (s54, s116), (s14, s96), (s31, s100), (s23, s97), (s13, s12), and (s98, s28) to improve the operating performance of distribution system. It is found that the current loading of Feeder #3 at 12 P.M. has been increased from 18.5 A to 284 A; Feeder #4 at 12 P.M. has been reduced from 390 A to 202 A; Feeder #10 at 12 P.M. has been reduced from 272 A to 265 A; and Feeder #11 at 12 P.M. has been reduced from 390 A to 330 A. The load balancing among the distribution feeders has been effectively improved. Fig. 27 shows the proposed feeder configuration, and Fig. 28 displays the several corresponding feeder loadings following the proposed switching operations. The hardware associated is not considered in this paper; however, the software of temperature adaptive load transfer may be incorporated into a distribution automation system as an application tool for the determination of determining the proper load transfer with temperature change. For a Taipower distribution system with 19 feeders, it takes less than 1.0 s to derive the temperature adaptive load transfer for the offline application. Since the proper line switch operation for load transfer will be proposed with the forecasting of temperature on hourly basis, the online application by accessing the actual loadings of all service zones and deriving the strategy of load transfer by considering the temperature sensitivity should not encounter the problem of
CHUANG et al.: DISTRIBUTION SYSTEM TEMPERATURE ADAPTIVE LOAD TRANSFER
1037
Fig. 20. Proposed feeder configuration for solving overload contingency and load balancing.
Fig. 21. Load profiles after solving overloads.
Fig. 22. Load profiles following proposed load balance switching operations.
computation time. For three study cases presented in this paper, the developed methodology can solve the temperature adaptive load transfer successfully. However, the load shedding strategy has to be considered for the distribution system serving highly load density area without sufficient capacity reserve of distribution feeders and main transformers. This will be investigated by authors as one of the future research areas to enhance the effectiveness of the proposed load transfer strategy. VII. CONCLUSIONS The CPN has been successfully implemented in this paper to determine the proper switching operation for system fault
Fig. 23. Load profiles following proposed load balance switching operations.
1038
IEEE TRANSACTIONS ON POWER SYSTEMS, VOL. 21, NO. 3, AUGUST 2006
Fig. 24. Feeder configuration for solving overload and fault contingencies.
Fig. 25. Load profiles after solving fault and overload.
Fig. 26. Load profiles after solving fault and overload.
contingency and overload. To represent load demand of each service zone more accurately, the typical load patterns of various customer classes have been used to estimate the load demand by the customer power consumption and load composition. Besides, the impact of temperature rise to the power demand of each service zone is also investigated by deriving the temperature sensitivity of customer loads for each study hour. By this way, the change of power consumption within each service zone and distribution feeder with temperature rise has been determined by considering the customer load profiles and TS of power consumption. When a fault occurs on a distribution
system, the proper switching operation to restore the unfaulted but out-of-service zones can be obtained by load transfer according to the power profiles of each service zone and the corresponding temperature effect to the power demand. A distribution system with 19 feeders in Taipower is selected for computer simulations to demonstrate the effectiveness of feeder reconfiguration by proposed temperature adaptive switching operations using the CPN inference mechanism. According to the computer simulations, the proposed CPN approach is an effective tool for enabling distribution system engineers to handle the distribution system contingencies by proper switching operations.
CHUANG et al.: DISTRIBUTION SYSTEM TEMPERATURE ADAPTIVE LOAD TRANSFER
1039
Fig. 27. Proposed feeder configuration for load balancing following FDIR.
Fig. 28. Load profiles after LB switching operations from 12 P.M. following service restoration.
ACKNOWLEDGMENT The authors would like to thank Dr. J.-S. Wu, Professor of Department of Electrical Engineering, National Kaohsiung University of Applied Sciences, Kaohsiung, Taiwan, R.O.C., for their valuable guides and discussions. REFERENCES [1] C. C. Liu, S. J. Lee, and K. Vu, “Loss minimization of distribution feeders: optimality and algorithms,” IEEE Trans. Power Del., vol. 4, no. 2, pp. 1281–1289, Apr. 1989.
[2] M. E. Baran and F. F. Wu, “Network reconfiguration in distribution system for loss reduction and load balancing,” IEEE Trans. Power Del., vol. 4, no. 2, pp. 1401–1407, Apr. 1989. [3] H. D. Chiang and R. Jean-Jumeau, “Optimal network reconfigurations in distribution systems: part 1: a new formulation and a solution methodology,” IEEE Trans. Power Del., vol. 5, pp. 1902–1909, Oct. 1990. [4] ——, “Optimal network reconfigurations in distribution systems: part 2: solution algorithms and numerical results,” IEEE Trans. Power Del., vol. 5, no. 3, pp. 1568–1574, Jul. 1990. [5] J. S. Wu, K. L. Tomsovic, and C. S. Chen, “A heuristic search approach to feeder switching operations for overload, faults, unbalanced flow and maintenance,” IEEE Trans. Power Del., vol. 6, no. 4, pp. 1579–1585, Oct. 1991. [6] Y. Y. Hsu, Y. J. Hwu, S. S. Liu, Y. W. Chen, H. C. Feng, and Y. M. Lee, “Transformer and feeder load balancing using a heuristic search approach,” IEEE Trans. Power Syst., vol. 8, no. 1, pp. 184–190, Feb. 1993. [7] Q. Zhou, D. Shirmohammadi, and W. H. E Liu, “Distribution feeder reconfiguration for service restoration and load balancing,” IEEE Trans. Power Syst., vol. 12, no. 2, pp. 724–729, May 1997. [8] C. S. Chen, J. S. Wu, and Y. N. Chang, “Criteria for interfeeder switching in distribution systems,” Proc. Inst. Elect. Eng., Gen., Transm., Distrib., vol. 135, no. 5, pt. C, pp. 461–467, Sep. 1988. [9] C. S. Lee, “A feeder reconfiguration approach to reliability improvement for distribution systems,” Master’s thesis, National Chung Cheng Univ., Chiayi, Taiwan, R.O.C., 1995. [10] M. A. Kashem, V. Ganapathy, G. B. Jasmon, and M. I. Buhari, “A novel method for loss minimization in distribution networks,” in Proc. Int. Conf. Electric Utility Deregulation Restructuring Power Technologies, London, U.K., Apr. 2000, pp. 251–256. [11] J. S. Wu, C. C. Liu, K. L. Liou, and R. F. Chu, “A Petri net algorithm for scheduling of generic restoration actions,” IEEE Trans. Power Syst., vol. 12, no. 1, pp. 69–75, Feb. 1997. [12] C. L. Yang and A. Yokoyama, “Fault section estimation of power system using color time Petri nets,” in Proc. Expert Systems Application Power Systems, 1993, pp. 321–326.
1040
[13] K. Tomsovic, “Evaluation rule-based systems,” in Proc. Expert Systems Application Power Systems, 1988, pp. 2.1–2.3. [14] L. Jenkins and H. P. Khincha, “Deterministic and stochastic Petri net models of protection schemes,” IEEE Trans. Power Del., vol. 7, no. 1, pp. 84–90, Jan. 1992. [15] V. Borozan and N. Rajakovic, “Minimum loss distribution network configuration: analysis and management,” in Proc. CIRED, Jun. 1997, pp. 6.18.1–6.18.5, Conference Publication No. 438. [16] C. S. Chen, M. S. Kang, J. C. Hwang, and C. W. Huang, “Temperature effect to distribution system load profiles and feeder losses,” IEEE Trans. Power Syst., vol. 16, no. 4, pp. 916–921, Nov. 2001. [17] C. S. Chen, M. S. Kang, Y. L. Ke, and T. E. Lee, “Stochastic load flow analysis by considering temperature sensitivity of customer power consumption,” in Proc. IEEE Bologna PowerTech Conf., Bologna, Italy, Jun. 2003. [18] C. S. Chen, Y. L. Ke, and J. S. Wu, “Switching operation decision making by using Petri-net approach for power distribution systems,” J. Chin. Inst. Eng., vol. 25, pp. 17–26, Jan. 2002. [19] C. S. Chen, Y. L. Ke, J. S. Wu, and M. S. Kang, “Application of Petri Nets to solve distribution system contingency by considering customer load patterns,” IEEE Trans. Power Syst., vol. 17, no. 2, pp. 417–423, May 2002. [20] J. S. Wu, “A Petri-net algorithm for multiple contingencies of distribution system operation,” IEEE Trans. Power Syst., vol. 13, no. 3, pp. 1164–1171, Aug. 1998. [21] K. Jensen, Coloured Petri Nets Basic Concepts, Analysis Methods and Practical Use. Berlin, Germany: Springer-Verlag, 1997.
Ying-Chun Chuang received the B.S. degree in electrical engineering from National Taiwan University of Science and Technology, Taipei, Taiwan, R.O.C., in 1988. He received the M S. degree in electrical engineering from National Cheng Kung University, Tainan, Taiwan, in 1990. He received the Ph.D. degree in electrical engineering from National Sun Yat-Sen University, Kaohsiung, Taiwan, in 1997. Since August 1990, he has been at the Department of Electrical Engineering, Kun Shan University, Yung-Kang, Taiwan. He is presently an Associate Professor. His research interests include power systems and power electronics.
IEEE TRANSACTIONS ON POWER SYSTEMS, VOL. 21, NO. 3, AUGUST 2006
Yu-Lung Ke (M’98–SM’06) was born in Kaohsiung, Taiwan, R.O.C., on July 13, 1963. He received the B.S. degree in control engineering from National Chiao-Tung University, Hsinchu, Taiwan, in 1988. He received the M.S. degree in electrical engineering. from National Taiwan University, Taipei, Taiwan, in 1991. He received his Ph.D. degree in electrical engineering from National Sun Yat-Sen University, Kaohsiung, Taiwan, in 2001. Since August 1991, he has been at the Department of Electrical Engineering, Kun Shan University of Technology, Yung-Kang, Taiwan. He is presently a Full Associate Professor. His research interests include power systems, distribution automation, energy management, power quality, renewable energy, and power electronics. Since 2002, Dr. Ke has served as a reviewer for IEEE TRANSACTIONS ON POWER ELECTRONICS, IEEE TRANSACTIONS ON POWER DELIVERY, IEE Proceedings Generation, Transmission, and Distribution, International Journal of Electrical Power and Energy Systems, and International Journal of Power and Energy Systems. Dr. Ke is a Registered Professional Engineer in Taiwan.
Chao-Shun Chen (M’84) received the B.S. degree from National Taiwan University, Taipei, Taiwan, R.O.C., in 1976 and the M.S. and Ph.D. degrees from the University of Texas, Arlington, in 1981 and 1984, respectively, all in electrical engineering. From 1984 to 1994, he was with National Sun Yat-Sen University, Kaohsiung, Taiwan, as a Professor. From 1993 to 1997, he was with the Kaohsiung Mass Rapid Transit Department as the Deputy Director in charge of electrical and mechanical system planning. From 1997 to 1998, He was a Professor at the National Taiwan University of Science and Technology, Taipei. He is currently a Full Professor in the Electrical Engineering Department at the National Sun Yat-Sen University. His research interests include the distribution automation, cogeneration systems, electrical, and mechanical system of mass rapid transit networks. Dr. Chen is a registered professional engineer in Taiwan.
Yuan-Lin Chen was born in Taiwan, R.O.C., on June 20, 1965. He received the M.S. degree and Ph.D. degree in electrical engineering from National Taiwan University, Taipei, in 1991 and 1994, respectively. He is currently a Professor in the Institute of Electro-Mechanical Engineering of Mingchi University of Technology, Taipei. His major interests are computer method power system analysis, optimization theory, harmonic filter design, micro-controller unit, and optical fiber transducer. Dr. Chen is a Registered Professional Engineer in Taiwan.