Journal of Environmental Protection, 2014, 5, 408-422 Published Online April 2014 in SciRes. http://www.scirp.org/journal/jep http://dx.doi.org/10.4236/jep.2014.55044
Diurnal and Seasonal Variations of Surface Ozone and Its Precursors in the Atmosphere of Yanbu, Saudi Arabia Hesham A. Al-Jeelani Department of Environmental Sciences, Faculty of Meteorology, Environment & Arid land Agriculture, King Abdulaziz University Email:
[email protected] Received 25 December 2013; revised 21 January 2014; accepted 18 February 2014 Copyright © 2014 by author and Scientific Research Publishing Inc. This work is licensed under the Creative Commons Attribution International License (CC BY). http://creativecommons.org/licenses/by/4.0/
Abstract Surface ozone (O3) and its precursor’s gases (nitrogen monoxide (NO), nitrogen dioxide (NO2), nitrogen oxides (NOx), carbon monoxide (CO), methane (CH4) and non-methane hydrocarbons (NMHCs), and sulfur dioxide (SO2) were measured in Yanbu, Saudi Arabia from January 2004-December 2004. The annual average concentrations of O3, NO, NO2, NOx, SO2, CO, CH4, TNMHCs and THC were 22.51 ppb, 15.58 ppb, 17.25 ppb, 23.84 ppb, 6.66 ppb, 165.13 ppb, 3.44 ppm, 0.56 ppm and 3.88 ppm, respectively. The SO2/NOx and SO2/NO2 concentration ratios during the period of study indicate that the mobile emissions are the predominant sources in yanbu. The diurnal cycles of O3 concentrations revealed highest levels in the daytime and lowest levels in night time. The diurnal variations of NO, NO2, NOx, SO2, CO, NMHCs concentrations were similar and showed peaks concentrations linked to traffic density, boundary layer mixing processes and chemical processes in the atmosphere. The mean concentrations of O3 in different seasons follow the order of summer > spring > autumn > winter. In contrary to O3, NO has higher concentrations in autumn and winter than those in summer and spring seasons. The highest concentrations of NO2, NOx, SO2, CO, and TNMHCs were found in autumn and spring, whereas the lowest concentrations were found in summer and winter. THC and CH4 have no significant change over winter, autumn and summer seasons, while their concentrations decrease sharply in spring. Although the studied area does not suffer from NO2, O3, SO2 and CO pollution and no health risk, comprehensive and long-term air quality management programmes are needed in order to keep air quality in a good condition.
Keywords Ozone, Precursors, Diurnal and Seasonal, Urban, Saudi Arabia
How to cite this paper: Al-Jeelani, H.A. (2014) Diurnal and Seasonal Variations of Surface Ozone and Its Precursors in the Atmosphere of Yanbu, Saudi Arabia. Journal of Environmental Protection, 5, 408-422. http://dx.doi.org/10.4236/jep.2014.55044
H. A. Al-Jeelani
1. Introduction
Anthropogenic air pollutants caused by technological progress, industrialization, and urban overpopulation had led to the deterioration of environmental air quality [1]. Toxic air pollutants emitted in close proximity of population areas have the potential to subject such population to health risks [2]. Tropospheric ozone (O3) is an important air pollutant threatening human health and vegetation growth [3] [4]. People living in cities with high O3 levels had an over 30% increased risk of dying from lung disease [5]. O3 is also one of the key species affecting the chemical properties of the atmosphere where it is a precursor for the highly reactive hydroxyl radical [6] [7]. Surface O3 and its precursors play an important role in affecting regional climates and causing adverse effects on human health and vegetation [8]. There are two sources of tropospheric O3, viz. photochemical production [9] and downward transport of ozone from the stratosphere [10]. Ground level O3 is a major constituent of smog in urban areas where motor vehicles are the main anthropogenic emission source of its precursors [11]. It is produced mainly by photochemistry involving pollutants that are released from various industrial and other anthropogenic activities, e.g., CH4, CO and [12]. NOx and hydrogen oxide radicals act as catalysts in this process. The relation between O3 and its main precursors represents one of the major scientific challenges associated with urban air pollution [13]. Ozone concentrations depend on the absolute and relative concentrations of its precursors and the intensity of solar radiation [14]. Variations in O3 concentration are controlled by a number of processes including photochemistry, physical/chemical removal, and transport, which occur on local, regional and global scales [15]. The variations in local meteorological conditions, such as wind direction, wind speed, temperature, and relative humidity, can affect the temporal variations in O3 and its precursors [16]. An analysis of the influences of meteorological parameters on O3 and its precursors at a specific site can contribute to a better understanding of the local and regional causes of O3 pollution [8]. The seasonal and diurnal variations of surface O3 and its precursors and the related meteorology have been extensively studied around the world [17] [18]. These studies showed that O3 chemistry and the effects of meteorological conditions could vary depending on the characteristics of the climate and air pollutants emissions in the place of interest. The temporal variations of O3 have been reported at many sites including rural, urban, coast and mountain sites in India [19], Japan [20], Thailand [21] and Kuwait [14]. Large quantities of non-methane hydrocarbons (NMHC) are emitted in the troposphere from vegetation and from a variety of anthropogenic sources. These anthropogenic sources include incomplete combustion sources (vehicle and fossil fueled power plant emissions), fuel storage and transport, solvent usage, emissions from industrial operations, landfills, and hazardous waste facilities [22] [23]. NOx are also emitted, or produced in the troposphere. Nitrogen monoxide (NO) is emitted from soils and natural fires and formed in situ in the troposphere from lightning, and is emitted from combustion processes such as vehicle emissions and fossil fueled power plants [22] [23]. NO is short lived because it oxidizes to produce nitrogen dioxide gas (NO2) and plays a major role in O3 production. In urban areas, NMHC and NOx, from anthropogenic sources dominate over NMHC and NOx from biogenic sources, and the reverse is generally the case in rural and remote areas [24]. Biomass burning [25], combustion of fossil fuels, and oxidation of hydrocarbons released from automobiles and industrial solvents are the main sources of atmospheric CO [26]. Its oxidation leads to O3 formation or destruction, depending upon the NO concentration [27]. The reaction of CO with OH radicals is the primary removal process from the atmosphere. Through this mechanism, CO acts as a major precursor to photochemical ozone [9]. In order to reduce ambient ozone concentrations, anthropogenic VOC emissions, which predominantly consist of non-methane hydrocarbons (NMHCs) have been the subject of extensive control programs in many countries. Accurate characterization of ozone precursors is extremely important for understanding tropospheric ozone formation and crafting effective control strategies to better address ozone air quality management issues [28]. The objective of the present study is to investigate the seasonal and diurnal variations of surface O3 and its precursors (NO, NO2, NOx, CO, THC, CH4 and TNMHCs), and SO2 in the atmosphere of yanbu Al Sinaiyah, and compare the concentrations of these pollutants with the standard limits.
2. Materials and Methods 2.1. Study Area Yanbu Al Sinaiyah is a city in the Hejaz region of western Saudi Arabia. It has a population of more than 66,381
409
H. A. Al-Jeelani
people. It is located about 350 km northwest of Jeddah. It is a terminal for oil pipelines and gas, which, stretching from the production areas in eastern Saudi Arabia to the west and it is the largest port on the Red Sea coast for the export of crude oil [29]. There are two types of industries in Yanbu Al Sinaiyah, which are traditional local industries and modern industries. The traditional local industries include building of sailing ships and fishing boats, furniture, traditional agricultural machinery, wicker industry, leather industry, woolens industry and jewelry industry. The modern industries include oil refining, sort of liquid natural gas, petrochemical industry, lubricants and oil additives industry. Yanbu has a hot desert climate. The climate of Yanbu Al Sinaiyah is characterized by high temperature and dryness. The maximum temperature reaches up more than 40˚C in the summer, while temperature in the winter is between 28˚C and 15˚C. The relative humidity is between 25% (dry) and 83% (humid). The average annual rainfall is lower than 50 mm. Over the course of the year typical wind speeds vary from 0 mph to 23 mph (calm to fresh breeze), rarely exceeding 30 mph (strong breeze). The wind is most often out of the west (31% of the time). The wind is least often out of the north (3% of the time), south east (3% of the time), north east (5% of the time), south (5% of the time), and east (5% of the time).
2.2. Air Sampling Air quality monitoring mobile station (Environment SA, France) was used to conduct the measurements of pollutants including: NO, NO2, NOx, O3, CO, SO2, THC, NMHCs and CH4. Calibration was daily done and no data was recorded during that period. Average hourly measurements were taken in the period of January 2004 to December 2004.
3. Results and Discussion 3.1. Status of O3 and Its Precursors The statistical summary of daily average concentrations of O3, NO, NO2, NOx, SO2, CO, THC, CH4 and TNMHC during the period of study (January 2004 to December 2004) are shown in Table 1. Seasons are defined as: spring is March, April and May; summer is June, July and August; autumn is September, October and November; winter is December, January and February. The daily average concentration ranged from 5.4 4 to 50.68 ppb (with a mean value of 22.51ppb) for O3, 6.04 to 45.47 ppb (with a mean value of 15.58 ppb) for NO, 5.42 to 36.74 ppb (with a mean value of 17.25 ppb) for NO2, 8.83 to 89.70 ppb (with a mean value of 32.84 ppb) for NOx, 1.00 to 53.56 ppb (with a mean value of 6.66 ppb) for SO2, 32.92 to 1006.67 ppb (with a mean value of 165.13 ppb) for CO, 0.76 to 6.27 ppm (with a mean value of 3.88 ppm) for THC, 0.64 to 5.65 ppm (with a mean value of 3.44 ppm) for CH4, 0.10 to 3.45 ppm (with a mean value of 0.56 ppm) for TNMHC during the period of study. The results of daily (24-h) minimum, maximum and average concentrations of NO2, O3, SO2 and CO were compared with the available air quality standards in different countries. The concentrations of these pollutants did not exceed the available standards. Although, the studied area does not suffer from NO2, O3, SO2 and CO pollution and no health risk, comprehensive, long-term air quality management programmers are needed in order to keep air quality in a good condition.
3.2. Diurnal Variations in O3 and Its Precursors The diurnal variations in O3, NO, NO2, NOx, CO, and SO2concentrations during the period of study are represented graphically in Figure 1. From this figure, it can be noticed that the diurnal variation of O3 is characterized by high concentrations during daytime and low concentrations during late night and morning. The minimum O3 concentration appears during the morning hours (7.00 - 9.00). The maximum O3 concentration appears at around 11.00 h in summer, at around 12.00 h in spring, at around 14.00 - 17.00 h in autumn and at around 17.00 h in winter. The increase in O3 concentration during daytime is due to the increase in solar radiation intensity which favors the conditions to power the photochemical reactions [30]. Significant increasing O3 values during daytime were observed at an urban site in tropical India [31]. The decrease in O3 concentration during late night and morning is due to the absence of the photochemical reactions and the consumption of O3 by deposition and or reaction with NO and NO2 which act as a sink for O3 [30]. The diurnal variations of O3 for the four seasons show a similar pattern; however, the amplitudes of the varia-
410
H. A. Al-Jeelani
Table 1. Statistical summary of daily averaged concentrations of O3, NO, NO2, NOx, SO2, CO, THC, CH4 and TNMHC in different seasons over the period from January 2004 to November 2004. Pollutants
O3 (ppb)
NOx (ppb)
NO2 (ppb)
NO (ppb)
SO2 (ppb)
CO (ppb)
THC (ppm)
CH4 (ppm)
TNMHC (ppm)
Statistics
Season Winter
Spring
Summer
Autumn
Annual
Min.
7.96
7.40
8.05
5.44
5.44
Max.
30.54
50.68
41.52
46.05
50.68
Median
16.49
26.08
24.40
19.88
20.92
Mean
17.20
25.79
24.91
20.94
22.51
S.D.
4.10
9.93
8.87
8.45
8.97
Min.
15.00
16.28
19.56
8.83
8.83
Max.
59.04
89.70
89.70
61.80
89.70
Median
27.58
28.80
26.72
41.36
31.12
Mean
29.16
30.41
29.26
42.53
32.84
S.D.
9.14
9.85
9.18
8.55
9.18
Min.
8.88
9.68
9.36
5.42
5.42
Max.
23.32
36.74
25.68
31.00
36.74
Median
15.98
16.68
14.04
21.12
16.96
Mean
15.98
17.00
14.85
21.17
17.25
S.D.
3.42
3.55
3.43
3.16
3.39
Min.
6.04
6.16
6.36
6.67
6.04
Max.
34.48
25.28
27.68
45.47
45.47
Median
14.60
12.44
11.54
18.68
14.32
Mean
16.03
13.58
12.32
20.38
15.58
S.D.
7.10
5.31
3.94
6.92
5.82
Min.
2.44
1.00
1.23
5.20
1.00 53.56
Max.
13.08
22.60
53.56
25.88
Median
3.54
4.72
3.06
8.72
5.01
Mean
4.39
6.48
5.51
10.24
6.66
S.D.
2.17
4.53
7.14
4.50
4.59
Min.
76.00
32.92
32.92
66.67
32.92
Max.
336.80
377.60
266.80
1006.67
1006.67
Median
153.20
153.60
123.40
162.40
148.15
Mean
161.42
170.86
134.00
194.25
165.13 77.78
S.D.
57.70
69.27
52.13
132.02
Min.
3.59
1.39
1.39
0.76
0.76
Max.
5.45
4.81
6.27
5.58
6.27
Median
4.51
2.59
4.18
4.31
3.90
Mean
4.55
2.90
4.01
4.05
3.88
S.D.
0.43
0.78
1.27
0.96
0.86
Min.
3.19
1.24
1.34
0.64
0.64
Max.
4.99
4.70
5.65
4.85
5.65
Median
4.15
2.57
3.55
3.65
3.48
Mean
4.15
2.58
3.61
3.42
3.44
S.D.
0.46
0.77
1.25
0.84
0.83 0.10
Min.
0.31
0.10
0.22
0.42
Max.
0.55
3.45
1.11
0.90
3.45
Median
0.42
0.56
0.41
0.67
0.52
Mean
0.42
0.70
0.43
0.67
0.56
S.D.
0.05
0.65
0.14
0.09
0.23
411
H. A. Al-Jeelani
412
H. A. Al-Jeelani
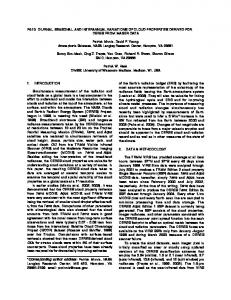
Figure 1. Diurnal variation in O3, NO, NO2, NOx, CO and SO2 concentration in Yanbu during the different seasons.
413
H. A. Al-Jeelani
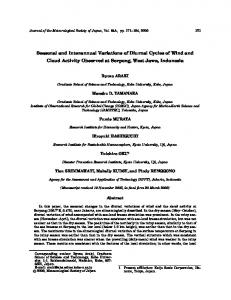
tions and position of peaks are different. The maximum amplitude is the highest in summer and spring, the second highest in autumn, and the lowest in winter. This may be attributed to the higher photochemical reactions during the summer seasons. The seasonal variation of O3 at an urban area, Nagoya, Japan, showed that higher concentrations were observed from late spring to summer, while lower concentrations were observed in winter [32]. Elevated levels of O3, frequently encountered in the large urban centers to exhibit variable concentration profiles [33] with maximum levels occurring during the summer months [34] are becoming a cause of global concern. The ozone precursors, NO, NO2, NOx and CO, show an almost opposite diurnal variation pattern to O3 (Figure 1), characterized by high concentrations during night and morning and low concentrations during daytime, especially noon and afternoon. Each pollutant has two main peak concentration levels; the first peak appears in the morning rush hours (6:00 - 9:00); the second one appears around late night (22:00 - 2:00), but for CO the second one appears around (22:00 - 24:00). The morning rush hour peak is mainly caused by traffic. These precursors reach their minimum values at around 4:00 - 6:00 and at around 15:00 - 17:00 when O3 reaches its high values. The double peak patterns of NO, NO2, NOx and CO may be atypical signature of urban influence boundary layer processes, surface wind pattern, emissions, transportation/work cycle and chemical processes. During the morning time, the increase in the emission rate from traffic, accompanied with a poorer dispersive conditions and lower photochemical reaction lead to accumulate the concentrations of air pollutants. Latha and Badarinath [35] reported that high levels of NOx during morning and late evening can be attributed to combinations of anthropogenic emissions, boundary layer processes, chemistry as well as local sources and wind patterns. In the present study, the low concentrations of NO and NO2 during the mid-day time may be due to the high dispersion and high dilution conditions under the effect of high temperature, which increases the thermal turbulence currents. Moreover, the high temperature and solar radiation intensity during the mid-day time lead to increasing the photochemical reactions and consequently increasing the chemical loss of those pollutants. This leads todecreasing the NOx concentrations in the mid-day time. On the other hand, during the late evening and nighttime, the boundary layer descends and remains low until early morning, thereby resisting the mixing of anthropogenic emissions with the upper layer. Hence, pollutants get trapped in a shallow surface layer resulting in raising levels of NO, NO2 and NOx in the present of study. This is in agreement with Rao et al. [36] [37] who attributed that the variations in NOx to variations in boundary layer mixing processes, chemistry, anthropogenic emissions, and local surface wind patterns. The diurnal variation of SO2 in the present study is characterized by low concentration in early morning, evening and night and high concentration in the other time of the day (Figure 1). The SO2 trend is characterized by two maxima for all seasons except for summer where it has three maxima. The maximum SO2 concentration appears at 12.00 in autumn, at 11.00, 14.00 and 15.00 in summer, at 11.00 and 13.00 in spring and at 13.00 and 14.00 in winter. The high concentration of SO2 in morning, noon and afternoon may be attributed to the primary emissions from factories in this industrial area. The diurnal variations of THC, CH4 and TNMHC during the period of study are represented graphically in Figure 2. From this figure, it can be noticed that the diurnal variation of THC, CH4 and TNMHC is fluctuated along the day. THC concentration is fluctuated in the range 3.32 - 5.73 ppm in winter, 1.68 - 4.31 ppm in spring, 2.57 - 6.65 ppm in summer and 2.89 - 4.81 ppm in autumn. CH4 concentration is fluctuated in the range 2.91 5.36 ppm in winter, 1.47 - 3.80 ppm in spring, 2.35 - 5.77 ppm in summer and 2.48 - 4.34 ppm in autumn. TNMHC concentration is fluctuated in the range 0.35 - 0.50 ppm in winter, 0.57 - 0.87 ppm in spring, 0.31 0.55 ppm in summer and 0.56 - 0.80 ppm in autumn. The trend of THC and CH4 are the same where autumn has trend opposite to that of the other seasons of the year. This may be due to the presence of additional emission sources of THC and CH4 in the study area. The trend of TNMHC is the same for all seasons of the year.
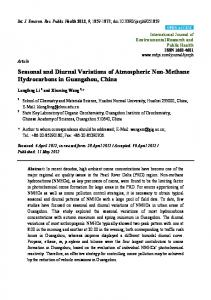
3.3. Seasonal Variations in O3 and Its Precursors The monthly and seasonal variations of O3, NO, NO2, NOx, CO, and SO2 during the period of study are represented graphically in Figure 3 and Figure 4. From these figures, it can be seen that, O3 shows a well-defined seasonal variation. The low values appear in late autumn and winter (colder periods), while the high values appear in late spring, summer and early autumn (warmer periods). Studies conducted around the world reported high O3 levels during the warmer periods [11] [14]. This common behavior of O3 was justified by the dominant photochemical production process of O3 due to the presence of its precursors and intense solar
414
H. A. Al-Jeelani
415
H. A. Al-Jeelani
Figure 2. Diurnal variation in THC, CH4, and TNMHC concentration in Yanbu during the different seasons.
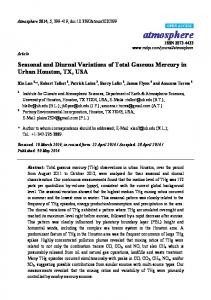
insolation during the warmer periods. The low levels of O3 during late autumn and winter (colder periods) is almost the same as that observed in Kuwait [11] and in urban site in China [8]. The O3 precursors, NO, NO2, NOx and CO, show similar seasonal variations (Figure 3 and Figure 4). The higher values appear in late autumn and winter, while the lower values appear in summer. The seasonal variation pattern of these precursors is almost opposite to that of ozone. This pattern is similar to the results of previous studies performed in many areas around the world [11] [32] [38]. One of the causes of this pattern might partly be attributed to the variation in temperature. For example, the greater photochemical reaction due to the higher solar radiation, and the stronger vertical atmospheric mixing in summer than in the other seasons, contribute to the low values of these pollutants in summer. Another cause is the increase in air pollutant emission in winter due to heating fuels consumed. The monthly and seasonal variation of SO2 in the present study (Figure 3 and Figure 4) is characterized by high concentration in autumn and early winter and the minimum concentration in winter and summer. Figure 5 shows the seasonal variations of THC, CH4, and TNMHC during the four seasons of year 2004. The seasonal variation of THC and CH4 is the same, where the maximum was in summer (July) and the minimum was in spring (April). The highest concentrations of TNMHC were found in autumn and early winter, whereas the lowest levels were detected in summer (July). The photochemical removal (primarily by the hydroxyl (OH) radical) and dilution due to atmospheric mixing are two important factors that affect the seasonal variation of TNMHCs [39]. The mixing layer in summer is much higher than that in winter. The dilution for airborne pollutants from the ground source emissions in summer is stronger than that in winter. OH concentration in summer in mid-latitude is about 10 times its value in winter. High OH concentration speeds up the degradation of TNMHCs. Mobile emission sources are predominantly characterized by high NOx and CO concentrations, and point emission sources by high SO2 and NOx. So, the mobile sources have relatively low SO2/NOx ratios [40]. In the current study, the concentration ratios were 0.27, 0.38, 0.37, 0.48 and 0.39 for SO2/NO2 and 0.15, 0.21, 0.19, 0.24 and0.20 for SO2/NOx during the winter, spring, summer, autumn and annual, respectively. These results indicate that the mobile emissions are the predominant source within the study area. The SO2/NO2 concentration
416
H. A. Al-Jeelani
Figure 3. Monthly variation in concentrations of O3, NO. NO2, NOX, CO and SO2 in Yanbu during the period of study.
ratios at the study area during the period of study were similar to those found in Kolkata, India (ranged from 0.38 - 0.41), [41].
3.4. Comparison of O3 and Its Precursors Levels in Yanbu Al Sinaiyah with Other International Cities The Saudi Arabia air quality standard for hourly O3 concentration is 150 ppb. Moreover, photochemical smog usually occurs when O3 concentration exceeds 100 ppb [42]. The frequency percentage distribution of the hourly concentrations of O3 during the period of study is graphically presented in Figure 6. From this figure, it can be seen that the hourly O3 concentrations during the period of study not exceed the maximum O3 hourly set by
417
H. A. Al-Jeelani
Figure 4. Seasonal variation in concentrations of O3, NO. NO2, NOX, CO and SO2 in Yanbu during the period of study.
Saudi Arabia air and the photochemical smog formation not occur during the period of study. The annual average concentration of O3 and its precursors in Yanbu Al Sinaiyah were compared with these found in different locations in Saudi Arabia and over the world [8] [20] [30] [41] [43]-[54]. As shown in Table 2, the average concentrations of NO, NO2, NOx, SO2, O3, CO, CH4 and NMHCs in the present study were lower/higher or similar to those detected in other cities of the world. For example, the O3 mean concentration in Yanbu Al Sinaiyah was similar to that found in Al-Taneem, KSA; Eskisehir, Turkey, and Nanjing, China, while it was higher than those found in Holy Makkah but it was lower than those found in Haram, Giza, Egypt. NO concentration was lower than those found in other locations except those found in Eskisehir, Turkey and Nanjing, China. NO2 concentration was lower when compared with those reported in other locations. NOx concentration was similar to that observed in Al-Taneem, Holy Makkah, KSA, while it was higher than that observed in Holy Makkah and it was lower than that recorded in Muna, KSA. SO2 concentration was lower than those found in other locations. The CO concentration was lower when compared with those reported in other locations. CH4
418
H. A. Al-Jeelani
Figure 5. Seasonal variation in concentrations of O3, THC, CH4 and TNMHC in Yanbu during the period of study.
Figure 6. Frequency distribution of hourly ozone concentration during the different seasons.
419
H. A. Al-Jeelani
Table 2. Concentration of Ozone and its precursors at different sites all over the world. Site
O3 (ppb)
NO (ppb)
NO2 (ppb)
NOx (ppb)
SO2 (ppb)
CO (ppb)
CH4 (ppm)
TNMHC (ppm)
Yanbu Al Sinaiyah, KSA
22.5
15.6
17.3
32.8
6.7
165.1
3.44
0.56
Present study
Al-Taneem, KSA
21.0
18.0
-
33.0
10.0
1386.0
2.15
0.39
Al Jeelani (2009a)
Holy Makkah, KSA
4.0
-
-
15.0
16.0
11300.0
-
-
Al Jeelani (2009b)
Haram, Giza, Egypt
40.0 - 79.0
-
89.0 - 137.0
-
-
-
-
-
Khoder (2004)
Haram, Giza, Egypt
30.0 - 64.0
-
-
-
-
-
-
-
Khoder (2009)
Dokki, Giza, Egypt
-
-
70.0 - 98.0
-
32.0 - 48.0
-
-
-
Khoder (2002)
Eskisehir, Turkey
19.0
8.0 - 16.0
-
-
-
-
-
-
özden et al. (2008)
Reference
Ankara, Turkey
-
-
-
-
11.0
-
-
-
DRSCH (2006)
Nanjing, China
20.4
10.6
18.8
-
-
1130.0
1.89
0.13
Jun et al. (2007)
Beijing, China
-
38.0
-
-
9.0
1970.0
-
-
Wang et al. (2008) Lewne et al. (2004)
Germany
-
18.0
-
-
-
-
-
-
Kolkata, India
-
17.0
-
-
-
-
-
-
Gupta et al. (2008)
Dhaka, Bangladesh
-
-
-
-
45.0
-
-
-
Gurjar et al. (2008)
Nagoya, Japan
-
-
-
-
-
-
-
0.03
Saito et al. (2009)
London, UK
-
-
-
-
-
-
-
0.03
Derwent et al.(2000)
Lille, France
-
-
-
-
-
-
-
0.02
Borbon et al. (2002)
Seoul, Korea
-
-
-
-
-
-
-
0.05
Na and Kim (2001)
concentration was much higher than those found in other locations. The TNMHC concentration was higher than those recorded in other locations. Generally, the variation in the levels of atmospheric measured ozone and its precursors among the different locations of the world was presumably due to the difference in the traffic density, industrial activities, and intensity of human activities, land use patterns and the frequency of rainfall prior to sample collection.
References [1]
Godish, T. (2004) Air Quality. 4th Edition, CRC Press Inc., Boca Raton.
[2]
Watson, A.Y., Bates, R.D. and Kennedy, D. (1988) Air Pollution, the Automobile, and Public Health. National Academy Press, Washington DC. http://dx.doi.org/10.1016/S1352-2310(99)00453-7
[3]
Solomon, P., Cowling, E., Hidy, G. and Furiness, C. (2000) Comparison of Scientific Findings from Major Ozone Field Studies in North America and Europe. Atmospheric Environment, 34, 1885-1920.
[4]
Lippmann, M. (2009) Environmental Toxicants: Human Exposures and Their HealthEffects. John Wiley & Sons, Hoboken.
[5]
Wilson, E.K. (2009) Ozone’s Health Impact. Chemical & Engineering News, 87, 9. http://dx.doi.org/10.1021/cen-v087n011.p009a
[6]
IPCC (2007) Climate Change 2007: The Physical Science Basis: Contribution of Working Group I to the Fourth Assessment Report of the Intergovernmental Panel on Climate Change. Cambridge University Press, Cambridge, New York.
[7]
Sitch, S., Cox, P.M., Collins, W.J. and Huntingford, C. (2007) Indirect Radiative Forcing of Climate Change through Ozone Effects on the Land-Carbon Sink. Nature, 448, 791-794. http://dx.doi.org/10.1038/nature06059
[8]
Jun, T., Xia, Z., Wang, H. and Li, W. (2007) Temporal Variations in Surface Ozone and Its Precursors and Meteorological Effects at an Urban Site in China. Atmospheric Research, 85, 310-337. http://dx.doi.org/10.1016/j.atmosres.2007.02.003
[9]
Crutzen, P.J. (1974) Photochemical Reactions Initiated by and Influencing Ozone in Unpolluted Tropospheric Air. Tellus, 26, 47-56. http://dx.doi.org/10.1111/j.2153-3490.1974.tb01951.x
[10] Levy II, H., Mahlman, J.D., Moxim, W.J. and Liu, S.C. (1985) Tropospheric Ozone: The Role of Transport. Journal of Geophysical Research, 90, 3753-3772. [11] Jallad, K.N. and Espada-Jallad, C. (2010) Analysis of Ambient Ozone and Precursor Monitoring Data in a Densely Populated Residential Area of Kuwait. Journal of Saudi Chemical Society, 14, 363-372. http://dx.doi.org/10.1016/j.jscs.2010.04.003
420
[12] Fishman, J. and Crutzen, P.J. (1978) The Origin of Ozone in the Troposphere. Nature, 274, 855. http://dx.doi.org/10.1038/274855a0
H. A. Al-Jeelani
[13] Beig, G., Gunthe, S. and Jadhav, D.B. (2007) Simultaneous Measurements of Ozoneand Its Precursors on a Diurnal Scale at a Semi Urban Site in India. Journal of Atmospheric Chemistry, 57, 239-253. http://dx.doi.org/10.1007/s10874-007-9068-8 [14] Abdul-Wahab, S.A. and Bouhamra, W.S. (2004) Diurnal Variations of Airpollution from Motor Vehicles in Residential Area. International Journal of Environmental Studies, 61, 73-98. http://dx.doi.org/10.1080/0020723032000130034 [15] Yang, C.-F. Ou, Lin, N.-H., Sheu, G.-R., Lee, C.-T. and Wang, J.-L. (2012) Seasonal and Diurnal Variations of Ozone at a High-Altitude Mountain Baseline Station in East Asia. Atmospheric Environment, 46, 279-288. http://dx.doi.org/10.1016/j.atmosenv.2011.09.060 [16] Elminir, H.K. (2005) Dependence of Urban Air Pollutants on Meteorology. Science of the Total Environment, 350, 225237. http://dx.doi.org/10.1016/j.scitotenv.2005.01.043 [17] Dueñas, C., Fernández, M.C., Cañete, S., Carretero, J. and Liger, E. (2002) Assessment of Ozone Variations and Meteorological Effects in an Urban Area in the Mediterranean Coast. Science of the Total Environment, 299, 97-113. http://dx.doi.org/10.1016/S0048-9697(02)00251-6 [18] Lehman, J., Swinton, K., Bortnick, S., Hamilton, C., Baldridge, E., Eder, B. and Cox, B. (2004) Spatio-Temporal Characterization of Tropospheric Ozone across the Eastern United States. Atmospheric Environment, 38, 4357-4369. http://dx.doi.org/10.1016/j.atmosenv.2004.03.069 [19] Satsangi, G.S., Lakhani, A., Kulshrestha, P.R. and Taneja, A. (2004) Seasonal and Diurnal Variation of Surface Ozone and a Preliminary Analysis of Exceedance of Its Critical Levels at a Semi-Arid Site in India. Journal of Atmospheric Chemistry, 47, 271-286. http://dx.doi.org/10.1023/B:JOCH.0000021156.04126.3b [20] Saito, S., Nagao, I. and Kanzawa, H. (2009) Characteristics of Ambient C2-C11 Non-Methane Hydrocarbons in Metropolitan Nagoya, Japan. Atmospheric Environment, 43, 4384-4395. http://dx.doi.org/10.1016/j.atmosenv.2009.04.031 [21] Zhang, B.N. and Oanh, N.T.K. (2002) Photochemical Smog Pollution in the Bangkok Metropolitan Region of Thailand in Relation to O3 Precursor Concentrations and Meteorological Conditions. Atmospheric Environment, 36, 4211-4222. http://dx.doi.org/10.1016/S1352-2310(02)00348-5 [22] Sawyer, R.F., Harley, R.A., Cadle, S.H., Norbeck, J.M., Slott, R. and Bravo, H.A. (2000) Mobile Sources Critical Review: 1998 NARSTO Assessment. Atmospheric Environment, 34, 2161-2181. http://dx.doi.org/10.1016/S1352-2310(99)00463-X [23] Placet, M., Mann, C.O., Gilbert, R.O. and Niefer, M. (2000) Emissions of Ozone Precursors from Stationary Sources: A Critical Review. Atmospheric Environment, 34, 2183-2204. http://dx.doi.org/10.1016/S1352-2310(99)00464-1 [24] Geron, C.D., Pierce, T.E. and Guenther, A.B. (1995) Reassessment of Biogenic Volatile Organic Compound Emissions in the Atlanta Area. Atmospheric Environment, 29, 1569-1578. http://dx.doi.org/10.1016/1352-2310(94)00274-O [25] Crutzen, P.J., Heidt, L.E., Krasnec, J.P., Pollack, W.H. and Seiler, W. (1979) Biomass Burning as a Source of Atmospheric Gases CO, H2, N2O, NO, CH3Cl, and COS. Nature, 282, 253-256. http://dx.doi.org/10.1038/282253a0 [26] Brewer, D.A., Olgiaruso, M.A., Aygustson, T.R. and Levine, J.S. (1984) The Oxidation of Isoprene in the Troposphere: Mechanism and Model Calculations. Atmospheric Environment, 18, 2723-2744. http://dx.doi.org/10.1016/0004-6981(84)90338-X [27] Warneck, P. (1988) Chemistry of Natural Atmosphere. Academic Press, San Diego. [28] Yang, K.L., Ting, C.C., Wang, J.L., Wingenter, O.W. and Chan, C.C. (2005) Diurnal and Seasonal Cycles of Ozone Precursors Observed from Continuous Measurement at an Urban Site in Taiwan. Atmospheric Environment, 39, 3221-3230. http://dx.doi.org/10.1016/j.atmosenv.2005.02.003 [29] Royal Commission for Jubail and Yanbu (2012) http://www.rcjy.gov.sa/ar-SA/Citizen/Yanbu/AboutCity/Pages/default.aspx# [30] Khoder, M.I. (2009) Diurnal, Seasonal and Weekdays-Weekends Variations of Ground Level Ozone Concentrations in an Urban Area in Greater Cairo. Environmental Monitoring and Assessment, 149, 349-362. http://dx.doi.org/10.1007/s10661-008-0208-7 [31] Lal, S., Naja, M. and Subbaraya, B.H. (2000) Seasonal Variations in Surface Ozone and Its Precursors over an Urban Site in India. Atmospheric Environment, 34, 2713-2724. http://dx.doi.org/10.1016/S1352-2310(99)00510-5 [32] Saito, S., Nagao, I. and Tanaka, H. (2002) Relationship of NOx and NMHC to Photochemical O3 Production in a Coastal and Metropolitan Areas of Japan. Atmospheric Environment, 36, 1277-1286. http://dx.doi.org/10.1016/S1352-2310(01)00557-X [33] Murao, N., Ohta, S., Furuhashi, N. and Mizoguchi, I. (1990) The Causes of Elevated Concentration of Ozone in Sapporo. Atmospheric Environment. Part A. General Topics, 24, 1501-1507. http://dx.doi.org/10.1016/0960-1686(90)90059-V
421
H. A. Al-Jeelani
[34] Kelly, N.A. and Gunst, R.F. (1990) Response of Ozone to Changes in Hydrocarbon and Nitrogen Oxide Concentrations in Outdoor Smog Chambers Filled with Los Angeles Air. Atmospheric Environment. Part A. General Topics, 24, 29913005. http://dx.doi.org/10.1016/0960-1686(90)90479-7
[35] Latha, K.M. and Badarinath, K.V.S. (2003) Black Carbon Aerosols over Tropical Urban Environment—A Case Study. Atmospheric Research, 69, 125-133. http://dx.doi.org/10.1016/j.atmosres.2003.09.001 [36] Rao, T.V.R., Reddy, R.R., Sreenivasulu, R., Peeran, S.G., Murthy, K.N.V., Ahammed, Y.N., Gopal, K.R., Azeem, P.A., Sreedhar, B. and Sunitha, K. (2002) Air Space Pollutants CO and NOx Level at Anantapur (Semi-Arid Zone), Andhra Pradesh. Journal of Indian Geophysical Union, 3, 151-161. [37] Rao, T.V.R., Reddy, R.R., Sreenivasulu, R., Peeran, S.G., Murthy, K.N.V., Ahammed, Y.N., Gopal, K.R., Azeem, P.A., Sreedhar, B. and Badarinath, K.V.S. (2002) Seasonal and Diurnal Variations in the Levels of NOx and CO Trace Gases at Anantapur in Andhra Pradesh. Journal of Indian Geophysical Union, 3, 163-168. [38] Jo, W.K. and Park, J.H. (2005) Characteristics of Roadside Air Pollution in Korean Metropolitan City (Daegu) over Last 5 to 6 Years: Temporal Variations, Standard Exceedances, and Dependence on Meteorological Conditions. Chemosphere, 59, 1557-1573. http://dx.doi.org/10.1016/j.chemosphere.2004.12.021 [39] Qin, Y., Walk, T., Gary, R., Yao, X. and Elles, S. (2007) C2-C10 Nonmethane Hydrocarbons Measured in Dallas, USA— Seasonal Trends and Diurnal Characteristics. Atmospheric Environment, 41, 6018-6032. http://dx.doi.org/10.1016/j.atmosenv.2007.03.008 [40] Aneja, V.P., Roelle, P.A., Murray, G.C., Southerland, J., Erisman, J.W., Fowler, D., Asman, W.A.H. and Patni, N. (2001) Atmospheric Nitrogen Compounds II: Emissions, Transport, Transformation, Deposition and Assessment. Atmospheric Environment, 35, 1903-1911. http://dx.doi.org/10.1016/S1352-2310(00)00543-4 [41] Gupta, A.K., Karar, K., Ayoob, S. and Kuruvilla, J. (2008) Spatio-Temporal Characteristics of Gaseous and Particulate Pollutants in an Urban Region of Kolkata, India. Atmospheric Research, 87, 103-115. http://dx.doi.org/10.1016/j.atmosres.2007.07.008 [42] Guicherit, R., Jelters, R. and Lindquiate, F. (1972) Determination of Ozone Concentration in Outdoor Air near Delft, the Nether Land. Environmental Pollution, 3, 91-110. http://dx.doi.org/10.1016/0013-9327(72)90029-8 [43] Al-Jeelani, H.A. (2009) Air Quality Assessment at Al-Taneem Area in the Holly Makkah City, Saudi Arabia. Environmental Monitoring and Assessment, 156, 211-222. http://dx.doi.org/10.1007/s10661-008-0475-3 [44] Al-Jeelani, H.A. (2009) Evaluation of Air Quality in the Holly Makkah during Hajj Season 1425H. Journal of Applied Sciences Research, 5, 115-121. [45] Khoder, M.I. (2004) Atmospheric Formation and Occurrence of Nitrous Acid and Its Role in the Formation of Ozone in the City Centre in Cairo, Egypt. Egyptian Journal of Chemistry, 47, 189-209. [46] Khoder, M.I. (2002) Atmospheric Conversion of Sulfur Dioxide to Particulate Sulfate and Nitrogen Dioxide to Particulate Nitrate and Gaseous Nitric Acid in an Urban Area. Chemosphere, 49, 675-684. http://dx.doi.org/10.1016/S0045-6535(02)00391-0 [47] Özden, Ö., Döğeroğlu, T. and Kara, S. (2008) Assessment of Ambient Air Quality in Eskişehir, Turkey. Environment International, 34, 678-687. http://dx.doi.org/10.1016/j.envint.2007.12.016 [48] DRSCH (Directory of RefikSaydam Center of Hygiene) (2006) Research Directorate of Environmental Health. www.rshm.saglik.gov.tr. [49] Wang, W.X., Chai, F.H., Zhang, K., Wang, S.L., Chen, Y.Z., Wang, X.Z. and Yang, Y.Q. (2008) Study on Ambient Air Quality in Beijing for the Summer 2008 Olympic Games. Air Quality, Atmosphere & Health, 1, 31-36. http://dx.doi.org/10.1007/s11869-008-0003-1 [50] Lewne, M., Cyrys, J., Meliefste, K., Hoek, G., Brauer, M., Fischer, P., Gehring, U., Heinrich, J., Brunekreef, B. and Bellander, T. (2004) Spatial Variation in Nitrogen Dioxide in Three European Areas. Science of the Total Environment, 332, 217-230. http://dx.doi.org/10.1016/j.scitotenv.2004.04.014 [51] Gurjar, B.R., Butler, T.M., Lawrence, M.G. and Lelieveld, J. (2008) Evaluation of Emissions and Air Quality in Megacities. Atmospheric Environment, 42, 1593-1606. http://dx.doi.org/10.1016/j.atmosenv.2007.10.048 [52] Derwent, R.G., Davis, T.J., Delaney, M., Dollard, G.J., Field, R.A., Dumitrean, P., Nason, P.D., Jones, B.M.R. and Pepler, S.A. (2000) Analysis and Interpretation of the Continuous Hourly Monitoring Data for 26 C2-C8 Hydrocarbons at 12 United Kingdom Sites during 1996. Atmospheric Environment, 34, 297-312. http://dx.doi.org/10.1016/S1352-2310(99)00203-4 [53] Borbon, A., Locoge, N., Vellerot, M., Galloo, J.C. and Guillermo, R. (2002) Characterization of NMHCs in a French Urban Atmosphere: Overview of the Main Sources. Science of the Total Environment, 292, 177-191. http://dx.doi.org/10.1016/S0048-9697(01)01106-8 [54] Na, K. and Kim, Y.P. (2001) Seasonal Characteristics of Ambient Volatile Organic Compounds in Seoul, Korea. Atmospheric Environment, 35, 2603-2614. http://dx.doi.org/10.1016/S1352-2310(00)00464-7
422