Environmental Sustainability https://doi.org/10.1007/s42398-018-00028-y
ORIGINAL ARTICLE
Diversity, composition and structure of understorey vegetation in the tropical forest of Achanakmaar Amarkantak Biosphere Reserve, India Tarun Kumar Thakur1 Received: 14 March 2018 / Revised: 20 August 2018 / Accepted: 19 October 2018 © Society for Environmental Sustainability 2018
Abstract The present study was conducted on the floristic composition, structure, diversity and biomass of understorey vegetation in the dry tropical forest of Achanakmaar Amarkantak Biosphere Reserve (AABR) of India using phyto-sociological analysis in each forest type by randomly laying ten sample plots of 1 × 1 m size. The herbs were enumerated for their girth and height in sampling plots. The structure, diversity and biomass of herb communities were analyzed at forest type level and the study found 2919 plant individuals belonging to 66 species, 62 genera and 31 families. The most important family as determined by the Family Importance Value (FIV) was Poaceae in herbs layer. In terms of Importance Value Index (IVI), the herb Arthraxon hispidus (Poaceae) was the most vital species in the herbaceous community. The present study revealed that the density of herbaceous community ranged from 0.40 to 244.80 herbs ha−1 in various forest types, Basal area was recorded highest in Sal mixed forest (0.00373 m2 ha−1) and lowest was found in Bamboo forest (0.00188 m2 ha−1). The number of species in different forests varied from 14 to 32. Similarly, the Shannon index values in different forest types varied from 2.18 to 3.64, Simpson index values ranged from 0.045 to 0.17, the values of species richness from 16.69 to 30.52 and species evenness ranged from 0.81 to 0.95 in herb vegetation of different forest types. Shannon index values recorded in Sal mixed forest and Bamboo forest were found to be minimum. In contrary, Bamboo forest recorded maximum dominance of species as compared to other forests. Interestingly, beta diversity values ranged from 3.12 to 7.36 and it was observed to be highest in Bamboo forest and lowest in Sal mixed forest. However, the total herbaceous biomass varied from 86.28 g m−2 to 321 g m−2. The study recommends adopting intensive conservation measures especially in the open mixed forest and immature Teak plantations. In addition to it, encouraging and improving sal regeneration in sal mixed forests will not only help in reducing the biotic pressure but also in restoring and conserving the fragile dry tropical forest ecosystems of India. Keywords Achanakmaar Amarkantak Biosphere Reserve · Biomass · Family importance value · Phytodiversity · Species richness · Tropical forest
Introduction The wealth of flora and fauna reflects the natural heritage of biodiversity. Taking in view the immense ecological and economic significance, Achanakmaar Amarkantak Biosphere Reserve (AABR) was declared as 14th biosphere reserve of India. Interestingly, the United Nations Educational, Scientific * Tarun Kumar Thakur
[email protected];
[email protected] 1
Department of Environmental Science, Indira Gandhi National Tribal University (IGNTU), Amarkantak, Madhya Pradesh 484887, India
and Cultural Organization (UNESCO) also recognized the Amarkantak Biosphere reserve as one of the world’s heritage sites. However, biodiversity is being increasingly threatened largely because of various factors such as environmental degradation by unprecedented anthropogenic activities like overexploitation of natural resources, deforestation, mining, infrastructure development, and human settlements leading to fragmentation and degradation of habitats, and resultant loss of biodiversity. Tropical ecosystems are usually perceived to be rich biodiversity reserves (Brown 1996; Schimel 1995; Apguaua et al. 2015). Due to human activities such as pollution, over grazing and land alterations, floral diversity in these forests varies from place to place directly affecting the structure,
13
Vol.:(0123456789)
composition, diversity, productivity, and consequently altering the global ecology (FAO 1995; King et al. 1997; Sundarapandian and Karoor 2013). The herbaceous community is an essential component of forest ecosystems which associates a large area of total floristic composition, diversity and stand structure (Gentry and Dodson 1987; Gentry and Emmons 1987; Mayfield and Daily 2005; Tchouto et al. 2006) providing ecosystem services such as harvest gums, resins, oilseeds, grasses, flowers, seeds, medicinal herbs, bamboos, canes, edible foods like Mahua, fruits, nuts, mushrooms, wild leafy vegetables, tubers, etc. (Gentry and Emmons 1987; Hirao et al. 2009). Herbaceous vegetation stimulates community dynamics and succession patterns (Newbery et al. 1999; Royo and Carson
Fig. 1 Study area and location of field study of Achanakmaar Amarkantak Biosphere Reserve
13
Environmental Sustainability
2006) which affect the nutrient cycling, biomass and productivity (Nilsson and Wardle 2005). Moreover, understory composition usually varies considerably among different forest types (Hart and Chen 2008). Forest stand, structure and composition is very important to understand forest ecosystems (Ozcelik 2009; Naidu and Kumar 2016). The herbaceous vegetation is only a small quantity of the total biomass in the forest ecosystems, however, herbs play an important role in shaping the ecological characteristics of the forests (Ovington 1955; Whittaker 1966). Interestingly, Thakur (2007) reported that herbaceous layer constitutes 0.28–0.68 Mg ha−1 year−1 of the total forest biomass and contributes 3.0–6.75% to the total stand’s net production.
Environmental Sustainability
According to Forest Survey of India (FSI) (2015) the total forest cover of India is 21.34% of the geographical area. The very dense forest (VDF) class constitutes 2.61 percent, the moderately dense forest (MDF) class constitutes 9.59% and the open forest (OF) class constitutes 9.14% of the total forest cover of total geographical area of the country. It represents 11.4% of the world flora (Arisdason and Lakshminarasimhan 2016). In India 54% and 37% of tropical forests are classed as dry and moist deciduous forests respectively (Krishnamurthy et al. 2010; FSI 2015). Moreover, the amount, the rate and intensity of land use and land cover are very high in dry tropical forest ecosystems of Chhattisgarh and Madhya Pradesh states in India. The pressure on land resources has greatly increased over the last few decades in the region due to increase in population and enhanced demands for food, fodder, firewood, timber, medicine, fiber, etc. (Thakur et al. 2014). Earlier studies have focused on the response of herbaceous communities to biomass productivity, litterfall along with the environmental gradients (Struik and Curtis 1962; Anderson et al. 1969; Chandrasekaran and Swamy 2002; Shirima et al. 2015), whereas others highlighted the structural aspects of herbaceous layer such as biomass (Zavitkovski 1976). Interestingly, the undulating topography with varying degree of slopes of hills covered with dense Sal forests, Sal mixed forests, mixed forests, Bamboo brakes and manmade plantations harbor a large number of flora and fauna in and around Amarkantak. Moreover, many species are reported to be endemic to the region thus making it a rich repository of many useful plants and animals mainly edible, medicinal and aromatic plants and non-timber forest products (NTFPs). A lot of work has been carried out on the understory vegetation of the AABR which mostly comprises of tree structure, medicinal plants; however little attention was paid on understory vegetation, especially on herbaceous communities. The present study is done to characterize vegetation structure and diversity of groundstorey
vegetation of AABR, India. This data will help to characterize groundstorey vegetation, especially helping in assessing the regeneration status of overstorey composition, which will be the most important and vital information to maintain the composition and condition of the crop by suitable silvicultural and management practices.
Materials and methods Study area The study was conducted in AABR during November 2015–November 2016, one of the natural heritage sites, mainly falling in Bilaspur district of Chhattisgarh, India. It is located between 22°15′–22°58′ North latitudes and 81°25′N–82°5′ East longitudes. The AABR area includes Maikal hill ranges, the junction of Vindhya and Satpura hill ranges. The biosphere reserve falls in Malayan realm, Tropical Dry Deciduous Forest Biome and Deccan Peninsular biogeographic zone of the country. Its total geographical area is 383551.0 ha. The core zone which falls in Bilaspur district of Chhattisgarh state (CG) is a dense forest with terrains of hills and valleys and spread over in an area of 55,155 ha. The biosphere area experiences typical monsoon climate with three distinct seasons, summer from March till June, rainy from July till October and winter from November till February. Generally, May and June are the hottest months, whereas December and January are the coldest months of the year when minimum temperature reaches to 10 °C. The mean temperature in January is about 21 °C; and in May, the temperature rises between 31 and 33 °C. The mean annual temperature ranges between 21 and 31 °C. The annual rainfall of the area is about 1624.3 mm, distributed over average annual rainy days (range 71–118 days). The altitude varies from 450 to 1102.27 m above mean sea level (MSL) with the highest point being Damgarh (1102.27 m). The soils
Table 1 GPS locations, habitat types and other attributes of sampling sites Forest type Sal mixed forest
Coordinates
Lat. 22°37′22.69″ Long. 81°39′35.69″ Dense mixed forest Lat. 22°38′52.46″ Long. 81°41′45.68″ Teak plantation Lat. 22°37′49.82″ Long. 81°39′45.76″ Open mixed forest Lat. 22°38′26.56″ Long. 81°40′37.37″ Lat. 22°36′12.06″ Bamboo Brakes Long. 81°29′39.77″
Elevation (m) Sub-climax species (arranging in ascending order according to dominance) 1053
Arthraxon hispidus, Ageratum conizoides, Commelina diffusa, Colocasia esculenta
1032
Arthraxon hispidus, Rungia pectinata, Phyllanthus nirui Curcuma angustifolia, Sida acuta
1040
Arthraxon hispidus, Evolvulus nummularius, Lindernia dubia, Phyla nudiflora, Oxalis corniculata, Scoparia dulcis
1046
Arthraxon hispidus, Macardonia procumbence, Phyllanthus nirui, Oxalis corniculata, Rungia pectinata, Sida acuta
809
Rungia pectinata, Evolvulus nummularius, Smithia conferta, Oxalis corniculata, Phyllanthus nirui, Ocimum gratissimum
13
Table 2 Herbaceous composition of dry tropical forest ecosystem of AABR
13
Environmental Sustainability
1 2 3 4 5 6 7 8 9 10 11 12 13 14 15 16 17 18 19 20 21 22 23 24 25 26 27 28 29 30 31 32 33 34 35 36 37 38 39 40 41 42 43 44 45 46 47 48 49 50 51
Common name
Scientific name
Family
Abundance
Pulpuli grass Kharmor Tinpaniya Maskani Bhui amla Kharatti Bariyari Ratolia Kubbi Naichi bhaji Kaniya kanda Kena Salparni Cigar plant Pihri chara Jangli Tulsi Dubia Ghueen Chui mui Meethi buti Chkoda Kurie Brahmi Kevkand Nagar motha Ghuia Jungli sama Chauli Chirchita Bara Tikhur Hirankhuri Kangni Baiga sikiyab Jangli marua Kanghi Jangli pyaj Jungli dhania Kal megh Chench Sitab Soli Gul mehndi Wanak Amahaldi Khal muriya Bhrangraj Kutki Akarkara Haddi mushli Chanchu
Arthraxon hispidus Rungia pectinata Oxalis corniculata Evolvulus nummularius Phyllaanthus nirui Sida acuta Sida cordeta Phyla nudiflora Ageratum conizoides Smithia conferta Dioscorea oppositifolia Commelina diffusa Desmodium gangeticum Cuphea balsamina Macardonia procumbence Ocimum gratissimum Lindernia dubia Fimbristylis littoralis Mimosa pudica Scoparia dulcis Cassia tora Bidense pilosa Bacopa monnieri Dioscorea bulbifera Cyperus gracilis Colocasia esculenta Echinochloa colona Alysicarpus monilifer Achyranthus aspera Flemingia sp. Curcuma angustifolia Emilia sonchifolia Cetaria pumela Digitari divaricatissima Eleusine indica Blainvillea acmella Urgenia indica Eryngium foetidum Andrographis paniculata Corchorus trilloularis Ruta graveolens Aeschynomene americana Impatiens balsamina Murcielago orchioides Curcuma amada Tridex procumbensis Eclipta alba Panicum antidotale Spilanthes paniculata Chlorophytum borivilianum Corchorus fascicularis
Poaceae Acanthaceae Oxalidaceae Convolvulaceae Euphorbiaceae Malvaceae Malvaceae Verbenaceae Asteraceae Fabaceae Dioscoreaceae Commelinaceae Fabaceae Lythraceae Scrophulariaceae Lamiaceae Linderniaceae Cyperceae Fabaceae Plantaginaceae caesalpiniaceae Asteraceae Plantaginaceae Dioscoreaceae Poaceae Araceae Poaceae Fabaceae Amaranthaceae Fabaceae Zingiberaceae Asteraceae Poaceae Poaceae Poaceae Asteraceae Liliaceae Apiaceae Acanthaceae Tiliaceae Rutaceae Fabaceae Balsaminaceae Agavaceae Zingiberaceae Asteraceae Asteraceae Poaceae Asteraceae Asparangaceae Tiliaceae
1744.0 521.9 362.8 281.4 501.3 279.6 348.6 145.1 272.9 326.7 90.0 380.0 85.0 196.7 180.0 56.7 161.9 170.0 160.0 114.3 104.0 126.7 122.9 28.0 35.0 48.0 83.3 85.0 126.7 40.0 253.3 108.0 50.0 40.0 80.0 40.0 40.0 40.0 100.0 120.0 70.0 40.0 26.7 100.0 40.0 40.0 20.0 100.0 60.0 20.0 40.0
IVI 38.47 22.67 18.51 15.13 14.83 14 10.73 9.68 8.82 7.87 7.34 6.84 6.31 5.88 5.85 5.69 5.31 5.23 4.96 4.94 4.77 4.52 4.51 4.06 3.83 3.77 3.58 3.49 3.38 3.29 3.22 2.6 2.48 2.23 2.15 2.11 2.11 2.02 2.01 1.76 1.69 1.54 1.48 1.43 1.43 1.19 1.16 1.13 0.85 0.78 0.77
Environmental Sustainability Table 2 (continued) 52 53 54 55 56 57 58 59 60 61 62 63 64 65 66
Common name
Scientific name
Family
Abundance
IVI
Badi dudhi Ghooma Dudhali Sadabahar Safed murga Kev kand Grass lily Sarpgandha Chirinya Chirula Badranj boya Lal murga Patthar choor Katua shak Chand kal
Euphorbia hirta Leucas aspera Sopubia delphinifolia Periwinkle roseus Celosia argentea Costus speciosus Iphigenia indica Rauwolfia serpentina Peristrophe roxburghiana Aerva Lanata Nepeta cataria Crossandra infumdibuliformis Plectranthus mollis Alternanthera philoxeroides Macaranga peltata
Euphorbiaceae Lamiaceae Scrophulariaceae Apocynaceae Amaranthaceae Zingiberaceae Poaceae Apocynaceae Acanthaceae Amaranthaceae Lamiaceae Acanthaceae Lamiaceae Amaranthaceae Euphorbiaceae
40.0 60.0 20.0 40.0 20.0 40.0 40.0 60.0 60.0 80.0 60.0 20.0 40.0 80.0 20.0 9266.2
0.77 0.75 0.74 0.73 0.70 0.70 0.70 0.67 0.66 0.60 0.59 0.55 0.47 0.47 0.37 303.863
of the area are generally lateritic, alluvial and black cotton types, derived from granite, gneisses and basalt. Due to varied climatic, topographic and edaphic conditions, the reserve harbors unique and diverse flora and fauna. Vegetation of the forest area of the reserve represents tropical deciduous and can be further classified into Northern Tropical Moist Deciduous forests, Southern Dry Mixed Deciduous forests, Scrubs and Thorn forests and Ravinous vegetation. Shorea robusta (Sal) is predominantly found in moist deciduous forests, while species like Aegle, Terminalias, Bamboos, Ficus sp. and Dalbergia are commonly found in mixed forests. The location map of study area is depicted in Fig. 1.
Phytosociological analysis A line-transect (1 km N–S and E–W) survey was conducted in different forest types for determination of general floristic composition. The floral composition in each forest type was recorded to recognize dominant, codominant, and suppressed species.
Table 3 Species diversity indices for herb layer of different forest types of tropical forest of India
The phytosociological analysis in each forest type has been carried by randomly laying ten sample plots of 1 × 1 m size, and a total of 50 quadrants (10 in each forest type) were laid in the various forests for herbaceous layers. The data was analyzed for density, abundance, frequency and basal area following the methods of Curtis and McIntosh (1950) and Whittaker (1972). The importance value index (IVI) was determined as the sum of relative frequency, relative density and relative dominance (Phillips 1959). Family importance vegetation index and diameter class-wise distribution were calculated for each selected plots in different forests and were compared. To assess the ecological importance of different species and recognize the organizations of plant communities, the primary and secondary phytosociological analyses of vegetation has been done using phytosociological data collected from sample plots. Primary analysis was performed to observe absolute values of different parameters like density, frequency, abundance, basal area and mean height; and in the secondary analysis, the relative values of these primary variables were computed to derive IVI values for
Forest type
S
S/N
H′
□
D
E
β
Teak forest Sal mixed forest Dense mixed forest Open mixed forest Bamboo forest
24 33 29 31 14
0.23 0.32 0.28 0.30 0.13
2.86 3.64 3.16 3.25 2.18
0.059 1.45 0.051 0.045 0.17
30.52 24.76 24.31 23.76 16.69
0.816 0.939 0.94 0.95 0.83
4.29 3.12 3.55 3.32 7.36
S total number of species censused, S/N the rate of species increases per individual recorded, H′ Shannon– Wiener index. □ Simpson’s concentration index, D Margalef’s index of species richness, E Pielou’s evenness index, Β beta diversity
13
Environmental Sustainability
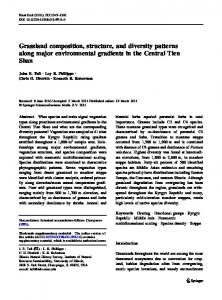
Fig. 2 Herbaceous layer communities in different forests of AABR
recognizing the predominant, codominant and suppressed communities.
Species diversity analysis Herbaceous diversity were determined using basal cover values, and diversity indices in various forest types were computed using following indices; Diversity index (Shannon and Weaver 1963) was used for the species diversity
13
H′ = − pi log 2 pi where pi is the proportion of total stand basal area represented by the ith species. Simpson’s concentration index was measured by Simpson index (Simpson 1949) Cd = (Ni/N)2 where, Cd is Simpson’s concentration of dominance, Ni is the IVI value of a species and N was the sum of total IVI values of all species in that forest type and it varies between 0 and 1; and Pielou’s evenness index was calculated by Pielou (1969), e = H′/In S; where H′ denotes to Diversity index and S presents number of
Environmental Sustainability
b
328.84
350
233.6
250 200 150
141.6
137.2 96.4
100
0.00373 0.00297
0.003
0.002367
0.0025
0.00188
0.002 0.0015 0.001 0
Sal mixed Teak forest
Dense mixed forest
Bamboo forest
Open mixed forest
Sal mixed Teak forest
35
25
24.76
1400 24.31
1200
23.76
1000
20
16.69
15 10
Open mixed forest
1210
1150 960 810
800 600
460
400 200
5 0
Bamboo forest
d
30.52
Frequency
Number of species
30
Dense mixed forest
Forest types
Forest types
c
0.00296
0.0005
50 0
0.004 0.0035
300
Basal area/m2
Number of herbs
a
0 Sal mixed Teak forest
Dense Bamboo mixed forest forest
Open mixed forest
Forest types
Sal mixed Teak forest
Forest types
Dense mixed forest
Bamboo Open mixed forest forest
Fig. 3 Density (a), Basal area (b), Species richness (c) and frequency (d) of dry tropical forests of AABR of India
species. Margaleaf’s index of species richness was intended by Margaleaf (1958) equation d = S − 1/In N, where S = total number of species, N = basal cover of all species ( m2 ha−1); and Beta diversity (BD) was calculated as (Whittaker 1972) BD = Sc/s; Where Sc = total number of species in all sites and s is average species per site. The various diversity indices were computed for different forest types to see the variation in plant diversity among different forest types. Attempts were also made to compute the parameters of diversity of each forest type in herbaceous vegetation. The modified family importance value (FIV) for each family was estimated as the sum of relative diversity and relative density of the individuals in that family. Species diversity and composition were compared among the five different forests to examine the variation of herbaceous composition in tropical dry forests of AABR.
Herbaceous biomass
calculated in the months of October–November 2016. Total fifty sampling plots of 1 m2 quadrants each were placed with line-transect method in different forest types. Herbs were clipped at ground level and sorted out into shoots and roots components.
Statistical analysis The significant difference between treatment means for all parameters of structure, diversity and herbaceous biomass were tested at P