987 The Journal of Experimental Biology 209, 987-993 Published by The Company of Biologists 2006 doi:10.1242/jeb.02124
Do honeybees detect colour targets using serial or parallel visual search? Johannes Spaethe*, Jürgen Tautz and Lars Chittka† Beegroup, Biozentrum, Department of Behavioral Physiology and Sociobiology, University of Würzburg, Germany *Present address: Center of Zoology, Department of Evolutionary Biology, University of Vienna, Austria Author for correspondence at present address: School of Biological and Chemical Sciences, Mile End Road, Queen Mary, University of London, London E1 4NS, UK (e-mail:
[email protected])
†
Accepted 24 January 2006 Summary In humans, visual search tasks are commonly used to present. These findings are characteristic of a serial search address the question of how visual attention is allocated in in primates, when stimuli are examined sequentially. We found no evidence for parallel search in bees, which would a specific task and how individuals search for a specific be characterized by a ‘pop out’ effect, in which the slope object (‘target’) among other objects (‘distractors’) that of decision time (and accuracy) over distractor number vary in number and complexity. Here, we apply the would be near zero. Additionally, we found that decision methodology of visual search experiments to honeybees, which we trained to choose a coloured disc (target) among time and number of errors were significantly higher when a varying number of differently coloured discs bees had to choose a blue target among yellow distractors compared with the inverse colour combination, a (distractors). We measured accuracy and decision time as phenomenon known as search asymmetry in humans. a function of distractor number and colour. We found that for all colour combinations, decision time increased and accuracy decreased with increasing distractor number, Key words: attention, visual cognition, colour vision, search asymmetries, foraging. whereas performance increased when more targets were
Introduction In most visually guided animals, the amount of information that is perceived by the peripheral system (the retina) exceeds the amount of information that can be processed by the brain by several orders of magnitude (Dukas, 1998). Therefore, animals have had to evolve behavioural strategies to extract significant information. A typical task in most animals’ daily life is to seek out a target (for example, a prey item, a predator, a mate) out of a multitude of other objects that might (at the time of any particular search) have no particular relevance. It is intuitively appealing that performance should vary with scene complexity, but the particular features that might impede searching a visual scene are poorly understood for non-human animals. In visual search tasks with human subjects, a subject has to report the presence or absence of a defined object (‘target’) among other objects (‘distractors’) that differ in one or more dimensions from the target on a computer screen (Treisman and Gelade, 1980). Search performance is measured as error rate (erroneously reporting the presence of the target when it is absent or failing to respond to target presence) and search reaction time (RT; time between the appearance of the objects and the decision of the subject about the presence/absence of the target). The efficiency of a visual search task can then be assessed by looking at
changes in performance and be measured as the slope of the regression line between RT or accuracy and distractor number (Wolfe, 2000; Itti, 2003). For the easiest tasks, where the target ‘pops out’, efficiency is unaffected by distractor number (‘parallel search’) and the correlation between RT and distractor number is found to be almost zero. For such target/distractor combinations, preattentive visual processing is assumed, i.e. no capacity limitation of visual processing exists (Neisser, 1967). In more difficult tasks, the slope becomes steeper, indicating that the entire visual information cannot be processed at once but attention has to focus on specific object features or on a confined area of the screen and information has to be processed sequentially (‘serial processing’). Although visual processing capacity is assumed to be limited in most animals, visual search experiments to understand the mechanisms of complex visual perception have been deployed only in humans and other primates so far (Bichot and Schall, 2002; Lee and Quessy, 2003). We apply the concept of visual search tasks to an invertebrate, the honeybee. Fitness and survival of a honeybee colony is strongly affected by the ability to efficiently exploit nectar and pollen sources. Bees often restrict their search to a small subset of available flower species occurring in their foraging range (Chittka et al., 1999). While flying over a meadow and
THE JOURNAL OF EXPERIMENTAL BIOLOGY
J. Spaethe, J. Tautz and L. Chittka B
A Target
Feeder
1.0
A
Decision line (grid)
Relative reflectance
988
0.8
Yellow
Light blue
White
Orange
0.6
Red Violet
0.4 Blue Background
0.2 0 300
400
500
600
700
Wavelength (nm) α=65°
B Entrance
B
Distractor
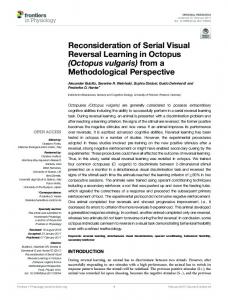
Fig.·1. Experimental setup. (A) Overview of the decision box. The shaded area indicates the subtended visual angle of the back wall for a bee at the box entrance. (B) Frontal view of the back wall (0.43⫻0.43·m) as it is seen from the entrance hole. Yellow object, target; blue objects, distractors; dotted line, grid.
Violet
Blue Light blue White
Background Red
searching for a specific flower species, a bee may detect several different flower types per second (Chittka et al., 1999) and thus the task of choosing the right flower and ignoring the others is not trivial. Materials and methods Experimental set-up Experiments were carried out at the University of Würzburg, Germany. Honeybees (Apis mellifera) were trained to visit a 1·mol·l–1 sucrose solution feeder placed inside a box (0.43⫻0.43⫻0.3·m) at an experimental site 50·m apart from the hives. The box was made of wood with a UV-transparent Plexiglas top and side walls and could be entered by the bees through an entrance hole (1.0·cm diameter) in the centre of the front wall (see Fig.·1). The wooden back wall was covered by green cardboard (for spectral reflectance, see Fig.·2) and contained 16 equidistant small openings (0.8·cm diameter; arranged in four rows and four columns), each with a feeder attached on the back. In front of each of the 16 openings, a coloured disc (8.0·cm diameter) with a central hole (0.8·cm) could be attached in a way that a bee could reach the feeder by entering the central hole of the disc. At a distance of 5·cm in front of the back wall, a grid with 16 squares made from fine wire (0.1·mm) marked an imaginary decision line (see below). When a bee entered the box, the 16 potential positions of a disc covered a visual field of 65° in the horizontal and 65° in the vertical extent. Each individual disc subtended between 15.0° (disc in the centre) and 12.4° (disc in the corner of the back wall) on the bee’s eye when viewed from the entrance hole.
U
Orange Yellow
G
Fig.·2. (A) Spectral reflection curves of the background and stimuli measured between 300·nm and 700·nm by means of an Ocean Optics S2000 spectrometer. (B) Loci of all used colour stimuli plotted in the colour hexagon. Distance between two loci is a measure of the beesubjective similarity of colours. For calculation and values, see Table·1 and Appendix.
Training procedure During the training phase, only a single disc (= target; yellow in experiments 1, 3 and 4; blue in experiment 2) was presented. Individually marked honeybees were trained to enter the box, to pass the decision line and then to enter the central hole of the disc to feed on the sucrose solution. Afterwards, the bees were released from the box. They returned to their hive, unloaded their forage and started a new foraging bout. Between bouts, the training disc was exchanged randomly between the 16 possible positions and was replaced after three visits by a new disc to prevent the bees from marking the discs by odour cues. The square of the grid where the bee first crossed the decision line (marked by the grid plane) was counted as the bee’s decision. It was scored as correct when the target was positioned at the same square and as wrong when it was at any other position. Only flights where the bee flew in a straight line from the box entrance towards
THE JOURNAL OF EXPERIMENTAL BIOLOGY
Visual search in honeybees the target were counted. Approach flights towards the distractors instead of the target were genuine errors, not exploratory behaviour: such flights never terminated in probing the distractor flowers. In some cases, the bee entered the box, turned around towards the entrance, performed a zigzag flight, turned around again and finally approached the target. Those flights were assumed to be orientation flights (Lehrer, 1991) and were excluded from further analysis. After a bee reached 80% or more of correct choices (but at least 20 bouts) the experiment was started. During the experimental phase, each foraging bout was filmed by a digital camera (Sony Handycam DCR-TRV7E) that was mounted on the top of the experimental box. Subsequently, the tapes were analysed frame by frame on a digital-tape recorder (Sony DHR-1000VC). For each foraging bout, the bee’s decision (passing the decision line at the correct or incorrect target position) and the decision time (defined as the time between entering the experimental box and crossing the decision line) was determined. Note that ‘decision time’ is not identical to ‘reaction time’ (RT) measured in human psychological experiments because it is not possible to determine RT in bees directly (see Discussion). Stimuli spectral properties The discs were painted with acrylic paint and subsequently covered with a mat lacquer to minimize reflection. We used seven different colours: white, yellow, orange, red, blue, light blue and purple (Fig.·2). A piece of green cardboard was used as background and covered the entire back wall. Because the spectral sensitivity of the bee’s and the human’s photoreceptors differs substantially [in contrast to us, bees are sensitive to UV light (Kühn, 1927)], we have to apply a bee-specific colour space that allows us to quantify colour contrasts between targets and background in a bee-subjective manner (Chittka et al., 1992). A second significant difference between bees and humans is in the type of achromatic channel used: bees possess an achromatic neuronal channel that uses only the green receptor signal as input (Giurfa et al., 1996). Both channels – the colour contrast and green contrast channel – are deployed depending on the visual angle of the object. If the subtended visual angle of the object is above 15°, colour contrast is used; for smaller visual angles, bees deploy the green contrast alone or the green contrast in combination with the colour contrast (Giurfa et al., 1996; Giurfa and Vorobyev, 1998). Therefore, we quantify colour contrast and green contrast of the objects to the background using the colour hexagon as a bee-specific colour space (Chittka, 1992) (see Appendix for calculation and values). The values for contrast between all stimuli and their background are shown in Table·1. Experiment 1 In the first experiment, we tested the occurrence of a popout effect, i.e. a parallel processing of visual information when target and distractor differ only in one dimension, namely colour. Individual bees were first trained to choose a single yellow target. After they reached a level of 80% or more correct choices, we presented five target/distractor
989
Table 1. Green contrast and colour contrast against the background of all stimuli are calculated using the colour hexagon model and the spectral sensitivity curves from the three receptor types of the worker honeybee Stimulus colour Blue Light blue Orange Red Violet White Yellow
Colour contrast
Green contrast
0.20 0.13 0.25 0.15 0.24 0.14 0.38
–0.19 0.20 0.02 –0.29 –0.23 0.31 0.22
combinations, each for five foraging bouts: first the yellow target only, then the yellow target and one blue distractor, the yellow target and three blue distractors, the yellow target and eight blue distractors, and finally the yellow target and fifteen blue distractors. For each individual bee and each target/ distractor combination we calculated the proportion of incorrect choices and mean decision time. Experiment 2 In the second experiment, we tested whether honeybees show a search asymmetry in target detection, e.g. if search time or error rate changes significantly when the colour of the target and distractor is interchanged. Search asymmetry is a common phenomenon of many feature searches found in human perception (Wolfe, 2001). The experimental procedure was similar to experiment 1 except that the bees were trained to choose a blue target among yellow distractors. Experiment 3 In experiment 1 and 2, the distractors were uniform in colour. In this experiment, we tested the bee’s search performance when the distractors are in mixed colours. We used a yellow target with distractors of five different colours – white, orange, light blue, blue and purple – presented in a randomly mixed composition. All colours differ significantly in green and colour contrast from the target and thus the bees were easily able to discriminate the target from all distractors deploying either colour contrast or green contrast (Fig.·2B; Table·1). Experiment 4 One way to perform a serial search is to focus attention on a confined area of the visual field, compare the properties of the objects within this area with the features of the sought-after target, and move the attention to the adjacent area if no concurrence is found (Tsal, 1983; Humphreys and Bruce, 1989). As soon as the target is identified, the search is terminated. We tested the deployment of this kind of serial search in bees by presenting one, two or four targets in a total number of 16 objects. The experimental procedure was similar to that of experiment 1. After a bee reached 80% of correct choices, we presented for five foraging bouts a yellow target
THE JOURNAL OF EXPERIMENTAL BIOLOGY
J. Spaethe, J. Tautz and L. Chittka
Data analysis All statistical tests were performed in SPSS 10.0.7. To analyse data from experiments 1–3, analyses of variance (twoway mixed ANOVA) were carried out using distractor number as within-subject factor, target–distractor combination as between-subjects factor and decision time or error rate as dependent variables. The Scheffé test was used for post hoc comparisons between target–distractor combinations. A Spearman rank-correlation coefficient was used to examine the strength of interaction between distractor number and decision time or error rate. To test whether decision time or error rate changed with target number (experiment 4), we used the Friedman test for non-parametric data. All frequency data were arcsine transformed prior to analysis. Results We trained individual honeybees to choose a coloured disc (target) among a varying number of differently coloured discs (distractors) that were presented simultaneously on a square board. We measured accuracy (proportion of correct choices) and decision time (time between when a bee could see the discs for the first time until it chose one) as a function of distractor number (one, three, eight or 15) and colour. Three colour combinations were tested: (1) blue target and yellow distractors, (2) yellow target and blue distractors and (3) yellow targets and mixed-coloured distractors. Experiments 1–3 The bees learned very rapidly to enter the experimental box and fly straight to the target when only the target was presented. After they reached a high level of accuracy (at least 80% of correct choices) the experiment was started (see Materials and methods). Both factors, ‘target–distractor combination’ and ‘distractor number’, were found to have a significant effect on decision time (distractor number, P=0.005; target–distractor combination, F4,11=6.98, F2,14=9.99, P=0.002) and error rate (distractor number, F4,11=9.63, P=0.001; target–distractor combination, F2,14=7.19, P=0.007). In the correlation analysis, we found a significant increase in decision time or error rate with increasing target number for a blue target among yellow distractors (decision time, rs=0.90, P=0.037; error rate, rs=0.98, P=0.005), as well as a yellow target with blue distractors (decision time, rs=0.90, P=0.037; error rate, rs=0.98, P=0.005; Fig.·3). No significant correlation was found
2.4 Decision time (s)
and 15 blue distractors, for five bouts two targets and 14 distractors, and for another five bouts four targets and 12 distractors. All target/distractor positions were changed between bouts and chosen in a random order. In case bees use a serial search mode as described above, we expected that they would terminate their search earlier and make less errors when target number increases because the average time until they focus their attention on an area containing a target decreases proportionately with an increase in target number.
Distractor: Yellow Blue Mixed
A
2.0 1.6 1.2 0.8 0.8
B 0.6 Error rate
990
0.4 0.2 0 0 1
3
8 Distractor number
15
Fig.·3. (A) Decision time and (B) error rate plotted against distractor number. Both search time and error rate increased with increasing distractor number for all three target/distractor combinations. Number of tested bees is five for the blue target/yellow distractor combination and six for the others. Values are means ± s.e.m.
when presenting a yellow target and multicoloured distractors (decision time, rs=0.60, P=0.29; error rate, rs=0.63, P=0.25). However, a Friedmann test for this experiment showed that both decision time (2=13.01, d.f.=4, P=0.011) and error rate (2=15.67, d.f.=4, P