Science of the Total Environment 640–641 (2018) 117–126
Contents lists available at ScienceDirect
Science of the Total Environment journal homepage: www.elsevier.com/locate/scitotenv
Bioindication of human-induced soil degradation in enclosed karst depressions (dolines) using Ellenberg indicator values (Classical Karst, Slovenia) Mateja Breg Valjavec a,⁎, Matija Zorn a, Andraž Čarni b,c a b c
Anton Melik Geographical Institute, Research Centre of the Slovenian Academy of Sciences and Arts, Novi trg 2, SI-1000 Ljubljana, Slovenia Jovan Hadži Biological Institute, Research Centre of the Slovenian Academy of Sciences and Arts, Novi trg 5, SI-1000 Ljubljana, Slovenia University of Nova Gorica, Vipavska 13, Rožna Dolina, SI-5000 Nova Gorica, Slovenia
H I G H L I G H T S
G R A P H I C A L
A B S T R A C T
• EIV reaction is the best bioindicator of soil degradation in dolines. • EIV reaction can best predict C/N and sulphur (S) soil parameters. • EIV results can be refined by the use of diagnostic species.
a r t i c l e
i n f o
Article history: Received 31 December 2017 Received in revised form 23 May 2018 Accepted 23 May 2018 Available online xxxx Keywords: Karst Waste Landfilling Diagnostic plants Grasslands Ellenberg indicator values
a b s t r a c t One of the frequently used bioindication methods is Ellenberg indicator values (EIVs), which are commonly applied in Central Europe as bioindicators of ecological characteristics. However, very few studies have tested EIVs as a bioindication of human-induced soil degradation. We tested the ability of EIVs to distinguish between localities of degraded karst depressions (dolines) and localities of seminatural (agricultural) soils in preserved dolines on the Kras Plateau (Classical Karst, SW Slovenia). We compared the results of bioindications of soil nutrient content (N), soil reaction (R) and soil moisture (M) with measured soil parameters. Low values of organic carbon, a slightly alkaline soil reaction and low organic sulphur content are chemical indicators of soil degradation in dolines, in comparison with preserved reference dolines (high organic carbon, slightly acid reaction, higher S). EIV reaction is the most reliable plant indicator value that can distinguish between degraded and non-degraded soil plots. According to a regression tree, sulphur (S) and C/N are the most important factors for division on the basis of EIV reaction. By applying the EIV reaction of diagnostic plant species, we significantly improved bioindication of soil degradation, although in the case of EIV nutrients, bioindication was not improved. © 2018 Published by Elsevier B.V.
⁎ Corresponding author. E-mail address:
[email protected] (M. Breg Valjavec).
https://doi.org/10.1016/j.scitotenv.2018.05.294 0048-9697/© 2018 Published by Elsevier B.V.
118
M. Breg Valjavec et al. / Science of the Total Environment 640–641 (2018) 117–126
1. Introduction Human-induced land degradation of soils causes various disturbances (García-Ruiz et al., 2017; Breure et al., 2018) in grassland communities. Human-induced changes in abiotic elements (e.g., soil texture, moisture) can thus also be reflected in vegetation (Raduła et al., 2018). Bioindication is therefore a common approach to assessing and evaluating land use and vegetation changes indirectly over short or long periods of time (Breg Valjavec et al., 2017; Breg Valjavec et al., 2018), including changes that cause negative trends (degradation) in soil and vegetation development (Erdős et al., 2017).Vascular plants are a widely used indicator tool for deducing environmental conditions from vegetation data and are commonly used as indirect indicators of soil, climatic, ecological, or even geological conditions. They are therefore considered to be effective in biomonitoring (Nowak et al., 2017). Indicator values reflect the realized optima of plant species expressed as ordinal numerals (Diekmann, 2003). They are not based on precise measurements, but on the extensive field experience of plant ecologists. They are used in various fields, including as the basis for ecological research (Anschlag et al., 2017), species and community distribution (Čarni et al., 2017), pollution (Britton et al., 2017) and several other fields. Plants are also efficient bioindicators in agricultural ecosystems (Szymura et al., 2016). Weed communities are used as bioindicators of arable land (Carlesi and Bàrberi, 2017) and for the assessment of soil pollution in terrestrial ecosystems (Čurlík et al., 2016; Klink et al., 2016). One of the frequently used bioindication methods is Ellenberg indicator values (EIVs) (Ellenberg et al., 1992), which are commonly applied in Central Europe as bioindicators of ecological characteristics. The theory of ecological niches of plant species provides the basis for the use of bioindication with EIVs, whereby the species composition of a given community allows the characterization of various types of environment: forest (Szymura et al., 2014), grasslands (Chytrý et al., 2009; Schaffers and Sýkora, 2000), mires (Navrátilová et al., 2017) or barren rock in colliery waste tips (Woźniak and Błońska, 2009). In addition to mineral soil, EIVs are also applicable for coarse woody debris (Chmura et al., 2017), characterization of the paleoenvironment (Nowak et al., 2017) and degradation of the environment (Breg Valjavec et al., 2017). The concept of EIVs is widely used to detect habitat conditions of a particular locality. Using plants as bioindicators has several advantages over soil measurements conducted in the laboratory: (i) lower cost and time; (ii) the possibility of predicting several soil parameters from the same floristic survey; (iii) the fact that the floristic community represents the integrated expression of values of abiotic variables, which can vary with high frequency in time and space (e.g., soil nitrogen) (Zonneveld, 1983); and (iv) in the absence of past direct measurements in stands, bioindication becomes essential for evaluating long-term environmental changes when numerous old floristic inventories are available (Falkengren-Grerup, 1989; Diekmann and Dupré, 1997; Lameire et al., 2000; Pinto et al., 2016). However, very few studies have tested the value of EIVs as a bioindication of soil degradation caused by waste landfilling. EIVs were originally designed for the flora of Germany, but they are also often applied in surrounding countries in the subcontinental part of Central Europe, e.g., in the Czech Republic, Poland and Slovakia, although some species show differences in their ecological behaviour in different geographical areas (Szymura et al., 2014). The different behaviour of species in different regions and the appearance of other species have initiated the elaboration of several sets of indicator values in various European countries, e.g., Ukraine (Didukh, 2011), Switzerland (Landolt et al., 2010), Italy (Pignatti et al., 2005), Greece (Böhling et al., 2002), United Kingdom (Hill et al., 1999), Hungary (Borhidi, 1995) and Slovakia (Jurko, 1980). Slovenia is situated in a transitional zone, in the sub-Mediterranean biogeographical region, between the Central European and Mediterranean regions (Frey and Lösch, 2010; Perko et al., 2015), in which Ellenberg and Pignatti indicator values are equally often used (Košir et al., 2013; Breg Valjavec et al., 2017).
EIVs are often used in environmental sciences, because environmental conditions can be assessed without direct measurement (Diekmann, 2003). Bioindication with EIVs can be applied for the determination and assessment of the dimensions of environmental changes (Zonneveld, 1983), which are often a consequence of human-induced land degradation, including in sites of enclosed karst depressions (solution dolines). Very few studies (e.g., Breg Valjavec et al., 2017) have tested the predictive values of EIVs in combination with measured soil parameters as a bioindication of soil degradation in sub-Mediterranean karst landscapes. Bioindication based on EIVs provides a valuable tool for indirectly assessing environmental gradients, so there is a need to test this method in various landscapes and vegetation formations. The aim of the research was to determine the ability of EIVs to recognize and evaluate human-induced soil degradation in localities that have been transformed by landfilling. We studied dolines (Fig. 1), enclosed karst depressions (Williams, 2004) that, according to Ford and Williams (2007), are considered “diagnostic” landforms in karst landscapes. Throughout history, dolines have been adapted to suit farming needs in some areas (e.g., in Slovenia). More recently, the traditional land use in these landforms has been abandoned and, in many cases, dolines have been filled with waste. This human-induced land degradation can have negative impacts on the vulnerable karst environment (Iván and Mádl-Szőnyi, 2017; Gutiérrez et al., 2014; Parise et al., 2015; Parise, 2012; van Beynen and van Beynen, 2011; Parise and Pascali, 2003; Parise et al., 2008). Secondly, we compared the results of bioindications of EIV nutrition content (N), soil reaction (R) and soil moisture (M), with selected measured soil parameters (Bartelheimer and Poschlod, 2016). These three values are the most relevant in the succession of grassland communities (Schaffers and Sýkora, 2000; Chytrý et al., 2009). To examine the reliability of bioindication, the average values of EIVs were correlated with mean values of measured soil parameters. If the correlation was weak or absent, bioindication was assumed to have performed poorly. Calibrations of EIVs based on permutation tests also exist, but we did not use them, because we avoided analyses relating mean EIVs with other variables derived from the species composition, since this can produce highly biased results, thus leading to misinterpretation (Zelený and Schaffers, 2012). In order to improve the reliability of bioindication and to predict degradation of soils, we included the EIV of diagnostic plants. We compared the ability of bioindication of average EIV diagnostic plants with the EIV for all plants from plot inventories. 2. Materials and methods 2.1. Study area Dinaric karst plateaus (SE Europe, western Balkan Peninsula; Mihevc et al., 2010) are regions in which soil is a deficient resource. Micro-oases of deeper soils can be found in dolines. These are enclosed land surface depressions with internal drainage typically formed in karst environments (Ford and Williams, 2007). Water, air, sediments and soil converge in a doline and the morphology of the doline thus affect water flow movement, soil erosion and accumulation, soil moisture and depth, and air temperature and humidity (Hofierka et al., 2018). With global warming, the bottom of dolines may play an especially important role in the preservation of cool-adapted plant species that are rare or absent from surrounding areas (Bátori et al., 2017). Dolines are considered “diagnostic” karst landforms (Ford and Williams, 2007) and are numerous (up to 14,000 or app. 40/km2) (Breg Valjavec et al., 2018) on the Kras Plateau (also referred to as the “Classical Karst” (Fig. 1; Gams, 1993; Kranjc, 1997; Ford and Williams, 2007); SW Slovenia). The soils in the levelled doline bottoms are deep (up to 3 m) and moist. Geochemical analyses of doline sediments have revealed that they contain on average over 50% of SiO2, followed by Al2O3 (20%).
M. Breg Valjavec et al. / Science of the Total Environment 640–641 (2018) 117–126
119
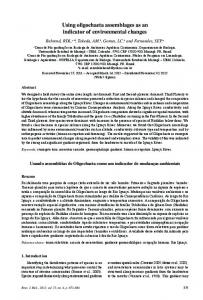
Fig. 1. Study area map shows sampling plots (red bullets) inside homogenous study area of Kras Plateau (marked in orange). (For interpretation of the references to color in this figure legend, the reader is referred to the web version of this article.)
Other oxides (Fe2O3, CaO, MgO, K2O) have been found below 10% (Fabec, 2012). The study area is located on the northwest edge of the Dinaric Mountains. The climate is sub-Mediterranean (Köppen-Type Cfa), with average January temperatures above 0 °C, average July temperatures above 20 °C and annual precipitation between 1400 and 1500 mm. The Kras Plateau consists of karstified Mesozoic limestone, covered predominantly by rendzinas and cambisols (Vrščaj et al., 2017). The zonal vegetation of the area is forest dominated by Ostrya carpinifolia and Quercus pubescens. In dolines, due to the special microclimate and accumulation of soil, forest dominated by Fagus sylvatica, Carpinus betulus, Fraxinus excelsior and Tilia cordata (Poldini, 1989; Dakskobler, 2006) can also be found. After the extensive deforestation that occurred centuries ago (Gams, 1993), karstic pastures (Carex humilis-Centaurea rupestris community) and karstic meadows (Danthonia calycina-Scorzonera villosa community) appeared. Central European mesic grasslands dominated by Arrhenatherum elatius prevail in dolines (Kaligarič, 1997; Kaligarič et al., 2006; Kaligarič and Ivajnšič, 2014). For this study, twenty-three (23) waste-filled dolines were selected in an environmentally homogeneous part of the Kras Plateau. Degraded dolines were determined by using a time series of historical aerial photographs from the 1970s until 2000 (Breg Valjavec, 2014; Breg Valjavec and Zorn, 2015; Breg Valjavec et al., 2018) and further field control. Three main consequences of doline landfilling were recognized: (1) a concave landform levelled with the surrounding surface (Fig. 2: 1B); (2) complete sealing of soils; (3) land cover and vegetation change recognizably (in aerial photographs or in the field) in a circular grassland vegetation pattern that more or less (depending on the intensity of degradation) differs from the surrounding vegetation. We used an additional 11 dolines (non-degraded, still concave) as reference plots, representing the reference soil and grassland vegetation (mesic grassland communities).
2.2. Vegetation and topsoil sampling A field survey of plant composition was conducted during the optimal season in all 34 study plots for vegetation sampling (May–June). We recorded all vascular plants (Martinčič, 2007) present on the thirty-four square study plots (100 m2) in the middle of dolines (Fig. 2: 2A, 2B) and estimated their abundance on a seven-point scale (Braun-Blanquet, 1964). A mixed topsoil sample was taken from each study plot in order to analyse the chemical and physical soil properties (Čarni et al., 2007). The mixed sample consisted of 10 samples taken by hand auger to a depth of 10 cm and then mixed. The samples were taken in accordance with ISO 11464 and the following characteristics were measured (Appendix T1-2): the pH value of CaCl2 was determined according to ISO 14235, the total carbon, nitrogen and sulphur in accordance with ISO 10694, ISO 13878 and ISO 15178, mineral C in accordance with ISO 10693, organic C indirectly by subtracting mineral carbon from total carbon, and grain size analyses of the soil samples (determination of particle size distribution in mineral soil material - sieving and sedimentation method) in accordance with SIST ISO 11277. In relation to the main goal, we studied changes of EIV values among different ages (succession up to 30 years) and correlations with measured soil parameters. We measured only the main factors; we did not study all factors and their relation with EIV (Breg Valjavec et al., 2017; Szymura et al., 2016; Schaffers and Sýkora, 2000).
2.3. Statistical analyses 2.3.1. Vegetation composition We constructed a data table with the plant species (273) identified on the 34 study plots (34 × 273), which was subjected to numerical analysis. We transformed the cover values into percentages and square
120
M. Breg Valjavec et al. / Science of the Total Environment 640–641 (2018) 117–126
Fig. 2. The diagrams show profiles (1A) and ground plans of a doline (2A) and a waste-filled (degraded) doline (1B, 2B) that has been levelled with the surrounding surface. The position of the study plot within the doline for the survey of plant species and topsoil samples is seen in 2A and 2B.
roots for this purpose. Classification was then carried out using PC-ORD (McCune and Mefford, 1999), run in the JUICE 7.0 program (Tichý, 2002). A dendrogram was prepared using the beta flexible 0.25 method and Bray-Curtis distance as a measure of resemblance. We used the phi coefficient as a fidelity measure of species to an individual cluster for defining diagnostic species. We also calculated Fischer's exact test and gave a zero fidelity value to a species with p N 0.05. The threshold phi value set for the species to be considered diagnostic was 0.35 (Chytrý et al., 2002). 2.3.2. Soil parameters We calculated the effect of individual measured soil parameters on plant species composition. Since the first detrended correspondence analysis (DCA) axis was N3 SD, we performed canonical correspondence analysis (CCA) with 999 permutations, in order to calculate the effect of an individual measured soil parameter on plant species composition. Forward selection of explanatory variables was used to provide a ranking of the importance of specific variables and to avoid co-linearity (ter Braak and Šmilauer, 2012) (Appendix T1). Prior to analysis, we checked the distribution by Shapiro-Wilk test and performed transformation, if it was needed, to get a normal distribution (Table 2). 2.3.3. EIV bioindication We tested the ability of EIVs to distinguish between localities of degraded soils in waste-filled dolines and localities of soils in semi-natural (agricultural) dolines. We compared the results of bioindications of nutrition content (N), soil reaction (R) and soil moisture (M) with measured soil parameters. We tested the correlation between EIVs and measured traits based on all plants and diagnostic plants. Unweighted (on the basis of the presence/absence of species) EIVs were calculated for each sample. It was decided to use unweighted calculation, since the influence of dominant species can disguise differences (Dierschke, 1994). We used the Kruskal-Wallis test by ranks and median for non-normal distributions and also made post-hoc comparisons of mean ranks of all pairs of groups (Siegel and Castellan, 1988) using Statistica software (StatSoft, 2011).
We calculated the Spearman-Rank correlation to assess the correlation between EIVs, in order to measure the interdependence (Table 4). To improve the reliability of bioindication, we determined diagnostic plants for degraded and non-degraded plots. We calculated EIVs based on all species shown in the table, also taking into account diagnostic species (fidelity above 0.35). We calculated the correlation on the level of all 34 plots and all 273 plants. We used the regression tree method to explore the simultaneous effect of measured potentially non-linear environmental factors on EIVs (moisture, nutrient, reaction). The analysis was performed on raw data. The optimum tree size was determined using V-fold cross validation (v = 10) and the standard error rule was set at 0.1. The totals for each variable were expressed as a ratio of the largest sum found among all predictors, and only the most important variables are shown. 3. Results 3.1. Communities and topsoil of sampled plots Based on the numerical analyses of the floristic composition (Appendix T1-1), vegetation was divided into 11 reference study plots of seminatural mesic grasslands (Mg) in dolines and two groups of degraded plots: 11 mesic ruderal communities (Mr) and 12 dry ruderal communities (Dr). 3.1.1. Reference plots Semi-natural mesic grasslands located at the bottom of dolines expressed the highest content of nutrients (0.49% N, 0.0421% S), higher organic carbon and sulphur and lowest mean reaction (6.27) (Appendix T2) among recognized groups. They corresponded to neutrophilic vegetation. The topsoil consisted predominantly of silt (44 to 60.2%) and clay sized particles (30.9 to 51.9%), with fine silt prevailing (75%) and sand forming on average 8%. This group was dominated by Allium carinatum, Anthoxanthum odoratum, Aristolochia lutea, Bilderdykia convolvulus, Ferulago galbanifera, Helictotrichon pubescens, Knautia illyrica, Lathyrus pratensis, Rumex acetosa, Veronica chamaedrys.
M. Breg Valjavec et al. / Science of the Total Environment 640–641 (2018) 117–126
Degraded plots (Fig. 3) are in a 10–30-year-old succession process (Mr, Dr), which share high pH and high mineral carbon. Mesic ruderal grasslands prevailed on levelled terrain of waste-filled dolines (Fig. 2), in which heterogeneous construction waste has been overlaid by a thin layer of allochthonous sediments, which has resulted in diverse vegetation and topsoils. In general, the topsoil (Appendix T1) was undeveloped; the sand fraction prevailed (19.9 to 54.6%). It can be assumed that clay minerals have already leached into lower “horizons” of buried waste material. The measured average topsoil values for sand, silt and clay were 34.9, 36.3 and 26.95%, respectively. Past disturbance was also demonstrated by low nutrient values (N: 0.09–0.62%, S b 0.014% in 82% of samples), as well as by ruderal species (see Appendix T1-1). Dry ruderal grasslands have developed on plots of waste-filled dolines, in which the topsoil layer consists of more dry debris, construction waste and clay-silt excavation material, which is the basis for succession. In view of the average content of silt (44%) and clay (42%), it can be assumed that this material has originated in surrounding dolines (Appendix T1). The ecological conditions are severe; nutrient values are the lowest (N: 0.17–0.44%, S b 0.014%). These habitats are “mixed” and colonized by species of the surrounding dry grasslands and ruderal plants. Diagnostic species are listed in Appendix T1-1.
3.2. Relationships between EIV and measured soil parameters Significant positive correlations were found between EIV moisture and nutrients (0.799) at p b 0.001 and significant negative correlations between EIV reaction and moisture (−0.661) (Table 1), so communities growing on plots with an acidic reaction have higher demand for moisture and nutrients, and vice versa. According to the Kruskal-Wallis test of statistical significance (Table 2), potential bioindicators to distinguish mesic grasslands from degraded ruderal communities could be EIV reaction and moisture, while nutrients enable distinction within ruderal communities, thus between mesic (Mr) and dry ruderals (Dr). The measured soil parameters of organic carbon, pH and sulphur were identified as the best chemical indicators for showing vegetation changes due to human-induced land degradation (Table 2).
121
Table 1 Values of Spearman rank correlations between EIV moisture, EIV reaction and EIV nutrients in studied species plots.
EIV moisture EIV reaction
EIV reaction
EIV nutrient
−0.661⁎ –
0.799⁎ n.s.
n.s. not significant. ⁎ p b 0.001.
Sulphur (S) and C/N are the most important factors for division along the EIV reaction (Appendix F4). The first level division is influenced by sulphur (S) and the second by the C/N proportion. More degraded (Mr) plots with lower C/N values can be found, whereas in the group with a higher C/N ratio, there was a mixture of plots from Mr and Dr, but these are distinguished at the third level by a higher clay content. The most important factors for division along the EIV moisture scale, are mineral carbon and C/N (Appendix F5). At the first level (Table 3), exclusively Dr plots possess a higher proportion of C/N. The group with a lower C/N proportion, composed from all three groups, is further divided based on mineral carbon. There is less mineral carbon in Mg plots and more in Mr and Dr plots. The EIV nutrient regression tree is divided by six levels (Table 3), mostly influenced by nitrogen, C/N, C organic and soil humidity (Appendix F6). The first level division is based on C/N proportion. Mg and Dr plots are distinguished on the highest level, which are further divided by C/N, whereby a higher proportion of Dr can be found in the part in which the C/N proportion is higher. On the first level of division, the C/N proportion is lower in a mixture of plots from all three groups. From these rather mixed groups, two Mr plots are firstly distinguished based on a lower content of N. On the next level, two plots (Mg and Dr) are distinguished based on a higher proportion of clay. The remaining core group is further divided based on N: two Dr plots appear at lower values and Mg and Mr plots at higher values. The latter group is further divided on the basis of fine silt and two Mg are distinguished at higher values. The final division is based on mineral carbon, whereby higher values can be found in Mr plots and lower in Mg plots.
3.3. Bioindication with EIV of diagnostic plants
Fig. 3. Detrended correspondence analysis (DCA) of plots with measured soil parameters (1: Mg; 2: Mr; 3: Dr).
According to the Spearman correlation coefficient, the most significantly strong correlations were found among EIV nutrients of diagnostic species in relation to C/N and soil low humidity species. The EIV reaction expresses the most numerous correlations with measured soil parameters. Positive correlations were found with pH, Cmin and the sand fraction. Negative correlations were found in relation to Corg, S and the fine silt fraction. The EIV reaction of diagnostic plants expressed higher positive correlations with sulphur, and negative correlations with C/N, in comparison to all plants. A weak but significant correlation was also found with Cmin. The EIV moisture for diagnostic species showed significant correlations with sulphur and C/N, with both being higher than the EIV moisture of all species. Based on the average EIV reaction of all species and EIV reaction of diagnostic species, degraded plots (Mr, Dr) can be distinguished from non-degraded plots (Mg). EIV nutrients (Fig. 4) show the biggest differences between groups of mesic plots (Mg, Mr) and dry plots (Dr). Dry plots have much lower values of nutrition than mesic grasslands, while mesic ruderals express the highest values. There are almost no differences among plots containing all species and plots containing diagnostic species. EIV moisture shows the biggest differences between groups of mesic plots (Mg, Mr) and those of dry plots (Dr). As with EIV nutrients, dry plots have much lower values than mesic grasslands, while mesic ruderals express the highest values.
122
M. Breg Valjavec et al. / Science of the Total Environment 640–641 (2018) 117–126
Table 2 Mean values of measured soil parameters at the level of individual groups (Mg, Mr, Dr), all inventories and parameter transformations (for extended table see Appendix T2). Significance of p value in the interval: *p b 0.05, **p b 0.01, ***p b 0.001. Mg
Mr
Dr
Total
Mean values of measured soil parameters pH 6.27 Cmin 0.34 Corg 5.65 C/N 11.61 N 0.49 S 0.0421 Dry humidity 4.44 Sand (%) 8.05 Coarse silt (%) 11.2 Fine silt (%) 39.68 Clay (%) 41.08
7.11 2.87 2.69 10.22 0.26 0.014 2.63 34.9 11.59 24.43 26.95
7.15 1.59 3.2 12.5 0.26 0.014 3.55 13.52 13.48 30.5 42.51
7.08 1.66 3.83 11.40 0.33 0.022 3.45 19.13 12.06 31.51 37.28
Mean Ellenberg indicator values Light 7.06 Temperature 5.89 Continentality 5.23 Moisture 4.23 Reaction 6.49 Nutrients 4.60
7.29 5.99 5.33 4.22 6.53 4.32
7.39 6.07 5.38 3.79 6.62 3.43
7.26 5.98 5.32 4.07 6.54 4.09
4. Discussion 4.1. Soil parameters as indicators of degradation in dolines The studied region of carbonate Kras Plateau is covered by species rich calcifillous dry grasslands (Kaligarič et al., 2006) “clipped” by thousands of dolines (mean land surface 1000 m2) that host semi-natural mesic grasslands. Concave doline landforms with levelled bottoms are zones of intensive accumulation of fine-grained silty soils. In the studied degraded dolines, the natural environment has been changed by landfilling, mostly with construction and demolition waste. Since the concave landform no longer exists, water accumulation decreases. The newly developed plant communities are more adapted to dry
Significance of p value in interval Mg-Mr
Mg-Dr
***
**
Transformation Mr-Dr
**
LOG LOG BC / BC LOG / BC / / LOG
***
/ / / / / /
** ***
**
** ** *** ***
** ***
*** *
*
***
*
**
* **
**
** *
conditions, a lower content of nutrients (nitrogen, sulphur) and weaker soil structure. Nutrients, reaction and moisture EIV (Szymura et al., 2014) proved to be connected with specific soil parameters and are indicative of the land degradation of dolines. In degraded plots, the topsoil is not yet criss-crossed with roots, as the main source of organic carbon, and the structure of the soil profile has not yet developed; there is not as much hygroscopic water between the soil particles as within a developed soil profile. Undeveloped degraded soil also contains more sand and coarse silt, while developed soil at the bottom of dolines (Mg) contains more fine silt and clay. Less developed initial soil that begins to form at the top of the debris layer has a higher pH value because positive ions are drained into the lower horizons (decalcification) in developed
Table 3 Results of regression tree for EIVs moisture, nutrients and reaction (see Appendix F4, F5 and F6 for the Importance graphs).
Moisture
Nutrients
Reaction
Node
Left branch
Right branch
Size of node
Node mean
Node variance
Split variable
Split constant
1 2 4 5 3 1 2 4 5 6 8 9 10 12 13 11 7 3 14 15 1 2 4 5 6 7 3
2 4
3 5
C/N N
11.9 0.135
6 8
7 9
Clay N
43,3 0.19
10 12
11 13
Fine silt C min
47,1 1.545
14
15
C/N
12,7
2 4
3 5
S C/N
0.037 10.15
6
7
0.107910 0.086416 0.045963 0.052241 0.037547 0.596813 0.394069 0.019450 0.306026 0.225158 0.00000 0.154185 0.122461 0.012869 0.121049 0.067600 0.360000 0.293438 0.191878 0.108656 0.078130 0.050259 0.028139 0.035863 0.024578 0.024578 0.061136
12.7 1.47
3 5
4.123235 4.203571 4.371875 3.979167 3.748333 4.285000 4.671429 5.450000 4.488235 4.581333 3.810000 4.70000 4.785455 5.052500 4.632857 4.230000 3.79000 3.660769 4.007143 3.256667 6.552353 6.619655 6.845714 6.547727 6.5436154 6.436154 6.162000
C/N C min
2 4
34 28 16 12 6 34 21 4 17 15 2 13 11 4 7 2 2 13 7 6 34 29 7 22 13 9 5
Clay
40.1
M. Breg Valjavec et al. / Science of the Total Environment 640–641 (2018) 117–126
Fig. 4. EIV moisture, reaction and nutrients for all species in comparison to EIV for diagnostic species (1: Mg-reference plots; 2: Mr-mesic ruderals; 3: Dr-dry ruderals).
123
124
M. Breg Valjavec et al. / Science of the Total Environment 640–641 (2018) 117–126
soil (Blume et al., 2016) and so the substrate no longer has a significant impact on the pH value. All of these parameters indicate the soil development in the succession process. Based on interpretation of the EIV results, the measured soil parameters can be considered an indication of degradation. Among the tested parameters, organic carbon, pH and sulphur were identified as the best chemical indicators for showing vegetation changes due to human-induced land degradation. Ruderal (weed) communities, which are commonly used for the assessment of soil pollution in terrestrial ecosystems (Čurlík et al., 2016; Klink et al., 2016), appear on dry and mesic ruderal plots of degraded dolines. The first communities (Dr) correspond to younger succession stages and the second (Mg) to older succession stages, so the time of succession must be considered to be an important factor in bioindication of land degradation. Ruderal vegetation, which starts growing on a newly degraded site, is the initial succession stage. It is highly dependent on the moisture conditions. 4.2. EIV indicators of degradation in dolines Plants integrate all relevant factors in time and space, and actual measurements provide snapshots (Zonneveld, 1983; Zelený and Schaffers, 2012; Szymura et al., 2014). EIVs are often used in environmental sciences, because environmental conditions can be assessed without direct measurement (Diekmann, 2003). Bioindication with EIVs can be applied for the determination and assessment of the dimensions of environmental changes (Zonneveld, 1983), which are often a consequence of human-induced land degradation, including in sites of dolines. EIVs are species-based and reflect local environmental conditions (Diekmann et al., 2014) also in the case of soil disturbances caused by human-induced land degradation in dolines. There are reasons why bioindication could perform better than instrumental measurements of ecological factors. Plants used for bioindication can be presumed to ‘measure’ what is relevant for them accurately, while instrumental measurements depend on arbitrary choices of the researcher (e.g., sampling procedures, analytical methods, choice of measured factors) (Szymura et al., 2014). Direct measurement of soil properties is important because these properties have different predictive power for the status of secondary succession than plant functional traits, plant chorotypes and EIVs (Paušič and Čarni, 2013). EIV reaction proved to be a universal EIV indicator in the case of doline degradation. It was the most reliable measure to distinguish reference plots of non-degraded soils from plots of degraded soils. According to regression tree results (Table 3) and identified correlations (Tables 2, 4), the mean EIV reaction is a good indicator for many measured parameters. According to Szymura et al. (2014), the average values of EIV assigned as an indication of a particular soil characteristic are influenced by multiple ecological factors acting together and this could bias bioindication. The regression tree method, as a more flexible one, was able to detect such an effect influencing the average values of EIVs
Table 4 Spearman correlation coefficient between mean EIVs (considering all plants and diagnostic plants) and measured soil parameters. Only significant results are shown (p b 0.05). Measured parameters Cmin (log) Corg N (BC) C/N Moisture S pH (log) Sand Coarse silt Fine silt Clay
EIV nutrients All
−0.65 −0.42
Diagnostic
−0.64 −0.42
0.39
0.39
−0.54
−0.57
EIV reaction
EIV moisture
All
Diagnostic
All
0.44 −0.35 /
0.36 −0.51 −0.51
−0.36
−0.40 −0.43 0.41 0.37
−0.53 −0.49 0.41 0.44
−0.46
−0.51
Diagnostic
−0.34
−0.37
0.37
0.46
(Szymura et al., 2014). The EIV reaction is mostly influenced by C/N and sulphur, which proved to be the best soil indicators of degraded soils in dolines. The first level division for EIV reaction (Table 3) was influenced by sulphur (S); clearly showing that the content of sulphur is higher in the topsoil of reference plots (mesic grasslands) than in the topsoil of degraded plots. Sulphur (S) is one of the four major nutrients, together with nitrogen, phosphorus and potassium, required for plant growth (Grant et al., 2012). Sulphur exists in soil in organic and inorganic forms. Organic sulphur is the main S fraction in soil, contributing up to 95% of the total S (Piotrowska-Długosz et al., 2017; Kertesz and Mirleau, 2004). In general, the most important factors for distinguishing plots along the EIV reaction are sulphur, C/N and clay fraction content. There was no significant correlation between EIV reaction and measured nitrogen at the level of all studied plants but significant negative correlations were shown between the EIV reaction of diagnostic plants and measured nitrogen. Some significant correlations between EIV reaction and measured parameters were even improved by the use of diagnostic plants as predictors of land degradation. The mean EIV reaction showed the most significant positive correlations with pH, Cmin and sand, while significant negative correlations were found with Corg, S and the fine silt fraction. According to the Spearman correlation coefficient (Table 4), all three parameters are most correlated with EIV reaction (Corg: −0.35, S: −0.43, pH: 0.41) and correlations were even higher when considering only diagnostic plants (Corg: −0.51, S: −0.49, pH: 0.41). Based on the average EIV reaction (Fig. 4) of all species and diagnostic species, degraded plots (Mr, Dr) can be distinguished from non-degraded plots (Mg). Dry ruderal plots express the characteristics of young communities. The C/N ratio suggests a lack of nitrogen in Dr communities, with there being more of it in Mr and Mg communities. This was demonstrated by strong significant correlations of EIV nutrients with measured C/N (−0.65) and measured soil dry humidity (−0.42) (Table 4). During the degradation process, a reduction in the proportion of sand can be observed. According to Nadal-Romero et al. (2016) C/N indicates the lack of nitrogen in dolines that have been filled with dry concrete debris (Dr plots). The regression tree shows the complex relationship between measured soil properties and EIV nutrients. There are many interrelations among measured soil properties, so the distinction is sometimes very difficult to explain. 5. Conclusions The concept of EIVs can be used as a reliable low-cost method for the prediction and study of human-induced soil degradation in vulnerable karst landscapes. Testing the concept on the Kras Plateau demonstrated that degraded plots (Mr, Dr) can be distinguished from reference plots (Mg) based on average EIV reaction. Bioindication by EIV reaction can be refined by the use of diagnostic species. The EIV reaction can be used as a bioindicator of C/N ratio, sulphur and soil pH, as well as some other parameters. EIV moisture and EIV nutrients are indicators of younger succession plots, indicating a low availability of organic soil compounds (S, N, Corg) and lower humidity. Additionally, EIV nutrients enable distinction within ruderal communities, between dry and mesic. The most important factors for distinctions with EIV moisture are mineral carbon and C/N. To establish more detailed biomonitoring with EIV, additional sampling of soil and vegetation in different seasons, different climatic conditions (temperature, moisture etc.) should be performed. The approach could be applied in environments in which humaninduced land disturbances can change environmental conditions drastically, especially the availability of soil water and nutrients. Supplementary data to this article can be found online at https://doi. org/10.1016/j.scitotenv.2018.05.294.
M. Breg Valjavec et al. / Science of the Total Environment 640–641 (2018) 117–126
Acknowledgment The research was financed by the Slovenian Research Agency (ARRS) through research programs Geography of Slovenia (P6-0101) and Biodiversity: patterns, processes, predictions and conservation (P1-0236). We wish to thank Mr. Iztok Sajko for help with the figures. References Anschlag, K., Tatti, D., Hellwig, N., Sartori, G., Gobat, J.M., Brol, G., 2017. Vegetation-based bioindication of humus forms in coniferous mountain forests. J. Mt. Sci. 1414 (4): 662–673. https://doi.org/10.1007/s11629-016-4290-y. Bartelheimer, M., Poschlod, P., 2016. Functional characterizations of Ellenberg indicator values–a review on ecophysiological determinants. Funct. Ecol. 30 (4):506–516. https://doi.org/10.1111/1365-2435.12531. Bátori, Z., Vojtkó, A., Farkas, T., Szabó, A., Havadtői, K., Vojtkó, A.E., Tölgyesi, C., Cseh, V., Erdős, L., Maák, I.E., Keppel, G., 2017. Large- and small-scale environmental factors drive distributions of cool-adapted plants in karstic microrefugia. Ann. Bot. 119: 301–309. https://doi.org/10.1093/aob/mcw233. Blume, H.P., Bruemmer, G.W., Fleige, H., Horn, R., Kandeler, E., Kögel-Knaber, I., Kretzschmar, R., Stahr, K., Wilke, B.M., 2016. Scheffer/Schachtschabel Soil Science. Springer, Berlin https://doi.org/10.1007/978-3-642-30942-7. Böhling, N., Greuter, W., Raus, T., 2002. Zeigerwerte der Gefäßpflanzen der Südägäis (Griechenland). Indicator Values of the Vascular Plants in the Southern Aegean (Greece). Barun-Blanquetia 32 (108 pp.). Borhidi, A., 1995. Social behaviour types, the naturalness and relative ecological indicator values of the higher plants in the Hungarian flora. Acta Bot. Hungar. 39 (1–2), 97–181. Braun-Blanquet, J., 1964. Pflanzensoziologie. Grundzüge der Vegetationskunde. Springer, Wien. Breg Valjavec, M., 2014. Study of filled dolines by using 3D stereo image processing and electrical resistivity imaging. Int. J. Speleol. 43 (1):57–68. https://doi.org/10.5038/ 1827-806X.43.1.6. Breg Valjavec, M., Zorn, M., 2015. Degraded karst relief: waste-filled dolines. Adv. Environ. Res. 40, 77–95. Breg Valjavec, M., Ribeiro, D., Čarni, A., 2017. Vegetation as the bioindicator of humaninduced degradation in karst landscape: case study of waste-filled dolines. Acta Carsologica 46 (1):95–110. https://doi.org/10.3986/ac.v46i1.4712. Breg Valjavec, M., Zorn, M., Čarni, A., 2018. Human-induced land degradation and biodiversity of karst landscape: on the example of karst depressions (dolines). Land Degrad. Dev. (submitted). Breure, A.M., Lijzen, J.P.A., Maring, L., 2018. Soil and land management in a circular economy. Sci. Total Environ. 624:1125–1130. https://doi.org/10.1016/j.scitotenv.2017.12.137. Britton, A.J., Hester, A.J., Hewison, R.L., Potts, J.M., Ross, L.C., 2017. Climate, pollution and grazing drive long-term change in moorland habitats. Appl. Veg. Sci. 20 (2): 194–203. https://doi.org/10.1111/avsc.12260. Carlesi, S., Bàrberi, P., 2017. Weeds as soil bioindicators: how to sample and use data. FertilCrop Technical Note. Research Institute of Organic Agriculture, Scuola Superiore Sant'Anna, Frick, Pisa http://orgprints.org/31696/1/Carlesi-Barberi-2017bioindicators-TechnicalNote-FertilCrop.pdf, Accessed date: 30 December 2017. Čarni, A., Košir, P., Marinšek, A., Šilc, U., Zelnik, I., 2007. Changes in structure, floristic composition and chemical soil properties in a succession of birch forests. Period. Biol. 109 (1), 13–20. Čarni, A., Mastnak, N.J., Dakskobler, I., Kutnar, L., Marinšek, A., Šilc, U., 2017. Prediction of the appearance of tree of heaven in forest communities in western Slovenia. Period. Biol. 119 (4):261–283. https://doi.org/10.18054/pb.v119i4.4483. Chmura, D., Żarnowiec, J., Staniaszek-Kik, M., 2017. Do Ellenberg's indicator values apply to the vascular plants colonizing decaying logs in mountain forests? Flora 234:15–23. https://doi.org/10.1016/j.flora.2017.06.008. Chytrý, M., Tichý, L., Holt, J., Botta-Dukát, Z., 2002. Determination of diagnostic species with statistical fidelity measures. J. Veg. Sci. 13 (1):79–90. https://doi.org/10.1111/ j.1654-1103.2002.tb02025.x. Chytrý, M., Hejcman, M., Hennekens, S.M., Schellberg, J., 2009. Changes in vegetation types and Ellenberg indicator values after 65 years of fertilizer application in the Rengen Grassland Experiment, Germany. Appl. Veg. Sci. 12 (2):167–176. https:// doi.org/10.1111/j.1654-109X.2009.01011.x. Čurlík, J., Kolesár, M., Ďurža, O., Hiller, E., 2016. Dandelion (Taraxacum officinale) and agrimony (Agrimonia eupatoria) as indicators of geogenic contamination of flysch soils in eastern Slovakia. Arch. Environ. Contam. Toxicol. 70 (3):475–486. https://doi.org/ 10.1007/s00244-015-0206-z. Dakskobler, I., 2006. Prispevek k poznavanju gozdne vegetacije Krasa (jugozahodna Slovenija). Annales, Series historia naturalis 16 (1), 57–76. Didukh, Ya.P., 2011. The Ecological Scales for the Species of Ukrainian Flora and Their Use in Synphytoindication. M.G. Kholodny Institute of Botany NAS of Ukraine, Kyiv http:// www.botany.kiev.ua/doc/diduh_monog.pdf, Accessed date: 30 December 2017. Diekmann, M., 2003. Species indicator values as an important tool in applied plant ecology – a review. Basic Appl. Ecol. 4 (6):493–506. https://doi.org/10.1078/1439-1791-00185. Diekmann, M., Dupré, C., 1997. Acidification and eutrophication of deciduousforests in northwestern Germany demonstrated by indicator species analysis. J. Veg. Sci. 8 (6):855–864. https://doi.org/10.2307/3237030. Diekmann, M., Jandt, U., Alard, D., Bleeker, A., Corcket, E., Gowing, D.J.G., Stevens, C.J., Duprè, C., 2014. Long-term changes in calcareous grassland vegetation in Northwestern Germany – no decline in species richness, but a shift in species composition. Biol. Conserv. 172:170–179. https://doi.org/10.1016/j.biocon.2014.02.038.
125
Dierschke, H., 1994. Pflanzensoziologie : Grundlagen und Methoden. Ulmer, Stuttgart (683 pp.). Ellenberg, H., Weber, H.E., Düll, R., Wirth, V., Werner, W., Paulißen, D., 1992. Zeigerwerte von Pflanzen in Mitteleuropa. Datenbank. Scripta Geobotanica vol. 18. Goltze KG, Göttingen. Erdős, L., Bátori, Z., Penksza, K., Dénes, A., Kevey, B., Kevey, D., Megnes, M., Sengl, P., Tölgyesi, C., 2017. Can naturalness indicator values reveal habitat degradation? A test of four methodological approaches. Pol. J. Ecol. 65 (1):1–13. https://doi.org/ 10.3161/15052249PJE2017.65.1.001. Fabec, T., 2012. Geoarheološke lastnosti zapolnitev vrtač na Divaškem krasu (jugozahodna Slovenija) = Geoarchaeological nature of the doline infills in the Divača Karst region (SW Slovenia). In: Andrič, M. (Ed.)Dolgoročne spremembe okolja 1. ZRC Publishing, Ljubljana, pp. 43–54. Falkengren-Grerup, U., 1989. Soil acidification and its impact on groundvegetation. Ambio 18 (3), 179–183. Ford, D., Williams, P.W., 2007. Karst Hydrology and Geomorphology. Wiley, London. Frey, W., Lösch, R., 2010. Geobotanik: Pflanzen und Vegetation in Raum und Zeit. Spektrum, Heidelberg. Gams, I., 1993. Origin of the term “karst,” and the transformation of the Classical Karst (Kras). Environ. Geol. 21 (3):110–114. https://doi.org/10.1007/BF00775293. García-Ruiz, J.M., Beguería, S., Lana-Renault, N., Nadal-Romero, E., Cerdà, A., 2017. Ongoing and emerging questions in water erosion studies. Land Degrad. Dev. 28 (1): 5–21. https://doi.org/10.1002/ldr.2641. Grant, C.A., Mahli, S.S., Karamanos, R.E., 2012. Sulfur management for rapeseed. Field Crop Res. 128:119–128. https://doi.org/10.1016/j.fcr.2011.12.018. Gutiérrez, F., Parise, M., DeWaele, J., Jourde, H., 2014. A review on natural and humaninduced geohazards and impacts in karst. Earth Sci. Rev. 138:61–88. https://doi.org/ 10.1016/j.earscirev.2014.08.002. Hill, M.O., Mountford, J.O., Roy, D.B., Bunce, R.G.H., 1999. Ellenberg's indicator values for British plants. ECOFACT vol. 2. Institute of Terrestrial Ecology, Huntingdon. Hofierka, J., Gallaya, M., Bandura, P., Šašaka, J., 2018. Identification of karst sinkholes in a forested karst landscape using airborne laser scanning data and water flow analysis. Geomorphology 308:265–277. https://doi.org/10.1016/j.geomorph.2018.02.004. Iván, V., Mádl-Szőnyi, J., 2017. State of the art of karst vulnerability assessment: overview, evaluation and outlook. Environ. Earth Sci. 76. https://doi.org/10.1007/s12665-017-6422-2. Jurko, A., 1980. Ekologické faktory a klasifikácia syntaxónov. Zprávy České Botanické Společnosti 15, 87–92. Kaligarič, M., 1997. Rastlinstvo Primorskega krasa in Slovenske Istre: travniki in pašniki. Zgodovinsko društvo za južno Primorsko, Koper. Kaligarič, M., Ivajnšič, D., 2014. Vanishing landscape of the “classic” karst: changed landscape identity and projections for the future. Landsc. Urban Plan. 132:148–158. https://doi.org/10.1016/j.landurbplan.2014.09.004. Kaligarič, M., Culiberg, M., Kramberger, B., 2006. Recent vegetation history of the North Adriatic grasslands: expansion and decay of an anthropogenic habitat. Folia Geobot. 41 (3):241–258. https://doi.org/10.1007/BF02904940. Kertesz, M.A., Mirleau, P., 2004. The role of soil microbes in plant sulphur nutrition. J. Exp. Bot. 55 (404):1939–1945. https://doi.org/10.1093/jxb/erh176. Klink, A., Polechońska, L., Cegłowska, A., Stankiewicz, A., 2016. Typha latifolia (broadleaf cattail) as bioindicator of different types of pollution in aquatic ecosystems– application of self-organizing feature map (neural network). Environ. Sci. Pollut. Res. 23 (14):14078–14086. https://doi.org/10.1007/s11356-016-6581-9. Košir, P., Čarni, A., Marinšek, A., Šilc, U., 2013. Floodplain forest communities along the Mura River (NE Slovenia). Acta Bot. Croat. 72 (1):71–95. https://doi.org/10.2478/ v10184-012-0015-7. Kranjc, A. (Ed.), 1997. Kras: Slovene Classical Karst. ZRC Publishing, Ljubljana. Lameire, S., Hermy, M., Honnay, O., 2000. Two decades of change in the ground vegetation of a mixed deciduous forest in an agricultural landscape. J. Veg. Sci. 11 (5):695–704. https://doi.org/10.2307/3236576. Landolt, E., Bäumler, B., Erhardt, A., Hegg, O., Klötzli, F., Lämmler, W., Nobis, M., RudmannMaurer, K., Schweingruber, F.H., Theurillat, J.-P., Urmi, E., Vust, M., Wohlgemuth, T., 2010. Flora indicativa–Ecological Indicator Values and Biological Attributes of the Flora of Switzerland and the Alps. Haupt, Bern. Martinčič, A. (Ed.), 2007. Mala flora Slovenije. Tehniška založba, Ljubljana. McCune, B., Mefford, M.J., 1999. PC-ORD. Multivariate Analysis of Ecological Data. Version 5.0. MjM Software, Gleneden Beach. Mihevc, A., Prelovšek, M., Zupan Hajna, N. (Eds.), 2010. Introduction to the Dinaric Karst. Karst Research Institute at ZRC SAZU, Postojna. Nadal-Romero, E., Cammeraat, E., Pérez-Cardiel, E., Lasanta, T., 2016. Effects of secondary succession and afforestation practices on soil properties after cropland abandonment in humid Mediterranean mountain areas. Agric. Ecosyst. Environ. 228:91–100. https://doi.org/10.1016/j.agee.2016.05.003. Navrátilová, J., Hájek, M., Navrátil, J., Hájková, P., Frazier, R.J., 2017. Convergence and impoverishment of fen communities in a eutrophicated agricultural landscape of the Czech Republic. Appl. Veg. Sci. 20 (2):225–235. https://doi.org/10.1111/avsc.12298. Nowak, A., Yazykova, E., Nobis, M., Nikonov, A.A., 2017. Can vegetation provide indications of ancient lake shorelines after more than one hundred years? A case study of Iskander-kul Lake, Tajikistan. Ecol. Indic. 81:373–382. https://doi.org/10.1016/j. ecolind.2017.06.007. Parise, M., 2012. Management of water resources in karst environments, and negative effects of land use changes in the Murge area (Apulia). Karst Dev. 2, 16–20. Parise, M., Pascali, V., 2003. Surface and subsurface environmental degradation in the karst of Apulia (southern Italy). Environ. Geol. 44:247–256. https://doi.org/10.1007/ s00254-003-0773-6. Parise, M., Qiriazi, P., Sala, S., 2008. Evaporite karst of Albania: main features and cases of environmental degradation. Environ. Geol. 53:967–974. https://doi.org/10.1007/ s00254-007-0722-x.
126
M. Breg Valjavec et al. / Science of the Total Environment 640–641 (2018) 117–126
Parise, M., Ravbar, N., Živanović, V., Mikszewski, A., Kresic, N., Mádl-Szőnyi, J., Kukurić, N., 2015. Hazards in karst and managing water resources quality. In: Stevanovic, Z. (Ed.), Karst Aquifers – Characterization and Engineering. Springer, Berlin:pp. 601–687 https://doi.org/10.1007/978-3-319-12850-4_17. Paušič, A., Čarni, A., 2013. Records of past land use are best stored in soil properties. Plant Biosyst. 147 (3):654–663. https://doi.org/10.1080/11263504.2012.748100. Perko, D., Hrvatin, M., Ciglič, R., 2015. A methodology for natural landscape typification of Slovenia. Acta Geogr. Slov. 55 (2):235–270. https://doi.org/10.3986/AGS.1938. Pignatti, S., Menegoni, P., Pietrosanti, S., 2005. Bioindicazione attraverso le piante vascolari. Valori di indicazione secondo Ellenberg per le piante della flora d'Italia. Braun-Blanquetia 39, 3–95. Pinto, P.E., Dupouey, J.-L., Hervé, J.-C., Legay, M., Wurpillot, S., Montpied, P., Gégout, J.-C., 2016. Optimizing the bioindication of forest soil acidity, nitrogen andmineral nutrition using plant species. Ecol. Indic. 71:359–367. https://doi.org/10.1016/j. ecolind.2016.05.047. Piotrowska-Długosz, A., Siwik-Ziomek, A., Długosz, J., Gozdowski, D., 2017. Spatiotemporal variability of soil sulfur content and arylsulfatase activity at a conventionally managed arable field. Geoderma 295:107–118. https://doi.org/10.1016/j. geoderma.2017.02.009. Poldini, L., 1989. La vegetazione del Carso triestino ed isontino. Ed. Lint, Trieste. Raduła, M.W., Szymura, T.H., Szymura, M., 2018. Topographic wetness index explains soil moisture better than bioindication with Ellenberg's indicator values. Ecol. Indic. 85: 172–179. https://doi.org/10.1016/j.ecolind.2017.10.011. Schaffers, A.P., Sýkora, K.V., 2000. Reliability of Ellenberg indicator values for moisture, nitrogen and soil reaction: a comparison with field measurements. J. Veg. Sci. 11 (2): 225–244. https://doi.org/10.2307/3236802. Siegel, S., Castellan, N.J., 1988. Nonparametric Statistics for the Behavioral Sciences. McGraw-Hill, New York.
StatSoft, Inc., 2011. Electronic Statistics Textbook. Statsoft, Tulsa. Szymura, T.H., Szymura, M., Macioł, A., 2014. Bioindication with Ellenberg's indicator values: a comparison with measured parameters in Central European oak forests. Ecol. Indic. 46:495–503. https://doi.org/10.1016/j.ecolind.2014.07.013. Szymura, M., Szymura, T.H., Dradrach, A., Mikolajczak, Z., 2016. Biodiversity of grasslands of Stołowe Mountains National Park. Acta Sci. Polonorum Agricultura 15 (1), 69–82. ter Braak, J.F.C., Šmilauer, P., 2012. Canoco Reference Manual and User's Guide. Software for Ordination (version 5.0). Biometris, Wageningen, České Budějovice. Tichý, L., 2002. JUICE, software for vegetation classification. J. Veg. Sci. 13 (3):451–453. https://doi.org/10.1111/j.1654-1103.2002.tb02069.x. van Beynen, P.E., van Beynen, K.M., 2011. Human disturbance of karst environments. In: van Beynen, P. (Ed.), Karst Management. Springer, Dordrecht:pp. 379–397 https:// doi.org/10.1007/978-94-007-1207-2_17. Vrščaj, B., Repe, B., Simončič, P., 2017. The Soils of Slovenia. Springer, Dordrecht https:// doi.org/10.1007/978-94-017-8585-3. Williams, P., 2004. Dolines. In: Gunn, J. (Ed.), Encyclopedia of Caves and Karst Science. Fitzroy Dearborn, New York. Woźniak, G., Błońska, A., 2009. Bioindicative applicability of vegetation on post coal mine sites. Pol. J. Environ. Stud. 6, 127–131. Zelený, D., Schaffers, A.P., 2012. Too good to be true: pitfalls of using mean Ellenberg indicator values in vegetation analyses. J. Veg. Sci. 23 (3):419–431. https://doi.org/ 10.1111/j.1654-1103.2011.01366.x. Zonneveld, I.S., 1983. Principles of bio-indication. Environ. Monit. Assess. 3 (3–4): 207–217. https://doi.org/10.1007/BF00396213.