Indicator variables take on two values: one and zero. These values are used to ... The indicator variable simply signals a shift in the intercept of the regression line. .... The indicator variables allow us to construct forecasting equations for each region. .... We can also use a partial F test to determine if there is any difference ...
1 1.1
Using Indicator and Interaction Variables Using and Interpreting Indicator Variables
Indicator or dummy variables are a special type of variable used in a variety of ways. Indicator variables take on two values: one and zero. These values are used to indicate if an observation is within a group (1) or outside a group (0). As an example a dummy variable could be used to indicate if people are employed. There variable would be D1i
= 1 if individual i is employed = 0 if individual i is unemployed
The indicator used to indicate if people were unemployed would be the reverse of this D2i
= 1 if individual i is unemployed = 0 if individual i is employed
Thus, we can easily track any type of split into two groups using indicator variables. If we are dealing with more than two groups, we simply use multiple indicator variables. Suppose I was taking a survey of undergraduate business majors and I wanted to categorize the students by class. To do this, I would simply construct the following indicator variables: D1i
D2i
= 1 if student i is a freshman = 0 if student i is not a freshman = 1 if student i is a sophomore = 0 if student i is not a sophomore
D3i
= 1 if student i is a junior = 0 if student i is not a junior
D4i
= 1 if student i is a senior = 0 if student i is not a senior
Since we want to break the data into 4 groups, we needed to construct 4 indicator variables. An important note: when indicator variables are used in regressions where the data has been broken into m groups, we can only use m ¡ 1 indicator variables as explanatory variables. The one missing group can be considered the base group. ( There is also a huge problem with multicollinearity.) 1
How do we interpret indicator variables? Let's consider the following regression. y = ¯ 0 + ¯ 1 x1 + ¯ 2 D where D is an indicator variable coded as 1 if the observation is in a group and 0 if the observation is not in the group. Let's consider these two possibilities individually. Suppose we are dealing with an observation inside the group and D = 1. The regression equation takes the form y
= ¯ 0 + ¯ 1 x1 + ¯2 (1) = (¯ 0 + ¯ 2 ) + ¯ 1 x1
This is a simple line with and slope of ¯ 1 and an intercept equal to (¯ 0 + ¯ 2 ). Now consider an observation than is not in the group and D = 0. The regression equation takes the form y
= ¯ 0 + ¯ 1 x1 + ¯2 (0) = ¯ 0 + ¯ 1 x1
This is a simple line with and slope of ¯ 1 and an intercept equal to ¯ 0 . The indicator variable simply signals a shift in the intercept of the regression line. ¯ 2 represents how much of a shift in the regression line occurs when the observations are in a certain category. This interpretation makes it very easy to talk about possible di®erences between groups. If ¯ 2 is signi¯cantly di®erent from zero, tested by a hypothesis test, then we ¯nd evidence that the groups are di®erent. Let's now consider a couple of examples using indicator variables: 1.1.1
Employment Discrimination
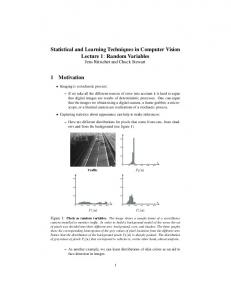
Regression analysis is frequently used to analyze cases of employment discrimination. The point of the exercise is always the same: test whether two groups have statistically signi¯cant di®erent wages. Evidence of di®erences in wages is evidence that employment discrimination is occurring. In this example we will study how indicator variables can be used to study employment discrimination. The data set harris7.xls contains a portion of the data used in a court case between the US Department of Treasury and Harris Savings Bank. This data set includes the salaries of 93 employees of the bank, their education level, and an indicator variables which indicates whether the employee is male (1) or female (0). Here is a scatter plot of the data.
2
9000
8000
7000
6000
SALARY
5000
MALES
4000
1 3000
0 6
8
10
12
14
16
EDUCAT
In the scatterplot, the circles denote female employees and the crosses denote male employees. The scatterplot seems to show that males seem to make higher salaries than females. To obtain a better measure of this possible di®erences, let's run the following regression model. SALARY = ¯0 + ¯1 ¤ ED + ¯ 2 ¤ M ALE + e where ED is the explanatory variable which tracks years of education and M ALE is a explanatory indicator variable which indicates if the employee is male. If we run this regression we will ¯nd the following estimated regression equation SALARY = 4173 + 80:7 ¤ ED + 691:8 ¤ M ALE How do we interpret this equation? 3
18
This equation says that salary increases by $80.70 for each year of education and that male employees, on average, make $691.80 more than female employees. Is this $692 large enough to be considered statistically signi¯cant. We simply want to test if ¯ 2 = 0 given the estimate b2 = 691:8. This hypothesis test has the following hypotheses: Null
:
¯2 = 0
Alternative
:
¯ 2 6= 0
If the null is accepted, then we conclude that the di®erence in salaries is not statistical di®erence. If the null is rejected, we are lead to believe that ¯ 2 6= 0 and there is evidence which supports the presence of discrimination. The decision rule for this test is (given 95% con¯dence): Reject the null if : Do not reject the null if :
jtj > 1:96 jtj · 1:96
For this test the test statistic t is: t=
b2 ¡ 0 691:8 = = 5:232 sb2 132:23
which is the t stat reported in the regression output. We reject the null hypothesis that ¯ 2 = 0 and conclude the it appears that, on average, males make signi¯cantly more than females even after controlling for education. Thus, on the basis of this regression, we believe Harris is engaging in employment discrimination. If you were a defense lawyer for Harris what could you do to counter this argument? 1.1.2
Meddicorp
The ¯rm, Meddicorp, wishes to study the relationship between sales and several other variables. The managers believe that three explanatory variables are important in forecasting sales: 1. Adverising (ADV) 2. Bonuses paid to ¯rms who use their products. (BONUS). 3. The region of the country: (REGION) The managers of Meddicorp prefer to break the country into three regions: South, West, and Midwest. To include the region in their sales forecast, they construct the following indicator variables. SOU T H
= 1 if territory is in the south = 0 if teritory is not in the south 4
W EST
M IDW EST
= 1 if territory is in the west = 0 if teritory is not in the west = 1 if territory is in the midwest = 0 if teritory is not in the midwest
As state previously, only two of these indicator variables may be used in the regression analysis. Suppose the Midwest is chosen as the base group for this analysis. If the managers wish to uses all of their available data, there sales forecast would take the following form y = ¯0 + ¯1 ¤ ADV + ¯ 2 ¤ BON U S + ¯ 3 ¤ SOU T H + ¯ 4 ¤ W EST + e After running their regression, they ¯nd the following estimated regression equation y = 435 + 1:37 ¤ ADV + 0:975 ¤ BON U S ¡ 258 ¤ SOU T H ¡ 210 ¤ W EST The indicator variables allow us to construct forecasting equations for each region. Let's construct these forecasts for each region SOU T H : yb = 435 + 1:37 ¤ ADV + 0:975 ¤ BON US ¡ 258 ¤ 1 ¡ 210 ¤ 0 yb = 435 + 1:37 ¤ ADV + 0:975 ¤ BON U S ¡ 258 yb = 177 + 1:37 ¤ ADV + 0:975 ¤ BON U S W EST : yb = 435 + 1:37 ¤ ADV + 0:975 ¤ BON U S ¡ 258 ¤ 0 ¡ 210 ¤ 1 yb = 435 + 1:37 ¤ ADV + 0:975 ¤ BON US ¡ 210 yb = 225 + 1:37 ¤ ADV + 0:975 ¤ BON US
M IDW EST : yb = 435 + 1:37 ¤ ADV + 0:975 ¤ BONU S ¡ 258 ¤ 0 ¡ 210 ¤ 0 yb = 435 + 1:37 ¤ ADV + 0:975 ¤ BON U S The slopes on the ADV and BONUS variables are the same in each region. The region di®erences show up in the intercept term. Consider the sale forecast yb given ADV = 500 and BON U S = 250. We would ¯nd: SOU T H W EST
M IDW EST
: yb = 177 + 1:37 ¤ 500 + 0:975 ¤ 250 = $1105:8 : yb = 225 + 1:37 ¤ 500 + 0:975 ¤ 250 = $1153:8 : yb = 435 + 1:37 ¤ 500 + 0:975 ¤ 250 = $1363:8
Now, suppose the managers want to know if these apparent di®erences in regions are statistically signi¯cant. If there is no signi¯cant di®erence between the regions then ¯3 = ¯4 = 0. Thus to test this possibility we will simply run an 5
F test between the full model with regions and the reduced model without the regions. The hypotheses for this test are: Null : Alternative :
¯3 = ¯ 4 = 0 At least one coe±cient is not zero.
The full mode for this test is y = ¯0 + ¯1 ¤ ADV + ¯ 2 ¤ BON U S + ¯ 3 ¤ SOU T H + ¯ 4 ¤ W EST The reduced model for this test is: y = ¯ 0 + ¯ 1 ¤ ADV + ¯ 2 ¤ BON U S The test statistic for this test is an F stat of the form F =
(SSER ¡ SEEF )=(K ¡ L) SSEF =(n ¡ K ¡ 1)
where in this case K = 4 and L = 2. If we run the two regression we ¯nd that SSEF
= 66414
SSER
= 181176
This our test statistic becomes F =
(181176 ¡ 66414)=(4 ¡ 2) = 17:3 66414=(93 ¡ 4 ¡ 1)
The decision rule for this test is: Reject the Null if : Do Not Reject the Null if :
F > F (®; K ¡ L; n ¡ K ¡ 1) F · F (®; K ¡ L; n ¡ K ¡ 1)
Let's consider a test with ® = 0:05, we ¯nd F (®; K¡L; n¡K¡1) = F (0:05; 2; 88) = 3:49: Since 17:3 > 3:49 we reject the null hypothesis and conclude that the regional di®erences are signi¯cant.
1.2
Interaction Variables
Another type of variable that is used in regression analysis is called an interaction variable. Consider a regression model with two explanatory variables: y = ¯ 0 + ¯1 x1 + ¯ 2 x2 + e Now suppose you want to include an interaction variable with is the product of the two explanatory variables x1 x2 This regression would take the form: y = ¯0 + ¯1 x1 + ¯ 2 x2 + ¯ 3 x1 x2 + e 6
Let's look closer at the model with the interaction variable. We can rewrite this regression as y = ¯ 0 + (¯ 1 + ¯ 3 x2 ) ¤ x1 + ¯ 2 x2 + e Now suppose, we have a one unit change in x1 . What will be the e®ect on y? y will change by ¯ 1 + ¯ 3 x2 units. The change in y depends on the change in x1 and the value of x2 . Movements in x1 and x2 are related or they are interacting in relationship to y. One of the most useful applications of interaction variables is to compare the slope of two regression lines. Consider our basic regression with an indicator variable D, y = ¯ 0 + ¯ 1 x1 + ¯ 2 D The indicator D = 1 if an item belongs to a certain group and D = 0 if the item is not in that group. Now add the variable representing the interaction between x1 and D, x1 D. Our regression becomes y = ¯ 0 + ¯ 1 x1 + ¯ 2 D + ¯ 3 x1 D This regression can be separated into two situations D = 1 and D = 0. When D = 1 we have y = ¯ 0 + ¯ 1 x1 + ¯2 (1) + ¯3 x1 (1) = (¯0 + ¯2 ) + (¯ 1 + ¯ 3 )x1 If D = 0 we have y = ¯ 0 + ¯ 1 x1 + ¯ 2 (0) + ¯ 3 x1 (0) = ¯ 0 + ¯ 1 x1 So the coe±cient ¯ 2 measures how much the intercept of the regression changes when an item is in a certain group, and the coe±cient ¯ 3 measures how much the slope of the regression changes when an item is in that same group. In some sense we have ¯t two lines with two di®erent intercepts and slopes using one regression. So, now not only can we test if there are any di®erences in the average value of the y variable for two groups, but we can also tell whether there is a di®erence in the slopes for the two groups. A t test on ¯3 can determine if the slopes di®er between two groups. We can also use a partial F test to determine if there is any di®erence between the regression line (intercept or slope) between two groups. Considering the above regression we would simply test the following hypotheses: Null : ¯ 2 = ¯ 3 = 0 Alternative : At least one of the coe±cients is not zero. Let's return to our employment discrimination example to see how we can use interaction variables. 7
1.2.1
More Employment Discrimination
In the previous example we found that on average males earn a higher salary than females even after taking into account education. Now suppose we ask the following question. Does the di®erence in average incomes between males and females increase with education. We use interaction variables to address this question. We need to incorporate an interaction variable with measure the relationship between being male and education (how fast male salaries rise with education). That variable would be MSLOP E = ED ¤ M ALE If we include this in our previous regression we have SALARY = ¯ 0 + ¯ 1 ¤ ED + ¯2 ¤ M ALE + ¯ 3 ¤ MSLOP E Running this regression yields the following estimated equation (I will do this on the computer) yb = 4395 + 62:13 ¤ ED ¡ 274:9 ¤ M ALE + 73:59 ¤ MSLOP E
Now suppose we want to know if there is any di®erence between the two groups. Two answer this we construct the following partial F test: Null : ¯ 2 = ¯ 3 = 0 Alternative : At least one of the coe±cients is not zero. The full model for this test is SALARY = ¯ 0 + ¯ 1 ¤ ED + ¯2 ¤ M ALE + ¯ 3 ¤ MSLOP E and the reduced model of this test is SALARY = ¯ 0 + ¯ 1 ¤ ED We run both regression and ¯nd SSEF = 29054426 and SSER = 38460756. This allows us to construct our F statistic F =
(38460756 ¡ 29054426)=(3 ¡ 1) = 14:41 29054426=(93 ¡ 3 ¡ 1)
Using a 5% level of signi¯cance, the decision rule for this test is Reject the Null if : F > F (:05; 2; 89) = 3:15 Do not Reject the Null if : F · 3:15 Since, 14:41 > 3:15 we reject the null hypothesis. The regression equations are statistically di®erent between the two groups even after controlling for education. To test the di®erence in the slopes, we simply need to conduct a t test on the coe±cient ¯3 with has reported t stat of 1:157: Which is inside of 1:96. 8
Also, the reported t stat on ¯ 2 is ¡0:325. Which means that if we test these coe±cients separately neither one is signi¯cant, but the joint F test says that at least one of these coe±cients must be di®erent from zero. Why to we get con°icting results? Multicollinearity., the interaction and indicator variable are highly correlated. This is a®ecting our estimates and standard errors. We see that introducing the interaction variable only increases the R square by 1% so even though the F test says we should take the full model, it may be better to stick with the simpler reduced model. Thus, you are strongly advised to be careful of using interaction variables a lot. The possibility of multicollinearity is very high especially if the regression includes both indicator and interaction variables.
9