Domain-Specific Profiling? Alexandre Bergel1 , Oscar Nierstrasz2 , Lukas Renggli1 , Jorge Ressia2 1
2
PLEIAD Lab, Department of Computer Science (DCC), University of Chile pleiad.dcc.uchile.cl
Software Composition Group, University of Bern, Switzerland scg.unibe.ch
Abstract. Domain-specific languages and models are increasingly used within general-purpose host languages. While traditional profiling tools perform well on host language code itself, they often fail to provide meaningful results if the developers start to build and use abstractions on top of the host language. In this paper we motivate the need for dedicated profiling tools with three different case studies. Furthermore, we present an infrastructure that enables developers to quickly prototype new profilers for their domain-specific languages and models.
1
Introduction
Recent advances in domain-specific languages and models reveal a drastic change in the way software is being built. The software engineering community has seen a rapid emergence of domain-specific tools, ranging from tools to easily build domain-specific languages [18], to transform models [17], to check source code [11], and to integrate development tools [13]. While research on domain-specific languages has made consistent progress in language specification [5], implementation [4], evolution [6] and verification [8], little has been done to support profiling. We consider profiling to be the activity of recording and analyzing program execution. Profiling is essential for analyzing transient run-time data that otherwise would be difficult to harvest and compare. Code profilers commonly employ execution sampling as the way to obtain dynamic run-time information. Unfortunately, information extracted by regularly sampling the call stack cannot be meaningfully used to profile a high-level domain built on top of the standard language infrastructure. Specialized domains need specialized profilers. Let us consider the example of the Mondrian visualization engine (details follow in Section 2.1). Mondrian models visualizations as graphs, i.e., in terms of nodes and edges. One of the important performance issues we recently faced is the refresh frequency: nodes and edges were unnecessarily refreshed too often. Standard code profilers did not help us to localize the source of the problem since they are just able to report the share of time the CPU spends in the ?
In Objects, Models, Components, Patterns, 49th International Conference, TOOLS 2011, Zurich, Switzerland, June 28-30, 2011. LNCS 6705, pp. 68–82, 2011. doi:10.1007/978-3-642-21952-8 7
2
A. Bergel, O. Nierstrasz, L. Renggli, J. Ressia
method displayOn: of the classes MONode and MOEdge. The problem was finally resolved by developing a custom profiler that could identify which nodes and edges were indeed refreshed too often. This domain-specific profiler was able to exploit knowledge of Mondrian’s domain concepts to gather and present the needed information. We argue that there is a need for a general approach to easily develop specialized profilers for domain-specific languages and tools. A general approach must offer means to (i) specify the domain concepts of interest, (ii) capture the relevant information from the run-time execution, and (iii) present the results to the developer. In this paper we introduce MetaSpy, an event-based approach for domainspecific profiling. With MetaSpy, a developer specifies the events of interest for a given domain. A profiler captures domain information either by subscribing to existing application events, or by using a reflective layer to transparently inject event emitters into the domain code. The collected events are presented using graph-based visualizations. The contributions of this paper are: (1) the identification of the need for domain-specific profilers, (2) the presentation of three real-world case-studies where domain-specific profilers helped to significantly improve performance and correctness of domain-specific code, and (3) the presentation of an infrastructure for prototyping domain-specific profilers. Outline. The remainder of this paper is structured as follows: Section 2 illustrates the problems of using a general-purpose profiler on code that is built on top of a domain-specific language. Section 3 introduces our approach to domain-specific profiling. Section 4 demonstrates how our approach solves the requirements of domain-specific profilers with three use cases. Section 5 presents our infrastructure to implement domain-specific profilers. Section 6 presents an analysis on the performance impact of MetaSpy. Section 7 summarizes the paper and discusses future work.
2
Shortcomings of standard profilers
Current application profilers are useful to gather runtime data (e.g., method invocations, method coverage, call trees, code coverage, memory consumption) from the static code model offered by the programming language (e.g., packages, classes, methods, statements). This is an effective approach when the low-level source code has to be profiled. However, traditional profilers are far less useful for a domain different than the code model. In modern software there is a significant gap between the model offered by the execution platform and the model of the actually running application. The proliferation of meta-models and domain-specific languages brings new abstractions that map to the underlying execution platform in nontrivial ways. Traditional profiling tools fail to display relevant information in the presence of such abstractions.
Domain-Specific Profiling
2.1
3
Difficulty of profiling a specific domain
This section illustrates two shortcomings of traditional profiling techniques when applied to a specific domain.
CPU time profiling Mondrian [10] is an open and agile visualization engine. Mondrian describes a visualization using a graph of (possibly nested) nodes and edges. In June 2010 a serious performance issue was raised3 . Tracking down the cause of the poor performance was not trivial. We first used a standard sample-based profiler. Execution sampling approximates the time spent in an application’s methods by periodically stopping a program and recording the current set of methods under executions. Such a profiling technique is relatively accurate since it has little impact on the overall execution. This sampling technique is used by almost all mainstream profilers, such as JProfiler, YourKit, xprof [7], and hprof. MessageTally, the standard sampling-based profiler in Pharo Smalltalk4 , textually describes the execution in terms of CPU consumption and invocation for each method of Mondrian: 54.8% {11501ms} MOCanvas>>drawOn: 54.8% {11501ms} MORoot(MONode)>>displayOn: 30.9% {6485ms} MONode>>displayOn: | 18.1% {3799ms} MOEdge>>displayOn: ... | 8.4% {1763ms} MOEdge>>displayOn: | | 8.0% {1679ms} MOStraightLineShape>>display:on: | | 2.6% {546ms} FormCanvas>>line:to:width:color: ... 23.4% {4911ms} MOEdge>>displayOn: ...
We can observe that the virtual machine spent about 54% of its time in the method displayOn: defined in the class MORoot. A root is the unique non-nested node that contains all the nodes of the edges of the visualization. This general profiling information says that rendering nodes and edges consumes a great share of the CPU time, but it does not help in pinpointing which nodes and edges are responsible for the time spent. Not all graphical elements equally consume resources. Traditional execution sampling profilers center their result on the frames of the execution stack and completely ignore the identity of the object that received the method call and its arguments. As a consequence, it is hard to track down which objects cause the slowdown. For the example above, the traditional profiler says that we spent 30.9% in MONode>>displayOn: without saying which nodes were actually refreshed too often. 3 4
http://forum.world.st/Mondrian-is-slow-next-step-tc2257050.html#a2261116 http://www.pharo-project.org/
4
A. Bergel, O. Nierstrasz, L. Renggli, J. Ressia
Coverage PetitParser is a parsing framework combining ideas from scannerless parsing, parser combinators, parsing expression grammars and packrat parsers to model grammars and parsers as objects that can be reconfigured dynamically [12]. A number of grammars have been implemented with PetitParser, including Java, Smalltalk, XML and SQL. It would be useful to establish how much of the grammar is actually exercised by a set of test files to identify untested productions. The if statement parsing rule is defined as follows5 : PPJavaSyntax>>ifStatement ^ ('if' asParser token , conditionalExpression , statement) , ('else' asParser token , statement) optional
Coverage tools assess the coverage of the application source code by listing the methods involved in an execution. Some tools can even detect the coverage inside methods. Let us consider a Java grammar in PetitParser which is defined in 210 host language methods. These methods build a graph of objects describing the grammar. Traditional coverage tools focus on the source code artifacts instead of domain-specific data. In the example this means that all methods are covered to build the grammar, but some parts of the resulting graph are not used. This is why we are unable to analyze the parsing and production coverage of this grammar with traditional tools. 2.2
Requirements for domain-specific profilers
The two examples given above are representative. They illustrate the gap between a particular domain and the source code model. We argue that to efficiently profile an arbitrary domain, the following requirements need to be fulfilled: – Specifying the domain. Being able to effectively designate the objects relevant for the profiling is essential. Since we are concerned with what makes up a visualization in Mondrian, we are interested in the different nodes and the invocation of the displayOn: methods, rather than focusing on the implementation classes. Grammars in PetitParser are represented as an executable graph of primitive parser objects, each with its own execution behavior. – Capturing domain related events. Relevant events generated by the domain have to be monitored and recorded to be analyzed during or after the execution. An event represents a particular change or action triggered by the domain being profiled. Whereas the class MOGraphElement and its subclasses total more than 263 methods, only fewer than 10 methods are related to displaying and computing shape dimensions. 5
Readers unfamiliar with the syntax of Smalltalk might want to read the code examples aloud and interpret them as normal sentences: An invocation to a method named method:with:, using two arguments looks like: receiver method: arg1 with: arg2. Other syntactic elements of Smalltalk are: the dot to separate statements: statement1. statement2; square brackets to denote code blocks or anonymous functions: [ statements ]; and single quotes to delimit strings: 'a string'. The caret ^ returns the result of the following expression.
Domain-Specific Profiling
5
– Effectively and concisely presenting the necessary information. The information collected by traditional profilers is textual and targets method invocation. A method that invokes another will be located below it and indented. Moreover, each method frame represented has a class name and a method name, which completely ignores the identity of the object and arguments that are part of the call. Collected information has to be presented in such a way as to bring the important metrics and domain object composition into the foreground. Common code profilers employ execution sampling as the way to cheaply obtain dynamic information. Unfortunately, information extracted when regularly sampling the method call stack cannot be used to profile a domain other than the source code model.
3
MetaSpy in a nutshell
In this section we will present MetaSpy, a framework to easily build domainspecific profilers. The key idea behind MetaSpy is to provide domain-specific events that can later be used by different profilers with different objectives.
Instrumentation strategies
Profilers
MetaInstrumenter handler install setUp tearDown uninstall
Announcement Instrumenter announcer install uninstall
MethodInstrumenter theClass selector methdo doesNotUnderstand: run:with:in: install setUp tearDown uninstall
ParserInstrumenter parser grammar replacement install uninstall MondrianProfiler setUp visualize
Profiler model strategies observeClass:do: observeClass:selector:do observePackage:do: observePackagesMatching:do: observeParser:in:do: install setUp tearDown uninstall
OmniBrowserProfiler setUp visualize
PetitParserProfiler setUp visualize
User provided classes
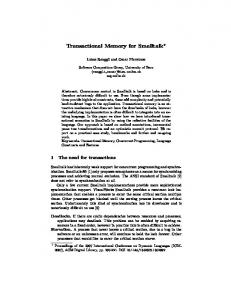
Fig. 1. The architecture of the MetaSpy profiler framework.
Figure 1 shows a class diagram of MetaSpy. There are two main abstractions: the instrumentation strategies and the domain-specific profilers. An instrumentation strategy is responsible for adapting a domain-specific model and triggering specific actions in the profiler when certain events occur. A profiler models a domain-specific profiling requirement by composing multiple instrumentation strategies. Some instrumentation strategies work by registering to existing events of the application domain. Other instrumentation strategies intercept the system by
6
A. Bergel, O. Nierstrasz, L. Renggli, J. Ressia
meta-programming, i.e., conventional instrumentation. Installing an instrumentation strategy activates it and its associated events, while uninstalling deactivates them. Some of the instrumentation strategies provided by MetaSpy are: – Announcement Instrumenter dispatches events satisfying a particular condition from the announcement framework to the external profiler. – Method Instrumenter triggers an event whenever a specific method is invoked on any instance of a specified class. – Object Instrumenter triggers an event whenever a specific method is invoked on a particular object. This is called object-specific profiling. – Parser Instrumenter triggers an event whenever a specific grammar production is activated. This is a very specific instrumentation strategy only working with PetitParser productions. Other dedicated instrumentation strategies can be implemented by adhering to the same interface. Profilers are responsible for modeling the domain-specific behavior to profile the main abstractions in each domain. The abstract Profiler class models the behavior of a general profiler. Subclasses are instantiated with a domain-specific model and implement the set-up and tear-down of one or more instrumentation strategies into the model. Furthermore, they define how and what data is collected when the instrumented model is exercised. To actually instrument the model and start collecting events the method install is used. Similarly, to remove all instrumentation from the model, uninstall is used. Both methods dispatch the requests to the respective instrumentation strategies using the current model. Each profiler is responsible for presenting the collected data in the method open. Depending on the nature of the data, this method typically contains a Mondrian [10] or Glamour [3] script, or a combination of both. Mondrian is a visualization engine to depict graphs of objects in configurable ways. Glamour is a browser framework to script user interfaces for exploratory data discovery. Next, we will show real-world examples of domain-specific profilers.
4
Validation
In this section we will analyze three case studies from three different domains. We will show how MetaSpy is useful for expressing the different profiling requirements in terms of events. We will also demonstrate how MetaSpy fulfills the domainspecific profiling requirements, namely specifying, capturing and presenting domain-specific information. For each case study we show the complete code for specifying and capturing events. We do not show the code for visualizing the results, which typically consists of 20–50 lines of Mondrian or Glamour scripts.
Domain-Specific Profiling
4.1
7
Case Study: Displaying invocations
A Mondrian visualization may comprise a great number of graphical elements. A refresh of the visualization is triggered by the operating system, resulting from user actions such as a mouse movement or a keystroke. Refreshing the Mondrian canvas iterates over all the nodes and edges and triggers a new rendering. Elements that are outside the window or for which their nesting node has an active bitmap in the cache should not be rendered. A graphical element is rendered when the method display:on: is invoked. Monitoring when these invocations occur is key to having a global view of what should be refreshed. Capturing the events The MetaSpy framework is instantiated to create the MondrianProfiler profiler. Profiler subclass: #MondrianProfiler instanceVariableNames: 'actualCounter previousCounter' MondrianProfiler defines two instance variables to monitor the evolution of the number of emitted events: actualCounter keeps track of the current number of triggered events per event type, and previousCounter the number of event types that were recorded before the previous visualization step.
MondrianProfiler>>initialize super initialize. actualCounter := IdentityDictionary new. previousCounter := IdentityDictionary new
The installation and instrumentation of Mondrian by MetaSpy is realized by the setUp method: MondrianProfiler>>setUp self model root allNodes do: [ :node | self observeObject: node selector: #displayOn: do: [ :receiver :selector :arguments | actualCounter at: receiver put: ((actualCounter at: receiver ifAbsent: [ 0 ]) + 1) ] ]
All the nodes obtained from the root of the model object are “observed” by the framework. At each invocation of the displayOn: method, the block given as parameter to do: is executed with the object receiver on which displayOn: is invoked, the selector name and the argument. This block updates the number of displays for each node of the visualization. Specifying the domain The instrumentation described in the setUp method is only applied to the model specified in the profiler. This model is an object which models the domain to
8
A. Bergel, O. Nierstrasz, L. Renggli, J. Ressia
be profiled, in this case a Mondrian visualization. The instrumentation is only applied to all nodes in this visualization. Only when these nodes receive the the message displayOn: will increment the actual counter. This object-specific behavior is possible due to the use of a reflection framework called Bifr¨ost [14]. Presenting the results The profiling of Mondrian is visualized using Mondrian itself. The visualizeOn: method generates the visualization given in Figure 2.
Fig. 2. Profiling (left) the System Complexity visualization (right).
One important point of visualizeOn: is to regularly update the visualization to be able to see the evolution of the domain events over time. The profiler is uninstalled when the profiler Mondrian visualization is closed. Figure 2 gives a screenshot of a visualization and the profiler. The right-hand side is an example of the System Complexity visualization [9] of the collection class hierarchy in Pharo. The left-hand side shows the profiler applied to the visualization. The horizontal bar indicates the number of times the corresponding node has been displayed. The profiling monitors each node of the profiled visualization. Each node is associated to a progress bar that widens upon node refresh. The profiled visualization remains interactive. Clicking and drag-and-dropping nodes refreshes the visualization, thus increasing the progress bar of the corresponding nodes. This profile helps identifying unnecessary rendering. We identified a situation in which nodes were refreshing without receiving user actions. This was perceived by the user with a sluggish rendering. Edges were constantly refreshed, even without being apparent. This problem is addressed in version 2.30 of Mondrian. 4.2
Case Study: Events in OmniBrowser
OmniBrowser [2] is a framework to define and compose new browsers, i.e., graphical list-oriented tools to navigate and edit elements from an arbitrary
Domain-Specific Profiling
9
domain. In the OmniBrowser framework, a browser is described by a domain model specifying the domain elements that can be navigated and edited, and a metagraph specifying the navigation between these domain elements. Nodes in the metagraph describe states the browser is in, while edges express navigation possibilities between those states. The OmniBrowser framework then dynamically composes widgets such as list menus and text panes to build an interactive browser that follows the navigation described in the metagraph. OmniBrowser uses announcements for modeling the interaction events of the user with the IDE. A very common problem is to have certain announcements be triggered too many times for certain scenarios. This behavior impacts negatively the performance of the IDE. Moreover, in some cases odd display problems are produced which are very hard to track down. Capturing the events To profile this domain-specific case we implemented the class OmniBrowserProfiler: Profiler subclass: #OmniBrowserProfiler instanceVariableNames: 'actualCounter previousCounter'
The instrumentation in the setUp method counts how many times each announcement was triggered. OmniBrowserProfiler>>setUp self observeAnnouncer: self model announcer do: [ :ann | actualCounter at: ann class put: (actualCounter at: ann class ifAbsent: [ 0 ]) + 1 ]
Fig. 3. Profiling (left) an OmniBrowser instance (right).
10
A. Bergel, O. Nierstrasz, L. Renggli, J. Ressia
Specifying the domain We specify the entities we are interested in profiling by defining the model in the profiler. For example, we could define OBSystemBrowser browsing a specific class. All OmniBrowser instances have an internal collaborator named announcer which is responsible for the signaling of announcements. This is the object used by the profiler to catch the announcement events. Presenting the results A Mondrian visualization was implemented to list the type and the number of announcements triggered (Figure 3). 4.3
Case Study: Parsing framework with PetitParser
Rigorous test suites try to ensure that each part of the grammar is covered by tests and is well-specified according to the respective language standards. Validating that each production of the grammar is covered by the tests is a difficult activity. As mentioned previously, the traditional tools of the host language work at the method and statement level and thus cannot produce meaningful results in the context of PetitParser where the grammar is modeled as a graph of objects. Capturing the events With MetaSpy we can implement the grammar coverage with a few lines of code. The instrumentation happens at the level of the primitive parser objects. The method observeParser:in: wraps the parser object with a handler block that is called for each activation of the parser. 1 2 3 4 5 6
PetitParserProfiler>>setUp self model allParsers do: [ :parser | self observeParser: parser in: self grammar do: [ counter at: parser put: (counter at: parser ifAbsent: [ 0 ]) + 1 ] ]
Line 2 iterates over all primitive parser objects in the grammar. Line 3 attaches the event handler on Lines 4–6 to each parser in the model. The handler then counts the activations of each parser object when we run the test suite of the grammar. Specifying the domain The domain in this case is an instance of the grammar that we want to analyze. Such a grammar may be defined using hundreds of interconnected parser objects. Presenting the results This provides us with the necessary information to display the grammar coverage in a visualization such as that shown in Figure 4.
Domain-Specific Profiling
11
Fig. 4. Visualization of the production coverage of an XML grammar with uncovered productions highlighted in black (left); and the same XML grammar with updated test coverage and complete production coverage (right). The size of the nodes is proportional to the number of activations when running the test suite on the grammar.
5
Implementing instrumentation strategies
MetaSpy has two ways of implementing an instrumentation strategies: listening to pre-existing event-based systems, or using the meta-level programming techniques of the host language to define a meta-event the strategy is interested in. Let us consider the class AnnouncementInstrumenter, whose responsibility is to observe the generation of specific announcements. AnnouncementInstrumenter>>install self announcer on: Announcement send: #value: to: self handler
The install method installs an instrumentation strategy object on the domain specified in the install method. In this snippet of code we can see that the strategy is hooked into the announcement system by evaluating the strategy’s handler when an announcement is triggered. However, not all profiling activities can rely on a preexisting mechanism for registering to events. In some cases, a profiler may be hooked into the base code using an existing event mechanism, for example the OmniBrowser profiler. In other cases, extending the base code with an appropriate event mechanism is simply too expensive. Because of this, we need to rely on the meta-programming facilities of the host language. These facilities are not always uniform and require ad hoc code to hook in behavior. To avoid this drawback we decided to use a framework that provides uniform meta-programming abstractions. Bifr¨ost [14] offers a model of fined-grained unanticipated dynamic structural and behavioral adaptation. Instead of providing reflective capabilities as an external mechanism, Bifr¨ost integrates them deeply into the environment. Bifr¨ost is a reflective system based on explicit meta-objects to improve meta-level engineering.
12
A. Bergel, O. Nierstrasz, L. Renggli, J. Ressia
Bifr¨ost has been designed as an evolution of partial behavioral reflection for Smalltalk [15], which in turn was conceived as an extension of the Reflex model [16]. Bifr¨ost’s meta-objects provide a structural view and a behavioral view. In the context of MetaSpy we were mainly interested in behavioral reifications. A behavioral meta-object reifying message sends was used for the message send instrumenter. A Message Received event is also provided by the behavioral meta-object. State read and write are also supported thus MetaSpy can profile these dynamic events. Bifr¨ost meta-objects when attached to a single object are object-specific in nature, thus fulfilling an important domain-specific profiler design requirement. Let us consider the Message Received Instrumenter, whose responsibility is to instrument when a specific object receives a specific message. MessageReceivedInstrumenter>>install self observerMetaObject bind: self object
MessageReceivedInstrumenter>>setUp profilingMetaObject := BehaviorMetaObject new when: self selector isReceivedDo: self handler
The method install binds a meta-object to the object to be observed. The method setUp initializes the profiling meta-object with a behavioral meta-object. This meta-object evaluates the handler when a specific message is received by the profiled object. This mechanism is termed object-specific instrumentation. Object-specific instrumentation is not trivial to achieve in class-based languages like Smalltalk and Java. Classes are deeply rooted in the language interpreter or virtual machine and performance is tweaked to rely heavily on these constructs. Moreover, most languages provide a good level of structural reflection to deal with structural elements like classes, method, statements, etc. Most languages, however, do not provide a standard mechanism to reflect on the dynamic abstractions of the language. There are typically no abstractions to intercept meta-events such as a message send, a message receive, a state read, etc. In our implementation, the profiled application, the profiler, and the visualization engine are all written in the same language, Pharo, and run on the same virtual machine. Nothing in our approach prevent from decoupling these components and having them written in a different language or running remotely. This is actually what often happen with the profilers and debuggers running on the Java virtual machine (e.g., Java debugging interface6 ).
6
Micro-benchmark
Profiling always impacts the performance of the application being analyzed. We have performed a micro-benchmark to assess the maximal performance impact of MetaSpy. We assume that the behavior required to fulfill the profiling requirements is constant to any instrumentation strategy. 6
http://download.oracle.com/javase/1.5.0/docs/guide/jpda/jvmdi-spec.html
Domain-Specific Profiling
13
We analyze the impact of MetaSpy on both profiling uses cases. All benchmarks were performed on an Apple MacBook Pro, 2.8 GHz Intel Core i7 in Pharo 1.1.1 with the jitted Cog VM. Registering instrumentation strategies to a preexisting event-based system depends heavily on the the system used and how it is used. Using meta-level programming techniques on a runtime system can have a significant performance impact. Consider a benchmark in which a test method is being invoked one million times from within a loop. We measure the execution time of the benchmark with Bifr¨ost reifying the 106 method activations of the test method. This shows that in the reflective case the code runs about 35 times slower than in the reified one. However, for a real-world application with only few reifications the performance impact is significantly lower. Bifr¨ost’s meta-objects provide a way of adapting selected objects thus allowing reflection to be applied within a fine-grained scope only. This provides a natural way of controlling the performance impact of reflective changes. Let us consider the Mondrian use case presented in Section 2.1. The main source of performance degradation is from the execution of the method displayOn: and thus whenever a node gets redisplayed. We developed a benchmark where the user interaction with the Mondrian easel is simulated to avoid human delay pollution in the exercise. In this benchmark we redraw one thousand times the nodes in the Mondrian visualization. This implies that the method displayOn: is called extensively. The results showed that the profiler-oriented instrumentation produces on average a 20% performance impact. The user of this Mondrian visualization can hardly detect the delay in the drawing process. Note that our implementation has not been aggressively optimized. It has been shown [1] that combining instrumentation and sampling profiling leaded to accurate profiles (93– 98% overlap with a perfect profile) with low overhead (3–6%). The profilers we presented in this paper are likely to benefit from such instrumentation sampling.
7
Conclusions and future work
Our contributions are the following: 1. We demonstrated the need for domain-specific profilers. We argued that traditional profilers are concerned with source code only and are inadequate for profiling domain-specific concerns. We demonstrated this drawback with two use cases. 2. We formulated the requirements domain-specific profilers must fulfill: specifying the domain, capturing domain related events and presenting the necessary information. 3. We presented MetaSpy, a framework for defining domain-specific profilers. We also presented three real-world case-studies showing how MetaSpy fulfills the domain-specific profiler requirements. As future work we plan to: – Provide ready-made and pluggable visualizations that can be used by new domain-specific profilers. We plan to use Glamour to build these visualizations.
14
A. Bergel, O. Nierstrasz, L. Renggli, J. Ressia
– Apply MetaSpy in the context of large meta-models, such as the FAMIX meta-model in Moose and the Magritte meta-model in Pier. – Provide additional ready-made event types that enhance the expressibility of new profilers. – Profiler scoping is of key importance to obtain adequate information. We plan to enhance the scoping mechanism to be able to dynamically attach events to groups of objects.
Acknowledgments We gratefully acknowledge the financial support of the Swiss National Science Foundation for the project “Synchronizing Models and Code” (SNF Project No. 200020-131827, Oct. 2010 – Sept. 2012). We also like to thank Toon Verwaest for his feedback on earlier drafts of this paper.
References 1. Arnold, M., Ryder, B.G.: A framework for reducing the cost of instrumented code. In: Proceedings of the ACM SIGPLAN 2001 conference on Programming language design and implementation. pp. 168–179. PLDI ’01, ACM, New York, NY, USA (2001) 2. Bergel, A., Ducasse, S., Putney, C., Wuyts, R.: Creating sophisticated development tools with OmniBrowser. Journal of Computer Languages, Systems and Structures 34(2-3), 109–129 (2008) 3. Bunge, P.: Scripting Browsers with Glamour. Master’s thesis, University of Bern (Apr 2009) 4. Cuadrado, J.S., Molina, J.G.: A model-based approach to families of embedded domain specific languages. IEEE Transactions on Software Engineering 99(1) (2009) 5. Deursen, A., Klint, P., Visser, J.: Domain-specific languages: An annotated bibliography. ACM SIGPLAN Notices 35(6), 26–36 (Jun 2000) 6. Freeman, S., Pryce, N.: Evolving an embedded domain-specific language in Java. In: OOPSLA’06: Companion to the 21st Symposium on Object-Oriented Programming Systems, Languages, and Applications. pp. 855–865. ACM, Portland, OR, USA (2006) 7. Gupta, A., Hwu, W.M.W.: Xprof: profiling the execution of X Window programs. In: Proceedings of the 1992 ACM SIGMETRICS joint international conference on Measurement and modeling of computer systems. pp. 253–254. SIGMETRICS ’92/PERFORMANCE ’92, ACM, New York, NY, USA (1992) 8. Kabanov, J., Raudj¨ arv, R.: Embedded typesafe domain specific languages for Java. In: PPPJ’08: Proceedings of the 6th International Symposium on Principles and Practice of Programming in Java. pp. 189–197. ACM, Modena, Italy (2008) 9. Lanza, M., Ducasse, S.: Polymetric views—a lightweight visual approach to reverse engineering. Transactions on Software Engineering (TSE) 29(9), 782–795 (Sep 2003) 10. Meyer, M., Gˆırba, T., Lungu, M.: Mondrian: An agile visualization framework. In: ACM Symposium on Software Visualization (SoftVis’06). pp. 135–144. ACM Press, New York, NY, USA (2006) 11. Renggli, L., Ducasse, S., Gˆırba, T., Nierstrasz, O.: Domain-specific program checking. In: Vitek, J. (ed.) Proceedings of the 48th International Conference on Objects, Models, Components and Patterns (TOOLS’10). LNCS, vol. 6141, pp. 213–232. Springer-Verlag (2010)
Domain-Specific Profiling
15
12. Renggli, L., Ducasse, S., Gˆırba, T., Nierstrasz, O.: Practical dynamic grammars for dynamic languages. In: 4th Workshop on Dynamic Languages and Applications (DYLA 2010). Malaga, Spain (Jun 2010) 13. Renggli, L., Gˆırba, T., Nierstrasz, O.: Embedding languages without breaking tools. In: D’Hondt, T. (ed.) ECOOP’10: Proceedings of the 24th European Conference on Object-Oriented Programming. LNCS, vol. 6183, pp. 380–404. Springer-Verlag, Maribor, Slovenia (2010) 14. Ressia, J., Renggli, L., Gˆırba, T., Nierstrasz, O.: Run-time evolution through explicit meta-objects. In: Proceedings of the 5th Workshop on
[email protected] at the ACM/IEEE 13th International Conference on Model Driven Engineering Languages and Systems (MODELS 2010). pp. 37–48 (Oct 2010) ´ Unanticipated partial behavioral reflec15. R¨ othlisberger, D., Denker, M., Tanter, E.: tion: Adapting applications at runtime. Journal of Computer Languages, Systems and Structures 34(2-3), 46–65 (Jul 2008) ´ Noy´e, J., Caromel, D., Cointe, P.: Partial behavioral reflection: Spa16. Tanter, E., tial and temporal selection of reification. In: Proceedings of OOPSLA ’03, ACM SIGPLAN Notices. pp. 27–46 (nov 2003) 17. Tisi, M., Cabot, J., Jouault, F.: Improving higher-order transformations support in atl. In: Proceedings of the Third international conference on Theory and practice of model transformations. pp. 215–229. ICMT’10, Springer-Verlag, Berlin, Heidelberg (2010) 18. Visser, E.: Program transformation with Stratego/XT: Rules, strategies, tools, and systems in StrategoXT-0.9. In: Lengauer, C., et al. (eds.) Domain-Specific Program Generation, Lecture Notes in Computer Science, vol. 3016, pp. 216–238. Spinger-Verlag (Jun 2004)