NASA/TM-2003-212146
Dot-Projection Photogrammetry and Videogrammetry of Gossamer Space Structures Richard S. Pappa Langley Research Center, Hampton, Virginia Jonathan T. Black Joint Institute for Advancement of Flight Sciences George Washington University Langley Research Center, Hampton, Virginia Joseph R. Blandino James Madison University, Harrisonburg, Virginia Thomas W. Jones and Paul M. Danehy Langley Research Center, Hampton, Virginia Adrian A. Dorrington National Research Council Langley Research Center, Hampton, Virginia
January 2003
The NASA STI Program Office ... in Profile Since its founding, NASA has been dedicated to the advancement of aeronautics and space science. The NASA Scientific and Technical Information (STI) Program Office plays a key part in helping NASA maintain this important role. The NASA STI Program Office is operated by Langley Research Center, the lead center for NASA’s scientific and technical information. The NASA STI Program Office provides access to the NASA STI Database, the largest collection of aeronautical and space science STI in the world. The Program Office is also NASA’s institutional mechanism for disseminating the results of its research and development activities. These results are published by NASA in the NASA STI Report Series, which includes the following report types: •
•
•
TECHNICAL PUBLICATION. Reports of completed research or a major significant phase of research that present the results of NASA programs and include extensive data or theoretical analysis. Includes compilations of significant scientific and technical data and information deemed to be of continuing reference value. NASA counterpart of peer-reviewed formal professional papers, but having less stringent limitations on manuscript length and extent of graphic presentations. TECHNICAL MEMORANDUM. Scientific and technical findings that are preliminary or of specialized interest, e.g., quick release reports, working papers, and bibliographies that contain minimal annotation. Does not contain extensive analysis. CONTRACTOR REPORT. Scientific and technical findings by NASA-sponsored contractors and grantees.
•
CONFERENCE PUBLICATION. Collected papers from scientific and technical conferences, symposia, seminars, or other meetings sponsored or co-sponsored by NASA.
•
SPECIAL PUBLICATION. Scientific, technical, or historical information from NASA programs, projects, and missions, often concerned with subjects having substantial public interest.
•
TECHNICAL TRANSLATION. Englishlanguage translations of foreign scientific and technical material pertinent to NASA’s mission.
Specialized services that complement the STI Program Office’s diverse offerings include creating custom thesauri, building customized databases, organizing and publishing research results ... even providing videos. For more information about the NASA STI Program Office, see the following: •
Access the NASA STI Program Home Page at http://www.sti.nasa.gov
•
E-mail your question via the Internet to
[email protected]
•
Fax your question to the NASA STI Help Desk at (301) 621-0134
•
Phone the NASA STI Help Desk at (301) 621-0390
•
Write to: NASA STI Help Desk NASA Center for AeroSpace Information 7121 Standard Drive Hanover, MD 21076-1320
NASA/TM-2003-212146
Dot-Projection Photogrammetry and Videogrammetry of Gossamer Space Structures Richard S. Pappa Langley Research Center, Hampton, Virginia Jonathan T. Black Joint Institute for Advancement of Flight Sciences George Washington University Langley Research Center, Hampton, Virginia Joseph R. Blandino James Madison University, Harrisonburg, Virginia Thomas W. Jones and Paul M. Danehy Langley Research Center, Hampton, Virginia Adrian A. Dorrington National Research Council Langley Research Center, Hampton, Virginia
National Aeronautics and Space Administration Langley Research Center Hampton, Virginia 23681-2199
January 2003
Available from: NASA Center for AeroSpace Information (CASI) 7121 Standard Drive Hanover, MD 21076-1320 (301) 621-0390
National Technical Information Service (NTIS) 5285 Port Royal Road Springfield, VA 22161-2171 (703) 605-6000
Dot-Projection Photogrammetry and Videogrammetry of Gossamer Space Structures Richard S. Pappa†
Jonathan T. Black‡
Joseph R. Blandino§
NASA Langley Research Center Hampton, Virginia
George Washington University Hampton, Virginia
James Madison University Harrisonburg, Virginia
Thomas W. Jones*
Paul M. Danehy*
Adrian A. Dorrington*
NASA Langley Research Center Hampton, Virginia
NASA Langley Research Center Hampton, Virginia
National Research Council Hampton, Virginia
ABSTRACT This paper documents the technique of using hundreds or thousands of projected dots of light as targets for photogrammetry and videogrammetry of gossamer space structures. Photogrammetry calculates the three-dimensional coordinates of each target on the structure, and videogrammetry tracks the coordinates versus time. Gossamer structures characteristically contain large areas of delicate, thin-film membranes. Examples include solar sails, large antennas, inflatable solar arrays, solar power concentrators and transmitters, sun shields, and planetary balloons and habitats. Using projected-dot targets avoids the unwanted mass, stiffness, and installation costs of traditional retroreflective adhesive targets. Four laboratory applications are covered that demonstrate the practical effectiveness of white-light dot projection for both static-shape and dynamic measurement of reflective and diffuse surfaces, respectively. Comparisons are made between dot-projection videogrammetry and traditional laser vibrometry for membrane vibration measurements. The paper closes by introducing a promising extension of existing techniques using a novel laser-induced fluorescence approach. INTRODUCTION Ground and in-space testing of future gossamer space structures poses many unique challenges because of their large size and flexibility [Ref. 1]. Examples of gossamer systems under development include solar sails, large antennas, inflatable solar arrays, solar power concentrators and transmitters, sun shields, and planetary balloons and
†
Structural Dynamics Branch Joint Institute for Advancement of Flight Sciences § College of Integrated Science and Technology ∗ Instrumentation Systems Development Branch ‡
habitats [Ref. 2]. These structures characteristically contain large areas of thin-film membranes and can be tens or even hundreds of meters in size. They will be compactly folded to fit on existing launch vehicles, expanding in space to many times their launch size. Photogrammetry is the science of measuring object coordinates with photographs. It offers the simplicity of taking photographs coupled with good to excellent measurement precision [Refs. 3-4]. When applied to time sequences of images, it is often called “videogrammetry” instead of “photogrammetry,” although either term is acceptable. Research to develop effective photogrammetry and videogrammetry methods for future gossamer space structures began about three years ago. Several earlier publications discuss related and complementary aspects of this work [Refs. 5-9]. This paper documents recent experiences at the NASA Langley Research Center (LaRC) using projected dots of light as photogrammetric targets for measuring gossamer systems. These unconventional, membrane-dominated structures are often reflective or transparent, which significantly complicates the associated imaging and data analysis problems. References 10 and 11 discuss other applications of dot-projection photogrammetry to moreconventional structures, including rigid antennas, door panels, and wind tunnel models. Dot projection is considered to be primarily a tool for measuring ground test articles, although in-space application is potentially possible as well. The paper begins by comparing the pros and cons of commonly used retroreflective adhesive targets with those of projected-dot targets for gossamer applications. Next, important membrane reflectivity effects are discussed, followed by brief mention of the equipment used for ground
1
tests. The next section explains what is measured with the dot-projection technique, which can be easily misunderstood. Four laboratory applications are then covered that demonstrate the effectiveness of white-light dot projection for static shape measurement of both opaque and reflective membranes and for dynamic measurement of opaque membranes (but not reflective ones). Transparent membranes cannot be measured by standard, white-light dot projection methods. The paper closes by introducing a promising extension of existing techniques for measuring the shape and dynamics of all types of membranes, including transparent ones, using a novel laser-induced fluorescence approach. COMPARISON WITH RETROREFLECTIVE TARGETS Retroreflective targets reflect light strongly back to the source and appear as bright white dots in images when illuminated from the camera position. They are the “gold standard” targeting method of precision photogrammetry [Ref. 10]. It is useful to begin by comparing the uncommon dot-projection technique with the commonly used and wellunderstood retroreflective targeting technique. Table 1 lists several advantages and disadvantages of each method for gossamer applications. Some of these items are alluded to in this section by example. The others are either selfexplanatory or will become clear as four laboratory applications using projected dots are described later in the paper. Figure 1(a) shows a 5m inflatable parabolic reflector with 550 6-mm-diameter retroreflective circular targets. They were installed on this ground test article several years ago to measure the reflector shape with photogrammetry. The rms deviation of the surface from an ideal parabolic shape was measured with these targets to be about 1 mm. The targets have never been removed, and it would be difficult to do so now without destroying the reflector. For this reason, retroreflective adhesive targets are generally not appropriate for measuring thin-film membranes whenever the targets must be removed afterwards. Figure 1(b) shows two quadrants (one-half) of a 10m square solar sail with 80 28-mm-diameter retroreflective circular targets. It is a pathfinder solar sail model used for analytical and experimental research and development. Mode shapes of the structure at the target locations were measured with a scanning laser vibrometer. Dynamic response measurements using videogrammetry can also be made with these targets. The static shape of the structure, however, would be inadequately characterized using photogrammetry with these
targets because the targets are too large and sparse relative to the wavelength of the wrinkles. Projected dots of light are an attractive alternative to retroreflective targets for measuring thin-film membrane structures. Figure 2 shows an example of approximately 4000 circular dots projected onto a freely hanging strip of frosted plastic membrane. By taking photographs from two or more directions, the three-dimensional (3D) coordinates of the center of each dot can be accurately calculated by photogrammetry. (Reference 7 describes the 10 steps of close-range photogrammetry consistent with the PhotoModeler Pro commercial software product [Ref. 12], which was used for all analyses presented in this paper.) Videogrammetry methods can also use these 4000 targets for dynamic measurements, but generally a subset of the targets would be selected for calculation of motion time histories. Projected dots offer some obvious advantages over adhesive targets for shape and dynamic measurements of membranes (e.g., thousands of targets can be used without adding mass or stiffness), but there are some disadvantages as well. For example, on shiny membranes, the majority of the projected light will specularly reflect from the surface and not enter cameras located at most viewing angles relative to the projector. This causes significant light intensity variation in the images across the area of the projected dots, complicating the photogrammetric analysis and limiting the attainable measurement accuracy. Modifying the membranes with diffuse coatings or adding laser-induced fluorescent dyes (discussed later) are two possible solutions to this problem. MEMBRANE REFLECTIVITY EFFECTS Not surprisingly, the reflection characteristics of membrane surfaces directly affect the quality of images measured with the dot-projection technique. Diffuse surfaces are generally best for photogrammetry since light scatters in all directions resulting in more-uniform contrast in the images. But, in many cases, gossamer structures will require reflective or transparent membranes. Reflective surfaces are more difficult to measure than diffuse surfaces for the reason stated above. Transparent membranes are the most difficult of all since projected light passes directly through the material. Note that all membranes have some degree of each of these optical characteristics; that is, membranes are never totally diffuse, totally reflective (specular), nor totally transparent.
2
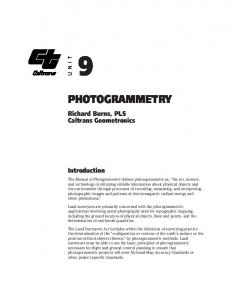
Figure 3 shows images obtained by simultaneous dot projection on both shiny and diffuse surfaces using side-byside pieces of aluminized Kapton and matte-white Mylar films. Figure 3(a) shows the test configuration. The three images in Figs. 3(b)-3(d) were recorded using camera exposure times ranging from 2.5 to 20.0 secs. For this test, the projector was located directly in front of the membranes and the camera was about 30 degrees to the left. The target contrast is clearly superior on the matte surface for all exposure settings. On the aluminized surface, the target contrast varies significantly within each image and with changes in the exposure time. Variable target contrast of this magnitude complicates, but does not preclude, accurate photogrammetric analysis. With shiny membranes, the dot intensity is greatest in the images where the angle of reflection off the membrane is closest to the angle of incidence from the projector. PROJECTORS AND CAMERAS Figure 4 shows four projectors used during the course of this research. The images presented in Figs. 2 and 3 were obtained with the consumer-grade Kodak slide projector shown in Fig. 4(a). It is bright enough for dot-projection photogrammetry of relatively small objects only (e.g., under 2m). Figure 4(b) shows a modified Kodak projector with a much brighter lamp suitable for slide presentations in auditoriums. This unit will adequately illuminate shiny membranes up to about 3m in size and diffuse ones up to about 10m in size. The projector in Fig. 4(c) is a consumergrade, 1200-lumen digital projector useful for projecting custom patterns of dots, allowing computer-controlled selection of target sizes, spacing, and positioning. A disadvantage of digital projectors is the pixelation that occurs in the projected dots, causing some reduction in target centroiding accuracy. Figure 4(d) shows a professional PRO-SPOT projector manufactured by Geodetic Services, Inc. specifically for dot-projection photogrammetry [Ref. 10]. It uses a high-intensity flash tube that is fired by the camera. Slides with up to 22,500 dots are available for this unit. Figure 5 shows three principal types of digital cameras used in this research. The Olympus E-20 in Fig. 5(a) is a consumer-grade, 5-megapixel color camera with nonremovable zoom lens. Most of the photogrammetry work conducted over the past year used this type of camera. The Kodak DCS-760M in Fig. 5(b) is a professional, 6megapixel monochrome camera that uses interchangeable Nikon lenses designed for 35-mm film cameras. It is a digital version of the Nikon F5 camera. These cameras were
recently acquired and have not been used much to date. The Pulnix TM-1020-15 in Fig. 5(c) is a scientific-grade, 1megapixel monochrome video camera that also uses interchangeable Nikon lenses. Images captured by the camera, at up to 15 frames per second, are stored in computer memory during a test and then transferred to individual files or combined into one AVI file. Most of the videogrammetry work conducted over the past year used this type of camera. For tests with retroreflective targets, the cameras can be equipped with ring flashes (E-20 and DCS760M) or fiber-optic ring lights (TM-1020-15) to provide uniform target illumination. Each test typically uses two to four cameras of any one type simultaneously. WHAT IS MEASURED? It is easy to misunderstand exactly what is being measured with the dot-projection technique. This is particularly true for dynamic measurements made with videogrammetry. This section will clarify any confusion on this topic. Clearly, the location of each projected dot on a structure matches the location of the underlying surface. The photogrammetric process accurately computes the 3D coordinates of the center (centroid) of each dot at each instant of time [Ref. 7]. Thus, photogrammetry generates a set of 3D points, a so-called “point cloud,” defining the shape of the structure at the target locations at any instant of time. For static shape measurements, this calculation is performed once. For dynamic measurements, the target coordinates are tracked versus time, generating a series of point clouds and each of these point clouds also accurately defines the shape of the structure at the corresponding instant of time. However, projected dots do not move with the structure when it vibrates or changes shape in the same way as attached targets do, which is typically the point of confusion. This is an important fundamental difference between attached and projected targets for dynamic measurements. An attached target will move in all three coordinate directions with the structure. Videogrammetry calculates x, y, and z-direction time histories for each attached target that match the motion of the underlying structure in all three directions. A projected dot, however, can only move along a straight line either towards or away from the projector regardless of how the structure moves. Note that a projected dot on a surface represents the intersection of the surface and a stationary ray of light from the projector. Regardless of how the structure vibrates or changes shape, the
3
intersection point for that dot will always lie somewhere on the same ray of light. With projected-dot targets, videogrammetry will again correctly measure the dynamic 3D movement of each target, but in this case the path of each target always follows a straight-line course moving either towards or away from the projector. An interesting parallel can be drawn with conventional laser vibrometry. In fact, the dynamic information measured by videogrammetry with projected-dot targets is equivalent to that measured by laser vibrometry if the vibrometer is located at the projector position and its “cosine correction” feature is turned off. A laser vibrometer is a universally accepted instrument for measuring dynamic characteristics of thin plates and other structures that vibrate predominantly in one direction only (out of plane). It also only measures motion along the stationary ray of light extending from the instrument to the intersection point on the surface. A significant difference between laser vibrometry and videogrammetry with projected-dot targets, however, is that vibrometry measures only one point at a time while videogrammetry measures them all simultaneously. Furthermore, laser vibrometry measures only dynamic data (cannot measure the static shape), while photo/videogrammetry measures both the static and dynamic structural characteristics. APPLICATION EXAMPLES This section covers four laboratory applications of the dot-projection technique that show the practical effectiveness of this approach. The first two examples illustrate static shape measurement of reflective membrane surfaces (one large measurement area and then one small measurement area) with photogrammetry, and the last two examples illustrate dynamic measurement of diffuse white surfaces (one swinging rigid structure and then one flexible membrane structure) with videogrammetry. Static shape measurement of diffuse (opaque) structures is not covered because it is the simplest case of all, and excellent results are routinely obtained with dot-projection photogrammetric measurement of diffuse objects. Dynamic measurement of reflective surfaces with projected-dot targets has not been successfully accomplished. 1. 3m Hexapod Membrane Reflector Figure 6 shows the first of two application examples of dot-projection photogrammetry. The test article is a 3mdiameter, reflective membrane research structure developed by Tennessee State University, LaRC, and ILC Dover, Inc.
for active shape and vibration control experiments [Ref. 13]. It is not an actual spacecraft concept, but contains components of proposed inflatable gossamer observatories. Figure 6(a) shows a front view of this “hexapod” test article. Both the front and rear surfaces of the tensioned membrane have a shiny aluminum coating. Recall that reflective surfaces are difficult to measure because most of the projected light reflects away from the camera positions. Only a fraction of the light is scattered into the cameras by surface imperfections. This test used a high-intensity carousel projector designed for auditorium presentations. Two Olympus E-20 cameras, one on each side and somewhat lower than the projector, photographed the back of the membrane. Figure 6(b) shows the images obtained of approximately 550 dots projected onto the back surface. Although the surface is shiny, sufficient contrast was obtained in a darkened room using an image exposure time of 30 seconds. Note that this approach would be inadequate for dynamic tests where much shorter exposure times are required. Figure 6(c) illustrates the non-uniform contrast typically encountered with reflective membranes. To calculate the centroid of each dot, photogrammetry software must differentiate the region of the dot from its surrounding area. One way to do this is by manually selecting an intensity threshold that is below the intensity of all targets in a specified region of the image but above the intensity of the background. The intensity of each pixel in the image ranges from 0 (pure black) to 255 (pure white). The images in Fig. 6(c) show the photograph from the left-hand camera position displayed with binary intensity thresholds of 100, 75, and 50. At a threshold setting of N, all pixels in the image with a gray-scale value (intensity) of N and greater are displayed as white and all others are displayed as black. These results more clearly show the uneven distribution of light intensities in the image, ranging from the highest intensity in the white regions to the lowest intensity in the black regions. Non-uniform contrast complicated this step of the data analysis process, but did not prevent an accurate analysis. In this case, three successively smaller thresholds were selected, and at each setting additional targets were identified and centroided correctly. Figure 6(d) shows the resulting 3D point model obtained using the two images in Fig. 6(b), viewed from both the front and top of the membrane. The overall static shape was accurately measured, and post-processing of the data showed an rms deviation from a best-fit plane of approximately 1.0 mm. Note that the dot size used in this experiment is appropriate
4
for measuring the overall shape, but is much too large to characterize any wrinkling that occurs, such as near the tensioned boundary or along seams. 2. 2m Aluminized Kapton Solar Sail Figure 7 shows the second application of dot-projection photogrammetry. This example demonstrates the capability of close-range photogrammetry to measure distributed, small-amplitude wrinkles on a lightly tensioned reflective membrane. The exact shape of the wrinkles can change easily with slight air currents or other environmental disturbances, so it would be exceedingly difficult to measure this information by any other means. The test article is a 2m square solar sail model (the length of each side is 2m) shown in Fig. 7(a). It can also be seen near the center of Fig. 1(b). This is one of several pathfinder gossamer structures at LaRC used for analytical and experimental research and development [Ref. 14]. The membrane for this structure consists of two strips of aluminized Kapton, similar to the hexapod reflector material in the previous example, seamed together horizontally. Membrane wrinkling, caused by the discrete corner tension loads, the seam, and gravity, is abundant. A grid of approximately 5000 dots was projected onto the area indicated in Fig. 7(a), which is about 1.0 m x 0.5 m in size. Four Olympus E-20 cameras photographed the dot pattern simultaneously in this test. The cameras were located approximately at the corners of the area of interest pointing towards the center of the area. The orientation angle between cameras was about 90 degrees in both the horizontal and vertical directions. Several sets of photographs were taken in a darkened room at different shutter speeds. The set selected for processing used a 30second image exposure time, which provided the best contrast between the projected white dots and the aluminized Kapton background. An accurate model of the membrane surface was obtained by analyzing these images. The results, consisting of over 5000 3D points, are displayed as a relief map in Fig. 7(b) and as a corresponding contour plot in Fig. 7(c). These maps, normally used for displaying topographic land features, clearly illustrate the visible wrinkles in the Kapton membrane and the seam cutting horizontally across the center. The maximum wrinkle amplitude was approximately 1 mm zero-to-peak, and the photogrammetric measurement precision (calculated by the software) was about 0.03 mm.
3. 0.6m Oscillating White Plate Figure 8 shows the first of two application examples of dot-projection videogrammetry. It is a proof-of-concept test conducted to compare videogrammetry results for the same structure using both projected dots and then retroreflective adhesive targets [Ref. 15]. Figure 8(a) shows the test article, which is a 0.6 m x 0.6 m rigid plate of white, laminated pressboard suspended by two 2-m-long strings. The strings allow it to swing freely between two stationary reference plates mounted on stands. A long-stroke shaker connected to the bottom edge of the plate by another string slowly moved the plate back and forth sinusoidally at 0.1 Hz (10 sec period). A repetitive, steady-state motion of approximately 12 cm zero-to-peak amplitude was achieved before any image acquisition occurred. A grid of dots was projected onto both the swinging and stationary plates with a small Kodak slide projector. Two synchronized Pulnix TM-1020-15 digital video cameras mounted on tripods recorded the motion, and Fig. 8(b) shows a typical pair of images. Excellent target contrast was obtained with both cameras by underexposing the images. A sequence of 200 frames was recorded at a sampling rate of five frames per second, corresponding to four cycles of the repetitive motion. These images were processed using the videogrammetry capabilities of the PhotoModeler software. Figure 8(c) shows the videogrammetrically determined out-of-plane motion of a target located near the bottom of the plate. These results are exactly as expected. The plot shows four cycles of steady sinusoidal motion with a zeroto-peak amplitude of about 12 cm. Recall that videogrammetry with projected-dot targets accurately measures the true 3D shape of the test object at every instant of time, but that each target will always move on a straightline path either towards or away from the projector. Consequently, the dots “slide over” the structure if it has any in-plane component of motion. Therefore, from the perspective of each camera (i.e., in the image planes), the observed path of motion of every projected dot is always a straight line segment, and this is exactly what was measured in this test of a swinging plate [Ref. 15]. For structures such as this (i.e., move primarily in one direction), there is little difference between the measured straight-line target trajectories and the true curved trajectories of the object. Figure 8(d) shows the videogrammetrically determined time history of a projected-dot target located on one of the stationary sidepieces. These results have an rms value of approximately 0.01 mm, which provides an estimate of the
5
measurement noise floor achieved in the test. Therefore, the signal-to-noise ratio of the measurement shown in Fig. 8(c) can be estimated to be about 12,000:1 or 82 dB. 4. 2m Matte Solar Sail Quadrant Figure 9 shows the second application of dot-projection videogrammetry. The test article is one quadrant of a fourquadrant 2m solar sail model constructed with matte-white Mylar (vellum) membranes. The test objective was to compare laser vibrometry and videogrammetry results for this flexible membrane structure using the same set of measurement points. Vellum is not a realistic solar sail material, but was installed here solely to simplify making comparative measurements with these two optical techniques. Figure 9(a) shows the test article, the grid of approximately 50 targets measured by both techniques, and the location of the scanning laser vibrometer (Polytec PSV300-H). The projected dot pattern was designed by computer to match the vibrometry measurement locations, and it was displayed using a digital LCD projector. There are also 10 retroreflective targets located on the two adjacent support rods that were also measured in both tests. The laser vibrometer was positioned approximately 3m back from the structure with its axis perpendicular to the membrane surface. It was aligned to point at the center of the quadrant in its zero position (i.e., where the elevation and azimuth angles of the steering mirrors for the laser beam were both zero). A standard vibration test was then conducted using random excitation of the lower-right corner of the sail with an attached electrodynamic shaker. Frequency response functions (FRFs) from 0-10 Hz between the membrane surface velocity measured with the vibrometer and the applied force were computed by the Polytec system for all measurement points. Using six ensemble averages, each FRF measurement required about four minutes to obtain, so that the total test duration to measure all points was about four hours. Figure 9(b) shows the mode at 3.34 Hz calculated by processing these FRFs with the ME’scopeVES commercial modal analysis software [Ref. 16]. Immediately after the vibrometry test finished (with the shaker still running at the same operating level), the digital projector was turned on and a sequence of images was acquired using two Pulnix TM-1020-15 video cameras. This videogrammetry test recorded 384 frames of data at 15 frames per second for a total test duration of about 25 seconds. Note that all measurement points are recorded simultaneously with videogrammetry rather than
sequentially as with scanning laser vibrometry, so the test duration can be much shorter. These images were processed with the same videogrammetric analysis software used in the previous oscillating-plate application. From the resulting time histories, response spectra were computed instead of FRFs because the current video system could not make a synchronized force measurement. Figure 9(c) shows the mode at 3.47 Hz calculated by processing these spectra with ME’scopeVES, and it shows good agreement with the corresponding vibrometry result. When animated, the two modes in Figs. 9(b) and 9(c) look nearly identical, so they are clearly the same flexible mode of the structure. There are some small amplitude differences, however. Three known factors contributing to these differences are: 1. The long duration of the laser vibrometry test (four hours) gave the opportunity for small changes in room temperature or humidity to affect the tension in the test article. Out-of-plane membrane stiffness depends only on the in-plane stress distribution, which may have changed somewhat over this time interval. 2. For modal analysis, the vibrometry test used traditional response/force FRFs whereas the videogrammetry test used (time-synchronized) response spectra instead. This difference caused some variation in the corresponding estimated modes. 3. The laser vibrometer system performed a standard cosine correction of all measurements made at non-perpendicular directions to the membrane surface, whereas the videogrammetry measurements are uncorrected (but could be in future tests if the projector location relative to the test object is quantified either in a separate photogrammetric test or by treating the projector as an additional camera within the photogrammetric procedure). LASER-INDUCED FLUORESCENCE As previously discussed, transparent and reflective membranes are difficult or impossible to measure with standard white-light dot projection because the majority of the projected light passes directly though the membrane (in the transparent case) or is reflected in undesirable directions (in the reflective case). Consequently, images with sufficiently high contrast are difficult to obtain. The images recorded to date with dot projection on reflective membranes required long image exposure times, making dynamic measurements impossible. To overcome these problems, transparent membranes have been manufactured containing a small quantity of fluorescent laser dye. When
6
excited with a laser light source, the dye absorbs a fraction of the laser energy and consequently fluoresces at a longer wavelength. This fluorescence is emitted in all directions providing a significantly more predictable and repeatable dot pattern that can be viewed from any angle [Ref. 17]. Figure 10(a) shows the test configuration for a proof-ofconcept demonstration of this proposed new approach for dot-projection photogrammetry and videogrammetry of membranes. Figure 10(b) shows the test article, which is a small sample of dye-doped CP-2 polyimide membrane wrapped around the top of a white cardboard tube. Note the almost transparent nature of the material. The membrane was illuminated with a laser-generated dot pattern using a 2 mW green (544 nm) helium-neon laser and a diffractive beam splitting element. Figure 10(c) shows a typical digital photograph taken with a low-pass optical filter placed in front of the camera. The filter blocks the reflected green laser light but allows the orange fluorescence light from the membrane dye to pass through. Note that laser speckle is not a problem [Ref. 11] because photographs are taken of the self-generated (orange) dots of light and not the directly reflected (green) dots of light from the laser. Using several images taken at other viewing angles, an accurate 3D model of the membrane, shown in Fig. 10(d), was obtained. Note that the bottom portion of the membrane with the white cardboard backing produces spots in Fig. 10(c) that are almost four times brighter than for the membrane without a backing. This is because the laser energy is scattered by the cardboard and passes though the polymer a second time, effectively doubling the laser (and hence fluorescence) intensity. The fluorescence emitted backwards is also scattered by the cardboard and becomes visible from the front. A similar increase in brightness is expected for doped transparent membranes that have a reflective back coating, such as a solar sail. The bright spot in the center of the pattern is due to the non-diffracted zero-order laser energy from the diffractive beam splitter. Experimentation continues with pulsed laser systems that will potentially allow acquisition of images at video frame rates and hence will provide the capability to make dynamic measurements of dye-doped transparent and reflective membranes that are currently impossible with white-light dot projection systems.
videogrammetry. However, when attached to delicate, thinfilm membranes of gossamer structures, their mass and stiffness can significantly alter the structural properties. Furthermore, retroreflective targets are time consuming to apply, cannot be easily moved, and are potentially damaging to the structure, especially if they must be removed after testing. On the other hand, using projected dots of light as targets has no effect whatsoever on the structure. Dot projection also has the advantage that the location, density, and size of the dots can be easily and quickly changed, enhancing measurement capability. This paper gave a comprehensive summary of the technology of dot-projection photogrammetry and videogrammetry, especially as it applies to the measurement of membrane structures. A detailed comparison of projecteddot targets and retroreflective adhesive targets for gossamer applications was provided in a summary table. The paper also explained what is measured with the dot-projection technique, something that is easily misunderstood especially for structural dynamic measurements. An important conclusion is that the dynamic information measured by videogrammetry with projected-dot targets is the same as that measured by scanning laser vibrometry if the vibrometer is located at the projector position and its “cosine correction” feature is turned off. Four laboratory applications demonstrated the effectiveness of white-light dot projection for static shape measurement of both opaque and reflective membranes and for dynamic measurement of opaque membranes. A novel laser-induced fluorescence approach was introduced that complements and in some ways exceeds the proven capabilities of the white-light dot projection method. This approach requires doping the membrane material with a small amount of fluorescent laser dye during its manufacture (or perhaps spraying or painting it on afterwards). When illuminated with a laser, the fluorescing dye emits light in all directions at a lower frequency than the light source. By using an optical low-pass filter on the camera, high-contrast targets are obtained even on transparent membranes. Coupled with the use of high-power pulsed lasers, this approach can be an enabling technology for making both static and dynamic measurements of the largest anticipated gossamer ground test articles (perhaps up to 30-50m in size) that will be built in the foreseeable future. ACKNOWLEDGMENTS
CONCLUSIONS Commonly used retroreflective adhesive targets provide high-contrast images for photogrammetry and
The authors acknowledge the technical support given by Mark Shortis of the University of Melbourne, Stuart Robson
7
Center,” Proceedings of ISPRS Commission V Symposium on Close-Range Imaging, Long-Range Vision, September 2002.
of University College London, Alan Walford of Eos Systems, Inc., and John Connell, Kent Watson, Keith Belvin, and Alpheus Burner of NASA Langley Research Center in this photogrammetry research activity. REFERENCES [1] Jenkins, C. H. M. (editor), Gossamer Spacecraft: Membrane and Inflatable Structures Technology for Space Applications, Vol. 191, Progress in Astronautics and Aeronautics, AIAA, Reston, VA, 2001, pp. 105108, 160-196, 213-215, 333-406, 497-498, and 548551. [2] Chmielewski, A. B., “Overview Structures,” ibid., pp. 1-33.
of
[10] Ganci, G. and Brown, J., “Developments in NonContact Measurement Using Videogrammetry,” Proceedings of the Boeing Large Scale Metrology Conference, February 2000. [11] Jones, T. W. and Pappa, R. S., “Dot Projection Photogrammetric Technique for Shape Measurements of Aerospace Test Articles,” AIAA Paper 2002-0532, Proceedings of the 40th AIAA Aerospace Sciences Conference, January 2002.
Gossamer
[3] Mikhail, E. M., Bethel, J. S., and McGlone, J. C., Introduction to Modern Photogrammetry, John Wiley and Sons, New York, 2001. [4] Atkinson, K. B. (editor), Close Range Photogrammetry and Machine Vision, Whittles Publishing, Scotland, UK, 2001. [5] Pappa, R. S., Giersch, L. R., and Quagliaroli, J. M., “Photogrammetry of a 5m Inflatable Space Antenna With Consumer-Grade Digital Cameras,” Experimental Techniques, Society for Experimental Mechanics, Vol. 25, No. 4, July/August 2001, pp. 21-29. [6] Giersch, L. R., “Pathfinder Photogrammetry Research for Ultra-Lightweight and Inflatable Space Structures,” NASA CR-2001-211244, November 2001. [7] Pappa, R. S., Jones, T. W., Black, J. T., Walford, A., Robson, S., and Shortis, M. R., “Photogrammetry Methodology Development for Gossamer Spacecraft Structures,” Sound and Vibration, Vol. 36, No. 8, August 2002, pp. 12-21. [8] Dharamsi, U. K., Evanchik, D. M., and Blandino, J. R., “Comparing Photogrammetry with a Conventional Displacement Measurement Technique on a Square Kapton Membrane,” AIAA paper 2002-1258, Proceedings of the 3rd AIAA Gossamer Spacecraft Forum, April 2002.
[12] Eos Systems, Inc., PhotoModeler Pro User Manual, Version 4.0, October 2000. [13] Adetona, O., Keel, L. H., Horta, L. G., Cadogan, D. P., Sapna, G. H., and Scarborough, S. E., “Description of New Inflatable/Rigidizable Hexapod Structure Testbed for Shape and Vibration Control,” AIAA Paper 20021451, Proceedings of the 3rd AIAA Gossamer Spacecraft Forum, April 2002. [14] Slade, K. N., Belvin, W. K., and Behun, V., “Solar Sail Loads, Dynamics, and Membrane Studies,” AIAA Paper 2002-1265, Proceedings of the 3rd AIAA Gossamer Spacecraft Forum, April 2002. [15] Black, J. T. and Pappa, R. S., “Videogrammetry Using Projected Circular Targets: Proof-of-Concept Test,” Proceedings of the 21st International Modal Analysis Conference, February 2003. [16] Vibrant Technology, Inc., ME’scopeVES Operating Manual, Version 3.0, September 2001. [17] Danehy, P. M., Jones, T. W., Connell, J. W., Belvin, W. K., and Watson, K. A., “Photogrammetry Method for Transparent, Reflective, or Dark Surfaces,” NASA Invention Disclosure File Number LAR-16426-1-ND, December 2001.
[9] Shortis, M. R., Robson, S., Pappa, R. S., Jones, T. W., and Goad, W. K., “Characterization and Tracking of Membrane Surfaces at NASA Langley Research
8
Table 1. Comparison of Retroreflective and Projected-Dot Targets for Gossamer Applications ADVANTAGES
DISADVANTAGES RETROREFLECTIVE TARGETS
2. Easily illuminated with a camera flash from long distances and therefore suitable for large structures.
1. Add considerable mass and stiffness to ultra-thin membranes. Note: Black borders may add more mass and stiffness than target material itself, but is generally needed for contrast.
3. Manufactured to tight tolerances in convenient tape strips or sheets of individual targets.
2. Inappropriate for certain delicate measurements such as measuring the size and shape of wrinkles.
4. Suitable for some gossamer spacecraft components, such as support booms.
3. Labor intensive to apply, and possibly remove, hundreds or thousands of targets.
5. Excellent contrast between targets and background in underexposed images. Simplifies and improves target centroiding.
4. Cannot change dot size and/or spacing without removing the targets and installing others.
1. Much brighter than other types of targets.
5. Thin membranes may tear if targets are removed. 6. Unaffected by test object reflectivity or transmissibility (can measure shiny and transparent membranes).
6. Target thickness (approximately 100 microns) must be accounted for in precision measurement applications.
7. Targets move with the structure. True 3D deformations at each location are measured. PROJECTED-DOT TARGETS 1. Add no mass or stiffness to test article.
1. Requires exceptionally bright projector for large structures (larger than approximately 5m).
2. Require no installation or removal time. 3. Can project 20,000+ targets onto a structure using a single projector and slide (can achieve high dot densities).
2. Flash projectors (e.g., GSI PRO-SPOT) are difficult to use on reflective membranes that may require longer camera exposure settings.
4. Dot size and/or spacing can be changed by simply changing slides.
3. Partial dots on membrane edges and folds are marked incorrectly by algorithms assuming an elliptical shape.
5. Can create custom dot patterns with smaller dots in some regions and larger dots in others.
4. May be obscured at certain viewing angles relative to projector.
6. Have no thickness, so the coordinates of the dot equal the coordinates of test article.
5. Dot intensity varies with distance and angle from projector. Complicates target centroiding and can reduce accuracy.
7. Can measure transparent membranes with special techniques (e.g., laser-induced fluorescence). 8. Projector can be used as another “camera” in data analysis.
6. Targets always move on straight lines either towards or away from the projector. Can measure only this component of motion.
9
2-quadrant 10m sail model
2m sail models
(a) 5m inflatable parabolic reflector
(b) Scale-model solar sails
Figure 1. Retroreflective targets on two large gossamer structures.
1.3 m
Figure 2. Approximately 4000 projected dots on a thin-film opaque membrane.
10
Area Photographed
Aluminized Kapton
Matte Mylar
(a) Test configuration
(b) 2.5 sec exposure
(c) 8.0 sec exposure
(d) 20.0 sec exposure
Figure 3. Comparison of projected dots on adjacent shiny and matte-white membranes at various image exposure settings.
(a) Standard Kodak carousel
(b) High-intensity carousel
(c) Digital projector
(d) Geodetic PRO-SPOT
Figure 4. Projectors used in this research.
(a) Olympus E-20 consumer camera, 2560 x 1920 pixels, 8 units available
(b) Kodak DCS-760M professional camera, 3024 x 2000 pixels, 4 units available
(c) Pulnix TM-1020-15 scientific video camera, 15 fps, 1008 x 1018 pixels, 4 units available
Figure 5. Digital cameras used in this research.
11
Right image
Left image
(a) Front surface
(b) Rear surface with projected dots
100
75
50
(c) Left image displayed at various binary intensity thresholds
RMS deviation from best-fit plane = 0.98 mm
(d) Two views of 3D point model obtained by photogrammetry Figure 6. Photogrammetry of 3m hexapod membrane reflector using approximately 500 projected dots.
12
Area Photographed
(b) Relief map of photogrammetry results 0.5
0.4
0.3
(a) Test article (2m x 2m)
5000 dots in area photographed 30 sec exposure time Approx. 1 mm wrinkle amplitude
0.2
0.1
0 0
0.1
0.2
0.3
0.4
0.5
0.6
0.7
0.8
(c) Contour plot of photogrammetry results Figure 7. Photogrammetry of 2m aluminized Kapton solar sail using approximately 5000 projected dots.
(a) Test configuration
(b) Images at t = 0 (c) Time history of moving target (on plate)
(d) Time history of stationary target
Figure 8. Videogrammetry of 0.6m oscillating white plate using approximately 200 projected dots.
13
(a) Test setup
(b) 3.34 Hz mode - laser vibrometry
(c) 3.47 Hz mode - videogrammetry
Figure 9. Videogrammetry of 2m matte-white solar sail quadrant with approximately 50 projected dots and comparison with corresponding laser vibrometry mode.
Membrane Structure
Camera 1
Diffractive Pattern Generator
Laser
Camera 2
(a) Test configuration for proof-of-concept experiment
(b) Transparent CP-2 + dye
(c) Fluorescence from laser dot projection (d) 3D surface by photogrammetry
Figure 10. Laser-induced fluorescence for dot-projection photogrammetry of transparent membranes.
14
Form Approved OMB No. 0704-0188
REPORT DOCUMENTATION PAGE
Public reporting burden for this collection of information is estimated to average 1 hour per response, including the time for reviewing instructions, searching existing data sources, gathering and maintaining the data needed, and completing and reviewing the collection of information. Send comments regarding this burden estimate or any other aspect of this collection of information, including suggestions for reducing this burden, to Washington Headquarters Services, Directorate for Information Operations and Reports, 1215 Jefferson Davis Highway, Suite 1204, Arlington, VA 22202-4302, and to the Office of Management and Budget, Paperwork Reduction Project (0704-0188), Washington, DC 20503.
1. AGENCY USE ONLY (Leave blank)
2. REPORT DATE
3. REPORT TYPE AND DATES COVERED
January 2003
Technical Memorandum
4. TITLE AND SUBTITLE
5. FUNDING NUMBERS
Dot-Projection Photogrammetry and Videogrammetry of Gossamer Space Structures
WU 755-06-00-21
6. AUTHOR(S)
Richard S. Pappa, Jonathan T. Black, Joseph R. Blandino, Thomas W. Jones, Paul M. Danehy, and Adrian A. Dorrington
7. PERFORMING ORGANIZATION NAME(S) AND ADDRESS(ES)
8. PERFORMING ORGANIZATION REPORT NUMBER
NASA Langley Research Center Hampton, VA 23681-2199
L-18255
9. SPONSORING/MONITORING AGENCY NAME(S) AND ADDRESS(ES)
10. SPONSORING/MONITORING AGENCY REPORT NUMBER
National Aeronautics and Space Administration Washington, DC 20546-0001
NASA/TM-2003-212146
11. SUPPLEMENTARY NOTES
Presented at the 21st International Modal Analysis Conference (IMAC); Kissimmee, Florida; February 3-6, 2003. 12a. DISTRIBUTION/AVAILABILITY STATEMENT
12b. DISTRIBUTION CODE
Unclassified-Unlimited Subject Category 39 Distribution: Standard Availability: NASA CASI (301) 621-0390 13. ABSTRACT (Maximum 200 words)
This paper documents the technique of using hundreds or thousands of projected dots of light as targets for photogrammetry and videogrammetry of gossamer space structures. Photogrammetry calculates the threedimensional coordinates of each target on the structure, and videogrammetry tracks the coordinates versus time. Gossamer structures characteristically contain large areas of delicate, thin-film membranes. Examples include solar sails, large antennas, inflatable solar arrays, solar power concentrators and transmitters, sun shields, and planetary balloons and habitats. Using projected-dot targets avoids the unwanted mass, stiffness, and installation costs of traditional retroreflective adhesive targets. Four laboratory applications are covered that demonstrate the practical effectiveness of white-light dot projection for both static-shape and dynamic measurement of reflective and diffuse surfaces, respectively. Comparisons are made between dot-projection videogrammetry and traditional laser vibrometry for membrane vibration measurements. The paper closes by introducing a promising extension of existing techniques using a novel laser-induced fluorescence approach.
14. SUBJECT TERMS
15. NUMBER OF PAGES
Photogrammetry, Videogrammetry, Projected-Dot Targets, Gossamer Space Structures, Laser-Induced Fluorescence 17. SECURITY CLASSIFICATION OF REPORT
Unclassified NSN 7540-01-280-5500
18. SECURITY CLASSIFICATION OF THIS PAGE
Unclassified
19 16. PRICE CODE
19. SECURITY CLASSIFICATION OF ABSTRACT
Unclassified
20. LIMITATION OF ABSTRACT
UL Standard Form 298 (Rev. 2-89)
Prescribed by ANSI Std. Z-39-18 298-102