Page 1 of 64
The Plant Phenome Journal Accepted Paper, posted 10/16/2018. doi:10.2135/tppj2018.07.0005
1
A low-cost automated system for high-throughput phenotyping of single oat seeds
2
James W. Clohessy*†, Duke Pauli‡, Kevin M. Kreher, Edward S. Buckler V, Paul R. Armstrong,
3
Tingting Wu, Owen A. Hoekenga, Jean-Luc Jannink, Mark E. Sorrells, and Michael A. Gore*
4 5
J. W. Clohessy, D. Pauli, K. M. Kreher, E. S. Buckler V, M. E. Sorrells, and M. A. Gore. Plant
6
Breeding and Genetics Section, School of Integrative Plant Science, Cornell University, Ithaca,
7
NY 14853 USA; P. R. Armstrong, United States Department of Agriculture - Agriculture
8
Research Service (USDA-ARS), Center for Grain and Animal Health Research, Manhattan, KS
9
66502 USA; T. Wu, Northwest A&F University, No. 3 Taicheng Road, Yangling, Shaanxi
10
712100 China; O. A. Hoekenga, Cayuga Genetics Consulting Group LLC, Ithaca, NY 14850
11
USA; J.-L. Jannink, USDA-ARS, Robert W. Holley Center for Agriculture and Health, Plant
12
Breeding and Genetics Section, School of Integrative Plant Science, Cornell University, Ithaca,
13
NY 14853 USA.
14 15
J. W. Clohessy and D. Pauli contributed equally to this work.
16 17
† Present address: North Florida Research and Education Center, University of Florida, 155
18
Research Road, Quincy, FL 32351 USA.
19
‡ Present address: School of Plant Sciences, University of Arizona, 451A Marley Hall, Tucson,
20
AZ 85721 USA.
21 22
*Corresponding authors.
23
Email address:
[email protected] (M. A. Gore)
1
The Plant Phenome Journal Accepted Paper, posted 10/16/2018. doi:10.2135/tppj2018.07.0005
24
Mailing address: Plant Breeding and Genetics Section, School of Integrative Plant Science,
25
Cornell University, 358 Plant Science Building, Ithaca, NY 14853 USA
26 27
Email address:
[email protected] (J.W. Clohessy)
28
Mailing Address: North Florida Research and Education Center, University of Florida, 155
29
Research Road, Quincy, FL 32351 USA
2
Page 2 of 64
Page 3 of 64
30
The Plant Phenome Journal Accepted Paper, posted 10/16/2018. doi:10.2135/tppj2018.07.0005
Core Ideas
31
A single-seed analyzer system was modified to provide low-cost seed imaging.
32
The system throughput allows rapid, non-destructive phenotyping of single seeds.
33
Accuracy of seed shape and size measurements were similar to those obtained manually.
34
Repeatabilities of morphometric seed traits were higher than seed color traits.
3
The Plant Phenome Journal Accepted Paper, posted 10/16/2018. doi:10.2135/tppj2018.07.0005
35
Abstract
36
Efforts focused on the genetic improvement of seed morphometric and color traits would greatly
37
benefit from efficient and reliable quantitative phenotypic assessment in a non-destructive
38
manner. Although several seed phenotyping systems exist, none of them combine the cost-
39
effectiveness, identity preservation, throughput, and accuracy needed for implementation in plant
40
breeding. We integrated an image analysis component into a single-seed analyzer (SSA) system
41
that also captures near-infrared reflectance (NIR) and weight data. Through the development and
42
utilization of an open-source computational image analysis pipeline, image data acquired by two
43
cameras mounted on the SSA machine were automatically processed to derive estimates of
44
length, width, height, volume, and color for 96 individual dehulled seeds (groats) of five oat
45
genotypes replicated across days. With the exception of color, the four traits were found to be
46
strongly correlated with and have repeatabilities comparable to manual measurements. The seed
47
color values had moderately strong correlation with those measured by a colorimeter, but further
48
improvements to the SSA system are needed to increase measurement accuracy. These results
49
demonstrate that the SSA system has the potential to provide a low-cost solution for the rapid,
50
accurate measurement of morphological traits on individual seeds of oat and potentially other
51
crop species, allowing for the screening of seeds from numerous genotypes in breeding
52
programs.
53 54
Abbreviations
55
BLUE, best linear unbiased estimator; CART, classification and regression tree; CIELAB,
56
Commission Internationale de l'Eclairage L*a*b*; EFD, elliptic Fourier descriptors; GIMP,
4
Page 4 of 64
Page 5 of 64
The Plant Phenome Journal Accepted Paper, posted 10/16/2018. doi:10.2135/tppj2018.07.0005
57
GNU image manipulation program; NIR, near-infrared reflectance; NMR, nuclear magnetic
58
resonance; RGB, red, green, and blue; SSA, single-seed analyzer.
5
The Plant Phenome Journal Accepted Paper, posted 10/16/2018. doi:10.2135/tppj2018.07.0005
59
Introduction Cereal yield, measured as the amount of dry grain over a harvested area (kg/ha), has a
60 61
complex genetic architecture consisting of numerous small-effect loci that interact with the
62
environment. The grain (or seed) yield of small grain cereals, including oat (Avena sativa L.),
63
common wheat (Triticum aestivum L.), and barley (Hordeum vulgare L.) can be separated into
64
three primary components that are typically more heritable and genetically tractable than yield
65
itself: individual seed weight, seed number per spike, and spikes or reproductive tillers on a per
66
area basis (Rustgi et al., 2013). Of these three components, the weight of an individual seed is
67
largely determined by both the rate and duration of seed fill that occurs from anthesis to
68
maturity. The accumulation of water and dry matter (e.g., carbohydrates, oil, protein etc.)
69
throughout this developmental period results in changes to seed length, width, height, and
70
volume, all of which contribute to defining the final dry weight of an individual seed (Xie et al.,
71
2015).
72
In oat, a single grain consists of a groat (caryopsis) and a hull, with the hull removed by a
73
mechanical dehuller during the milling process for human consumption. The size and shape of
74
the groat is important because it affects the maximum size of oat flakes, milling yield, and test
75
weight (Doehlert et al., 2006; Groh et al., 2001). Additionally, low groat weight has been
76
associated with high oil concentration (Peterson and Wood, 1997). Oat in particular is consumed
77
as a whole grain, and consumers have shown preference for groats based on color (Johnson et al.,
78
1997). Furthermore, constituents such as lignin and suberin may be surface enriched in the oat
79
groat, affecting both color and quality (Miller and Fulcher, 2016). To improve via direct
80
selection on these traits, oat breeding programs need a phenotyping platform that provides
6
Page 6 of 64
Page 7 of 64
The Plant Phenome Journal Accepted Paper, posted 10/16/2018. doi:10.2135/tppj2018.07.0005
81
accurate and precise quantitative measures of single dehulled seeds (hereafter seeds) in a cost-
82
effective, high-throughput manner.
83
While it is possible to manually measure the dimensions and weight of a single seed
84
using a digital caliper and analytical lab balance, there are restrictions on the number of samples
85
that can be quickly and cheaply processed and the accuracy to which two- and three-dimensional
86
(2D and 3D) parameters can be estimated. To overcome these limitations, past efforts have
87
focused on the use of digital image analysis for the phenotyping of individual seeds, but these
88
methods are not without weaknesses. Elliptic Fourier (EF) analysis implemented in the software
89
SHAPE (Iwata and Ukai, 2002) enables the 2D closed contour shape variation of seed to be
90
described by Fourier series expansions (i.e., a series of curves that approximate the curve under
91
consideration) through the generation of Elliptic Fourier descriptors (EFDs). This image-based
92
analysis approach allowed for the genetic architecture of rice (Oryza sativa L.) grain shape to be
93
studied, which provided novel insight into the genetics responsible for trait variation (Iwata et
94
al., 2010). However, the sampled seeds had to be carefully oriented for imaging in a manual
95
fashion, and principal components of the coefficients of the EFDs rather than physical
96
measurements (e.g., length, width etc.) were used as morphological phenotypes (Iwata et al.,
97
2010, Williams et al., 2013). More recently, the development of software methods for the
98
analysis of images acquired by consumer grade flatbed scanners has enabled the measurement of
99
various 2D seed shape parameters and color (Moore et al., 2013, Tanabata et al., 2012, Whan et
100 101
al., 2014), but has lacked the additional dimension needed to measure seed height. Instruments constructed to enable non-destructive phenotyping of individual seeds from a
102
range of small- to large-seeded plant species have potential to overcome the drawbacks of early
103
generation digital image analysis systems. As an example, Spielbauer et al. (2009) constructed an
7
The Plant Phenome Journal Accepted Paper, posted 10/16/2018. doi:10.2135/tppj2018.07.0005
104
instrument that collected near-infrared reflectance (NIR) and weight data on single maize (Zea
105
mays L.) seeds to predict grain quality traits such as protein and starch content. This instrument
106
served as the basis for building a single-seed analyzer (SSA) machine to collect the same data
107
types from individual oat seeds (Montilla-Bascón et al., 2017). However, these and other related
108
high-throughput systems (Melchinger et al., 2018, Rolletschek et al., 2015) for evaluating end
109
use quality traits do not have the capability to measure seed morphometric characteristics such as
110
length, width, and height. Illustrative of the advantages derived from integrating lab automation
111
and digital image analysis, the phenoSeeder system constructed by Jahnke et al. (2016)
112
employed a volume-carving method (Roussel et al., 2016) to reconstruct the three-dimensional
113
(3D) shape of individual seeds. Although the system had high reproducibility for the measured
114
seed morphological traits such as volume and mass, it was hindered by a less than optimal
115
throughput and complexity of the robotics needed to manipulate individual seeds.
116
In an effort to address the individual seed phenotyping needs of oat breeding programs,
117
we incorporated an imaging component into the existing low-cost SSA machine of Montilla-
118
Bascón et al. (2017) that already had NIR spectroscopy and weighing capabilities. The objectives
119
of our study were to: (i) develop an open-source computational pipeline for oat seed image
120
analysis, (ii) quantify morphological and color phenotypes of individual seeds from five oat
121
genotypes and compare the results to manual measurements, and (iii) estimate the number of oat
122
seeds that need to be phenotyped to provide high trait repeatabilities and accurate estimation of
123
trait parameters.
124 125
Materials and Methods
126
Oat Samples for Measurements
8
Page 8 of 64
Page 9 of 64
The Plant Phenome Journal Accepted Paper, posted 10/16/2018. doi:10.2135/tppj2018.07.0005
127
In 2015, a set of five different oat genotypes (Ogle, Newdak, Corral, Hidalgo, and
128
SD081107) was evaluated at Cornell University’s Snyder Farm in Ithaca, NY. Conventional oat
129
cultivation practices for the Northeastern US were employed. The plots were mechanically
130
harvested. After harvesting, grain samples were placed in a dryer at 21 C to remove excess
131
moisture and dehulled using a mechanical dehuller (Codema LLC, Maple Grove, MN, USA).
132
The visual color differences observed among the dehulled seeds (groats) from the five oat
133
genotypes spanned a narrow range of hue, saturation, and lightness values for the color brown.
134
Only unbroken and healthy seeds were evaluated using the SSA. For each genotype, 96 seeds
135
were randomly sampled and individually placed into two 48-well plates for replicated
136
measurements with the SSA.
137 138 139
SSA Design, Function, and Control The SSA provides NIR spectroscopy paired with weight measurement and imaging to
140
non-destructively phenotype single seeds rapidly in a batch process that preserves the identity of
141
seeds by placing them in the same well position of a second receiving plate (Supplemental Fig.
142
S1). This design of the SSA (Supplemental Fig. S2) represents a combination and improvement
143
of two previously constructed seed analysis devices (Spielbauer et al., 2009, Ziegler et al., 2013).
144
The NIR component of the SSA was not a focus of this study, but has been previously
145
demonstrated for individual dehulled oat seeds by Montilla-Bascón et al. (2017). In this study,
146
individual seeds were processed through the SSA for weight measurement and imaging using
147
gravity-enhanced compressed air and a series of V-shaped trough seed slides.
148 149
The controlling software for the SSA used Visual C++ based on Visual Studio 2010 and a SQL Server 2008 database (Microsoft Inc., Redmond, WA, USA). Multithreading, consisting of
9
The Plant Phenome Journal Accepted Paper, posted 10/16/2018. doi:10.2135/tppj2018.07.0005
150
five threads, was used for collecting data or controlling each instrument component. These were
151
a primary thread and an X-Y table, NIR spectrometer, analytical balance, and camera thread. The
152
primary thread provided a user interface and interacted with the other four threads that served as
153
subordinate threads. Each subordinate thread undertook separate tasks related to different
154
hardware/sensor requirements as indicated by their names.
155 156 157
Seed Plate Loading and Seed Weight Data Collection The SSA was used to analyze 96 or 192 seeds in a single session, as seeds placed into
158
two or four 48-well plates were stored on the SSA. A total of three sessions were required to
159
analyze the 10 48-well plates on each day. In all, the complete set of 10 plates were analyzed on
160
six different days, for a total of six repeated measurements per seed. The run order of the 10
161
plates was randomized across the three sessions on each day. For each session, two or four 48-
162
well plates were inverted and loaded onto an indexing X-Y table that was used to deliver
163
individual seeds sequentially into the SSA. Single seeds traveled through a glass tube and then
164
dropped onto an analytical balance (GH-200, A&D Company Limited, Tokyo, Japan) to obtain a
165
weight measurement. Once a stable seed weight was recorded, a burst of compressed air ejected
166
the seed into a funnel that guided the seed onto a slide and then onto a rotary imaging table.
167 168 169
Seed Image Data Collection The SSA used a rotary imaging table (Supplemental Fig. S3) that rotated the seed to the
170
web camera (model C615, Logitech, Lausanne, Switzerland) imaging position, enabling the
171
acquisition of top and side view seed images and eventual deposition of the seed in the same
172
position of a second 48-well plate, so as to retain seeds in their original order (Supplemental Fig.
10
Page 10 of 64
Page 11 of 64
The Plant Phenome Journal Accepted Paper, posted 10/16/2018. doi:10.2135/tppj2018.07.0005
173
S2). To block any reflections and non-seed objects from the side and top cameras, top (4.5 × 3
174
cm) and side (4.9 × 2.7 cm) backgrounds made from matte black construction paper (Mi-teintes
175
160 GSM #425 Stygian Black, Canson, Annonay, France) were attached to the rotary imaging
176
table. This allowed for a consistent image background at any location where a seed could be
177
imaged on the table, but with a tradeoff of eliminating the potential imaging benefit of a bottom
178
view camera.
179
We provided uniform lighting across the seed by constructing a lighting system with
180
multiple spectra and variable intensity. Briefly, an aluminum shroud with a diameter of 9 cm and
181
a 1 cm diameter hole in the center was affixed to each of the web cameras, serving as a mount
182
for strips of LED lights. Each strip consisted of six LED lights. Two sets of three strips were
183
placed around the lens of the top camera, and three strips were placed on the top half of the side
184
camera. The LED strip lights consisted of three light colors: 4000K neutral white (model
185
2026NW-40K, Qurosy, Shenzhen, China), 3100K warm white (model 2026WW-31K, Qurosy,
186
Shenzhen, China), and 395-405nm UV (model 5050, Joygo, Guangdong, China). All of the same
187
color LEDs were on a separate circuit, with each circuit having a potentiometer dimmer (model
188
T90040, Triangle Bulbs, Linden, NJ, USA) to control the intensity of light. The UV lights were
189
disabled and intended to detect phenotypes beyond those included in this study.
190
The warm and neutral white light potentiometers were set to 534Ω and 557Ω of
191
resistance for LEDs, respectively, to produce a full color gradient on the seeds without
192
overexposure. For the top camera, white balance and exposure values were set manually using
193
the Logitech driver software and images of a standard grey card (model 24 ColorCard,
194
CameraTrax, Menlo Park, CA, USA). Similarly, the focus was manually set for both web
195
cameras using settings in the Logitech driver software and images of 8pt Times New Roman
11
The Plant Phenome Journal Accepted Paper, posted 10/16/2018. doi:10.2135/tppj2018.07.0005
196
printed text. The web cameras were instructed to take an image by the SSA control software
197
using the OpenCV Visual C++ library (www.opencv.org). Each webcam provided a 1920 × 1080
198
single bitmap image that was received by the OpenCV software and saved to a hard drive
199
directory.
200
In total, 5,760 bitmap images were generated, comprising 2,880 sets of top and side
201
images (Supplemental Table S1). To improve portability, all bitmap images were converted to
202
PNG-24 format. The machine technician recorded if any seeds were lost or potentially reordered,
203
resulting in the removal of 90 image sets prior to image processing. The raw image data are
204
available upon written request.
205 206 207
Image Color Correction The process to estimate seed length, width, height, volume, and color from images
208
required a multistep computational pipeline (Supplemental Fig. S4). The web camera software
209
did not allow the application of separate image settings to different web cameras connected to
210
the same computer, thus the color accuracy of the top camera was prioritized over the side
211
camera. Briefly, we initiated color correction of all collected image data using a color reference
212
card (model 24 ColorCard) imaged by the top camera at the start of each of the six days. Each
213
image of the color reference card was analyzed using GNU Image Manipulation Program
214
(GIMP) (www.gimp.org) by selecting all of the pixels contained in the grey color box on the
215
imaged reference card. With the mean red, green, and blue values of the selected area, individual
216
channel offsets were determined by calculating the difference between these mean values and
217
values expected for the reference (red = 162, green = 163, blue = 162). These calculated daily
218
offsets of a few pixels were applied to both top (i.e., color and light fluctuation correction) and
12
Page 12 of 64
Page 13 of 64
The Plant Phenome Journal Accepted Paper, posted 10/16/2018. doi:10.2135/tppj2018.07.0005
219
side (i.e., only light fluctuation correction) images using a color offset function in IrfranView
220
(www.irfanview.com) (Supplemental Fig. S5).
221 222 223
Top Image Cropping and Seed Segmentation There was inherent variability in where seeds were positioned on the matte black
224
background affixed to the rotary imaging table such that not every imaged seed was centered
225
relative to the top web camera. Therefore, image cropping was needed to reduce extraneous
226
background area that otherwise significantly increased image processing time. Through
227
implementation of an image pre-processing Python script (sapre-processing.PY;
228
https://github.com/GoreLab/SSA_Image_Processor) that utilized OpenCV and Pillow modules,
229
all top camera images were cropped at the extreme top and left sides. Removal of pixels from the
230
right and bottom sides would also be preferred for processing speed, but the variability in seed
231
positions necessitated the inclusion of these sides.
232
To detect and segment seed pixels from the background area of all top camera images,
233
the EasyPPC software (Guo et al., 2013) used a classification and regression tree (CART) model
234
to differentiate seed from background (Supplemental Fig. S6). The CART model was trained
235
using a random selection of 33 color corrected and six non-color corrected top camera images.
236
The addition of non-color corrected images provided a wider color palette, improving results for
237
darker and lighter hues caused by shading and glare, respectively.
238 239 240 241
Side Image Cropping and Seed Segmentation Variability in seed position on the matte black background was even more extreme in side camera images. Therefore, the image pre-processing Python script was used in combination
13
The Plant Phenome Journal Accepted Paper, posted 10/16/2018. doi:10.2135/tppj2018.07.0005
242
with the EasyPPC software to crop the side images. The top and bottom rows of each side image
243
were cropped by the Python script, as those areas could not contain a seed. Subsequently, the
244
EasyPCC software used a CART model to detect the matte black background in each side image,
245
resulting in cropped side images that were segmented into non-background and background areas
246
(Supplemental Fig. S7). This CART model was trained using a random selection of 33 color
247
corrected side images that had their top and bottom rows cropped as described above. Next, all
248
image areas detected as not of interest (i.e., neither the matte black background nor seed) were
249
cropped for a second time by the Python script, producing images of a seed against the matte
250
black background. Finally, the EasyPCC software used a second CART model trained to detect
251
the seed from the remaining background. We trained this CART model using a random selection
252
of 35 images from the second round of cropping (Supplemental Fig. S8).
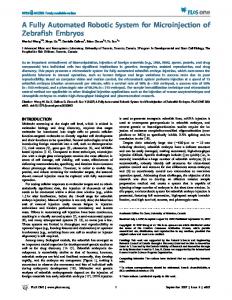
253
When training the CART models for side images, the EasyPPC software often detected
254
colors in the regions of interest that were the same or similar to those found in the background
255
area of the images. The occurrence of these false positives was minimized using an iterative
256
process where a CART model was trained, applied to a test set of images, evaluated, and
257
retrained, if needed. The metric for model evaluation was proper detection of the seed
258
boundaries, such that there were fewer regions at the seed-background boundary where the seed
259
was improperly labeled as background. If severe encroachment was found, the CART model was
260
retrained with a different background area highlighted. This process was repeated no more than
261
two times. All images used for model training were removed from the result set (Supplemental
262
Table S1).
263 264
Image-based Measurement of Seed Height, Length, and Width
14
Page 14 of 64
Page 15 of 64
265
The Plant Phenome Journal Accepted Paper, posted 10/16/2018. doi:10.2135/tppj2018.07.0005
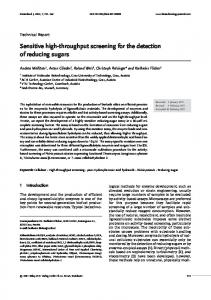
The top and side segmented images were used to measure seed phenotypes. The Python
266
OpenCV module was used in the main-processing Python script (Samain.PY;
267
https://github.com/GoreLab/SSA_Image_Processor) to create a 2D rectangle around the seed in
268
both the top and side images (Supplemental Fig. S9). The edges of the rectangle were bound to
269
the outermost points of the seed. The rectangle was allowed to freely rotate, thus minimizing the
270
size. The length and width of this translated and rotated rectangle in the top image represented
271
the length and width of the seed in pixels. Seed height in pixels was found using the same
272
process of rectangle translation and rotation applied to the side image. Other variables measured
273
from this 2D rectangle included the position in the image and the angle of the midline of the
274
seed. These two variables were used to convert the measured pixels to millimeters.
275
Conversion of pixel measurements to seed length in millimeters was accomplished using
276
scaling variables calculated from calibration images (i.e., images of a ruler) taken before the
277
experimental seeds were processed through the SSA. For the top image of the seed, the process
278
of pixel to millimeter conversion was linear as the seed always fell in the same plane. However,
279
for the side image the position of the seed was subject to change between images due to the
280
physical design of the SSA. To address this, a series of calibration images were taken using the
281
side camera with a ruler placed at several different known distances from the camera. The
282
scaling factors produced from this process allowed a pixel representing a portion of a seed at a
283
known distance from the side camera to be converted to a millimeter distance. The top camera
284
image contained the position of the seed and thus the distance between the seed and side camera
285
could be calculated. Using the pixel height of the seed found in the side image, the scaling
286
factors were used to convert the side image height distance from pixels to millimeters. This
15
The Plant Phenome Journal Accepted Paper, posted 10/16/2018. doi:10.2135/tppj2018.07.0005
287
process of finding the seed location and scaling was repeated for each set of images and, as such,
288
for each seed.
289 290
Seed Image Error Detection
291
The SSA collected a low number (~13%) of top and side images that contained
292
misaligned or missing seeds. Briefly, the main-processing Python script (Samain.PY) detected
293
these error events by analyzing several seed phenotypes and their positions in both the top and
294
side images. The position of the seed was saved as a binary 2D array representing the pixels that
295
contain the seed in the image and the non-seed containing pixels. The perimeter of this array was
296
compared with the max bounds of the source raw image. If the perimeter intersected with the
297
max bounds, then this indicated that the seed was only partially in the image. Next, the area of
298
the seed as defined by the total number of pixels was found using the binary 2D array. If the total
299
number of pixels comprising the seed was less than 400 pixels (i.e., an order of magnitude less
300
than an averaged sized seed), then this indicated that only dust or debris (i.e., no seed) was
301
detected. If the total number of pixels encompassing the seed was an order of magnitude more
302
than an average sized seed, then this indicated a likely non-seed object in the image. Lastly, seed
303
angle measurements from the top image were used to identify potential errors contained in the
304
side image. If the angle of the seed was greater than 80° with respect to the x-axis in the top
305
image, then this indicated that the side image would only contain a small cross-section of the
306
seed. Therefore, seed volume could not be accurately estimated. Top and side images having
307
seed perimeter, area, and/or angle values exceeding these defined thresholds were flagged in the
308
output data file with a description of detected errors. Flagged images were removed and not
309
included in the analyzed results (Supplemental Table S1).
16
Page 16 of 64
Page 17 of 64
The Plant Phenome Journal Accepted Paper, posted 10/16/2018. doi:10.2135/tppj2018.07.0005
310 311 312
Image-based Seed Volume Measurement Volume of an individual seed was estimated using an ellipsoidal approximation of the
313
seed cross-section in combination with a Riemann sum over the length of the seed. Briefly, the
314
data from the top and side images were used to create a 2D seed location array, which was then
315
used to measure the height and width of any given cross section and total length (Supplemental
316
Fig. S10). Notably, the side image array rarely matched the top image array with respect to
317
length because of the variability in seed angle. To resolve this issue, we scaled the side array
318
along the seed length axis, enabling the pixel length of the side array to equal the pixel length of
319
the top array. The seed height was proportionally maintained throughout this process.
320 321
The estimated height, width, and rescaled length values were used to estimate volume as follows: 𝑙=𝐿
𝑉𝑜𝑙𝑢𝑚𝑒 = ∑𝑙 = 0𝜋 ⋅
322
𝑤(𝑙) ℎ(𝑙) 2 ⋅ 2
⋅ 𝛥𝑙
(Equation 1)
323
where summation occurs along the length of the 2D array from 𝑙 = 0 to 𝑙 = 𝐿 where 𝐿 represents
324
the total array length in pixels. The area of an ellipse and, as such, the cross sectional area at any
325
point in the seed 𝑙 is given by 𝜋 ⋅
326
respectively, at point 𝑙 along the length of the 2D seed location arrays. 𝑤(𝑙) and ℎ(𝑙) were
327
calculated first in pixels and then scaled to millimeters using the scale factors previously
328
described in the “Image-based measurement of seed height, length, and width” section of the
329
Materials and Methods. The cross section as defined above was multiplied by the length of each
330
pixel step 𝛥𝑙 in millimeters and summed over the length of the seed, generating an estimated
331
value for the volume.
𝑤(𝑙) ℎ(𝑙) 2 ⋅ 2
where 𝑤(𝑙) and ℎ(𝑙) represent the width and height,
332
17
The Plant Phenome Journal Accepted Paper, posted 10/16/2018. doi:10.2135/tppj2018.07.0005
333
Image-based Seed Color Measurement
334
Seed color was measured using the color calibrated top camera image and 2D array of
335
pixels that represented the seed location. As an example of this procedure, Supplemental Fig.
336
S11 shows a red line boundary around the pixels used for color detection. The main-processing
337
Python script (Samain.PY) recorded every colored pixel and its color value, followed by the
338
creation of a comma delimited text file. The comma separated values (CSV) file contained a row
339
for each seed with three columns containing the average red, green, or blue (RGB) color value
340
over the entire seed. These color value data were only available for the oat genotypes Ogle and
341
Hidalgo on five of the six days, but were obtained for the other three oat genotypes (Newdak,
342
Corral, and SD081107) on all six days.
343 344 345
Final Data Output from Image Analysis The final phenotypic data file generated by the main-processing Python script
346
(Samain.PY) was a CSV file containing individual seeds as rows and the seven seed phenotypes
347
(length, width, height, average red, average green, average blue, and volume) as columns. An
348
additional column included script error messages or warnings that indicated missing image files
349
or data points where the phenotype values were outside of expected ranges.
350 351 352
Manual Seed Measurements Manual measurements of length, height, and width on individual seeds were performed
353
with a digital caliper (model 500-171-30, Mitutoyo, Kawasaki, Japan) having a measurement
354
accuracy of +/-0.01 mm. The digital caliper directly sent measurements to a laptop via a USB
18
Page 18 of 64
Page 19 of 64
The Plant Phenome Journal Accepted Paper, posted 10/16/2018. doi:10.2135/tppj2018.07.0005
355
connection. All seed positions were maintained within the tray, and seed measurements were
356
taken by two different technicians. Length was defined as the radius that is parallel to the seed crease, whereas height was
357 358
defined as the axis that intersects the seed crease at the top and the embryo at the bottom. Width
359
was defined as the remaining axis that is perpendicular to the seed crease. These measurements
360
were used to calculate the volume of an ellipsoid as follows: 4
361 362
(Equation 2)
𝑉𝑜𝑙𝑢𝑚𝑒 = 3𝜋𝑎𝑏𝑐
where a is the radius and b and c are the axes of the ellipsoid. Seed weights obtained by the SSA were independently validated by two technicians that
363 364
manually weighed each seed using the same scale (GH-200, A&D Company Limited, Tokyo,
365
JPN).
366
A colorimeter (model CR-400, Konica Minolta, Tokyo, Japan) was used to measure seed
367
color for each genotype by bulking the two trays of 96 seeds for each genotype. The colorimeter
368
was first calibrated using the included white standard panel and set to use a 2° view angle and a
369
D65 illuminant. Each set of seeds was placed within a glass dish, ensuring that there were at least
370
two layers of seeds throughout and no visible bottom. The colorimeter was then placed over the
371
center of the petri dish and moved around the sample to collect a total of 100 color
372
measurements. The colorimeter returned measurements in the L*a*b* color space format. The
373
measurements were made by two different technicians on different days.
374 375
Statistical Analyses
19
Page 20 of 64
The Plant Phenome Journal Accepted Paper, posted 10/16/2018. doi:10.2135/tppj2018.07.0005
376
To assess whether the raw SSA phenotypic data contained significant outliers, we
377
initially fitted a mixed linear model for each of the eight seed traits in ASReml-R version 3.0
378
(Gilmour et al., 2009):
379
Yijk = µ + genotypei + dayj + (genotype×day)ij + tray(genotype)ki + εijk,
(Equation 3)
380
in which Yijk is the individual phenotypic observation; µ is the grand mean; genotypei is the
381
effect of the ith genotype; dayj is the effect of the jth day of samples being run; (genotype×day)ij
382
is the interaction effect between the ith genotype and jth day; tray(genotype)ki is the effect of the
383
kth tray nested within the ith genotype; and εijk is the residual error effect assumed to be
384
independently and identically distributed according to a normal distribution with mean zero and
385
variance 𝜎2𝜀 , that is ~iid N(0, 𝜎2𝜀 ). The model terms genotypei, dayj, and (genotype×day)ij were
386
fitted as fixed effects, while tray(genotype)ki was modeled as a random effect according to ~iid
387
N(0, 𝜎2). To detect significant outliers, Studentized deleted residuals (Neter et al., 1996) obtained
388
from these mixed linear models were examined. Data transformations and unequal variance
389
models were not needed because the assumptions of normality and homoscedasticity were met.
390
Once significant outliers were removed, an iterative mixed linear model (Equation 3)
391
fitting procedure was conducted in ASReml-R version 3.0. Likelihood ratio tests were conducted
392
to remove terms fitted as random effects that were not significant at α = 0.05 (Littell et al., 2006).
393
The final model for each trait was used to estimate a best linear unbiased estimator (BLUE) for
394
each genotype on individual days and across all six days. Sequential tests of fixed effects were
395
conducted with degrees of freedom being calculated using the Kenward-Rogers (KR)
396
approximation (Kenward and Roger, 1997). The KR approximation, which uses a scaled Wald
397
statistic that involves an approximate covariance matrix to account for variability introduced due
398
to estimation of variance components, adjusts the degrees of freedom used in tests of
20
Page 21 of 64
The Plant Phenome Journal Accepted Paper, posted 10/16/2018. doi:10.2135/tppj2018.07.0005
399
significance together with an F approximation of the sampling distribution for the scaled Wald
400
statistic (Kenward and Roger, 1997). The bias-adjusted degrees of freedom in the KR
401
approximation results in more conservative estimates of significance values associated with
402
model terms.
403
The mixed linear model analysis of phenotypic data obtained by a handheld digital
404
caliper and analytical balance was identical to that used for the SSA data, with the exception of
405
having fitted the following model in ASReml-R version 3.0:
406
Yijk = µ + genotypei + techj + (genotype×tech)ij + tray(genotype)ki + εijk,
(Equation 4)
407
in which Yijk is the individual phenotypic observation collected with the digital caliper or
408
analytical balance; µ is the grand mean; genotypei is the effect of the ith genotype; techj is the
409
effect of the jth technician who has taken measurements; (genotype×tech)ij is the interaction
410
effect of the ith genotype with the jth technician; tray(genotype)ki is the effect of the kth tray
411
nested within the ith genotype; and εijk is the residual error effect assumed to be ~iid N(0, 𝜎2𝜀 ).
412
The model term genotypei was the only fixed effect, while all other terms were modeled as
413
random effects according to ~iid N(0, 𝜎2). Data transformations and unequal variance models
414
were not needed in this analysis. For each trait, a BLUE for each genotype was estimated with
415
the final model fitted to an outlier screened data set.
416
The mixed linear model analysis of phenotypic data collected by a handheld colorimeter
417
was also identical to that used for the SSA except for fitting the following model in ASReml-R
418
version 3.0:
419
Yij = µ + genotypei + techj + (genotype×tech)ij + εij,
(Equation 5)
420
in which Yij is an individual phenotypic observation with the colorimeter; µ is the grand mean;
421
genotypei is the effect of the ith genotype; techj is the effect of the jth technician that has taken
21
The Plant Phenome Journal Accepted Paper, posted 10/16/2018. doi:10.2135/tppj2018.07.0005
422
measurements; (genotype×tech)ij is the interaction effect between the ith genotype and jth
423
technician, and εij is the residual error effect assumed to be ~iid N(0, 𝜎2𝜀 ). The model term genotypei
424
was the only fixed effect, with all other terms modeled as random effects according to ~iid N(0, 𝜎2
425
). For each trait, a BLUE for each genotype was estimated using the final model fitted to an outlier
426
screened data set, without a need for data transformations and unequal variance models.
427
We assessed the validity of phenotypic data collected by the SSA through comparisons
428
with measurements manually obtained by a digital caliper, analytical balance, and colorimeter.
429
The strength of a relationship between the same traits scored by two different methods was
430
measured with the Pearson’s correlation coefficient (rp) in R (R Core Team, 2017). Phenotypic
431
data sets with outliers removed (i.e., prior to estimation of BLUEs) were used to calculate the
432
correlation of daily single seed measurements obtained by the SSA to those collected using the
433
digital caliper and analytical balance. Given that single seed measurements based on the digital
434
caliper and analytical balance were taken independently by two different technicians, an average
435
single seed measurement value across technicians was used in pairwise comparisons with SSA
436
measurements across genotypes within each of the six days.
437
To enable the comparison of seed color measurements between the SSA and colorimeter,
438
the BLUEs for the three color traits (RGB) scored by the SSA were used to generate
439
Commission Internationale de l'Eclairage L*a*b* (CIELAB) color space values for each
440
genotype across the six days. The conversion from RGB to CIELAB color space values was
441
performed through a web interface (http://colormine.org/convert/rgb-to-lab) that implemented
442
the open source ColorMine library. Next, the resultant SSA-based CIELAB color values were
443
tested for correlation (rp) with those obtained on bulked seed samples by the colorimeter.
22
Page 22 of 64
Page 23 of 64
444
The Plant Phenome Journal Accepted Paper, posted 10/16/2018. doi:10.2135/tppj2018.07.0005
For each trait, repeatability (r) was estimated to provide a measure of technical
445
performance of the SSA relative to manual measurements for individual seeds. In the context of
446
this study, repeatability is the proportion of the variance in measurements taken by a single
447
instrument on the same seed under the same conditions that is due to permanent, or non-
448
localized, differences between oat genotypes (Falconer and Mackay, 1996, Piepho and Möhring,
449
2007). To estimate the appropriate variance components, the final fitted model (Equations 3 or 4)
450
for each trait was reformulated so that all terms were modeled as random effects. For the traits
451
measured by the SSA, variance components were then used to estimate r as follows (Holland et
452
al., 2003):
453
𝑟=
𝜎2𝑔 𝜎2𝑔 + 𝜎2𝑔𝑑 + 𝜎2𝑔𝑡 + 𝜎2𝜀
(Equation 6)
454
where 𝜎2𝑔 is the estimated genetic variance, 𝜎2𝑔𝑑 is the estimated variance associated with
455
genotype-by-day interaction, 𝜎2𝑔𝑡 is the estimated variance associated with the effect of sampling
456
tray nested within genotype, and 𝜎2𝜀 is the residual error variance. With respect to the
457
repeatability estimates for the traits measured by the digital caliper and analytical balance, the
458
equation used was as follows:
459
𝑟=
𝜎2𝑔 𝜎2𝑔 + 𝜎2𝑔𝑡𝑒𝑐ℎ + 𝜎2𝑔𝑡 + 𝜎2𝜀
(Equation 7)
460
where 𝜎2𝑔 is the estimated genetic variance, 𝜎2𝑔𝑡𝑒𝑐ℎ is the estimated variance associated with the
461
effect of genotype nested within research technician, 𝜎2𝑔𝑡 is the estimated variance associated
462
with the effect of sampling tray nested within genotype, and 𝜎2𝜀 is the residual error variance.
463
Standard errors for the repeatability estimates were approximated using the delta method
464
(Holland et al., 2003, Lynch and Walsh, 1998).
23
Page 24 of 64
The Plant Phenome Journal Accepted Paper, posted 10/16/2018. doi:10.2135/tppj2018.07.0005
465
To assess how measurement repeatability impacted the number of phenotypic
466
observations needed to be collected per seed, we calculated the gain in accuracy from a reduction
467
in phenotypic variation measured as a percentage as more measurements were obtained for an
468
individual seed. With the inclusion of repeatability estimates calculated in Equation 5, the
469
following formula was used to derive the change in phenotypic variance as the number of
470
measurements, n, was increased from 1 to 10 for each SSA trait (Falconer and Mackay, 1996):
471
𝑉𝑝(𝑛) 𝑉𝑝
=
1 + 𝑟(𝑛 ― 1) 𝑛
(Equation 8)
472
where Vp(n) is the phenotypic variance for a number of measurements, n, for a trait, Vp is the
473
overall phenotypic variance based on a single measurement, and r is the trait repeatability.
474
The number of different seeds that need to be measured per genotype by the SSA to
475
reliably estimate seed trait parameters for an oat genotype, as determined by confidence
476
intervals, was also calculated. With 10% of the trait mean as the defined amount of error, the
477
following formula was used to determine seed sample size (Ott et al., 2013):
478
𝑛=
(𝑧𝛼/2)2𝜎2 𝐸2
(Equation 9)
479
where Zα/2 is the Z value associated with either a confidence interval of 90% or 95% (α = 0.10 or
480
0.05, respectively), σ2 is the variance for the trait, and E is the amount of acceptable error in the
481
trait measurement. E was calculated as 10% of the estimated mean for each trait. To derive
482
means and variances for a trait, an iterative sampling and modeling approach was employed.
483
First, for each trait, random sampling without replacement from the outlier screened data set was
484
conducted to generate sample sizes ranging from 2 to 20 measurements (n) per genotype. Within
485
each subsampled data set, the following model was fitted to derive genotypic BLUEs for each
486
trait within the n = 2 to 20 sample sizes:
487
Yi = µ + genotypei + εi, 24
(Equation 10)
Page 25 of 64
The Plant Phenome Journal Accepted Paper, posted 10/16/2018. doi:10.2135/tppj2018.07.0005
488
in which Yi is an individual phenotypic observation; µ is the grand mean; genotypei is the fixed
489
effect of the ith genotype; and εi is the residual error effect assumed to be ~iid N(0, 𝜎2𝜀 ). The
490
derived trait BLUEs for each genotype within the individual n sample sizes were used to
491
estimate trait means and variances specific to that n-sized sample. Once all the trait means and
492
variances for the n = 2 to 20 sample sizes were calculated, an overall, across-n sample size
493
average was calculated for both the trait mean and variance. These representative values were
494
used in Equation 10 for determining the seed sample size for each trait.
495 496
Results The single-seed analyzer (SSA) and manual (digital caliper and analytical balance)
497 498
measurements of the individual oat seeds revealed highly significant (P < 0.0001) differences
499
among the five genotypes for seed weight, length, width, height, and volume (Table 1). With
500
respect to the performance of the SSA across the six days on which seeds were measured, there
501
was no effect of day on seed weight measurements, but there were significant differences among
502
the days for length, width, height, and volume (P < 0.05 to 0.0001, Table 1, Fig. 1). The
503
interaction effect of genotype-by-day was only significant for volume (P < 0.01, excluding the
504
seed color traits), indicating that the day-to-day variability did not influence the rank-order of the
505
genotypes (Supplemental Table S2). For the RGB color values extracted from the SSA collected
506
images, no significant differences among the five oat genotypes were detected, but the effect of
507
day and genotype-by-day were both highly significant (P < 0.0001) for all three color value
508
traits.
509
25
Page 26 of 64
The Plant Phenome Journal Accepted Paper, posted 10/16/2018. doi:10.2135/tppj2018.07.0005
510
Table 1. F values for fixed effects from an analysis of variance (ANOVA) for oat seed traits
511
measured using the single-seed analyzer (SSA), digital caliper, analytical balance, and
512
colorimeter. Trait Weight (g) Length (cm) Width (cm) Height (cm) Volume (cm3) Red value Green value Blue value L* a* b*
513 514 515 516 517 518
Method SSA Balance SSA Caliper SSA Caliper SSA Caliper SSA Caliper SSA SSA SSA Colorimeter Colorimeter Colorimeter
Genotype 170.800**** 61.48**** 140.900**** 57.450**** 33.860**** 94.970**** 89.450**** 31.150**** 32.470**** 59.640**** 2.258NS 2.764 NS 2.353 NS 5.668* 3.591 NS 1.715 NS
NS
Not Significant at the < 0.05 level. * Significant at the < 0.05 level. ** Significant at the < 0.01 level. *** Significant at the < 0.001 level. **** Significant at the < 0.0001 level.
26
Day 1.811 NS 2.462* 9.670**** 76.720**** 125.400**** 343.100**** 293.900**** 193.200**** -
Genotype-by-Day 0.211 NS 0.650 NS 0.799 NS 1.536 NS 1.835** 9.029**** 7.052**** 8.922**** -
Page 27 of 64
The Plant Phenome Journal Accepted Paper, posted 10/16/2018. doi:10.2135/tppj2018.07.0005
519 520
Fig. 1. Boxplots of five oat seed traits measured by the single-seed analyzer (SSA) across six
521
days.
522 523
When comparing the trait BLUEs of seed weight, length, width, height, and volume for
524
the five oat genotypes between the SSA and manual measurements (Table 2), the estimates were
525
not significantly different (two-sided t-test, P > 0.05). Additionally, the correlation (rp) of daily
526
SSA measurements to those obtained with the digital caliper and analytical balance ranged from
527
0.618 to 0.994, with an average rp of 0.886 across all days and traits (Table 3). We observed an
528
across-day, average correlation between seed weight and volume, of 0.888 for the SSA and 0.986
529
for manual measurements (Fig. 2). With the exception of weight and width, the weakest
530
correlations (rp = 0.618 to 0.900) between the SSA and manual measurements were on the fifth
531
day that seed samples were evaluated. Irrespective of this one anomalous day, estimated
27
Page 28 of 64
The Plant Phenome Journal Accepted Paper, posted 10/16/2018. doi:10.2135/tppj2018.07.0005
532
correlation coefficients were found to be consistent across days for these five traits. In contrast,
533
the three CIELAB color values determined via the SSA and colorimeter were significantly
534
different (two-sided t-test, P < 0.01) between the two methods (Table 4). However, strong
535
positive correlations (rp = 0.742 to 0.915) were observed between color values based on the two
536
measurement methods (Table 4).
537 538
Table 2. Best linear unbiased estimators (BLUEs) for oat seed traits measured using the single-
539
seed analyzer (SSA), digital caliper, and analytical balance, as well as estimates of repeatability
540
(r) on an individual seed basis with their standard error (SE). Seed Trait Weight (g) Length (cm) Width (cm) Height (cm) Volume (cm3) Red value Green value Blue value
Method SSA Balance SSA Caliper SSA Caliper SSA Caliper SSA Caliper SSA SSA SSA
Corral 0.022 0.023 0.651 0.609 0.271 0.247 0.207 0.198 0.017 0.127 137.254 110.472 69.046
Genotype Newdak Ogle 0.027 0.026 0.028 0.028 0.720 0.736 0.672 0.688 0.272 0.284 0.247 0.258 0.224 0.208 0.213 0.205 0.020 0.019 0.150 0.154 140.379 141.315 116.022 114.956 74.816 73.061
Hidalgo 0.020 0.022 0.694 0.638 0.248 0.223 0.210 0.197 0.016 0.120 133.227 107.808 69.417
541
28
SD081107 0.030 0.031 0.771 0.726 0.288 0.262 0.220 0.210 0.022 0.169 138.827 113.475 73.359
Repeatabilities Estimate SE 0.281 0.144 0.272 0.144 0.227 0.126 0.252 0.138 0.299 0.153 0.377 0.169 0.151 0.094 0.147 0.097 0.193 0.115 0.268 0.142 0.028 0.028 0.054 0.054 0.006 0.094
Page 29 of 64
The Plant Phenome Journal Accepted Paper, posted 10/16/2018. doi:10.2135/tppj2018.07.0005
542
Table 3. Pearson’s correlation coefficients (rp) generated from evaluating the linear relationship
543
of single-seed analyzer (SSA) measured oat seed traits with the same traits measured by a digital
544
caliper and analytical balance across six days. All correlations were significant at α = 0.05. Day 1 2 3 4 5 6
Weight 0.941 0.983 0.979 0.975 0.993 0.994
Length 0.965 0.974 0.964 0.964 0.900 0.977
Width 0.893 0.927 0.918 0.898 0.895 0.912
Height 0.707 0.719 0.723 0.687 0.618 0.741
Volume 0.910 0.952 0.936 0.929 0.669 0.929
545 546
547 548
Fig. 2. The relationship between seed weight and volume estimated by measurements from the
549
single-seed analyzer (SSA) (A) or digital caliper (B).
550
29
Page 30 of 64
The Plant Phenome Journal Accepted Paper, posted 10/16/2018. doi:10.2135/tppj2018.07.0005
551
Table 4. Best linear unbiased estimators (BLUEs) for oat L*a*b* color space seed traits
552
measured using the single-seed analyzer (SSA) and colorimeter, as well as Pearson’s correlation
553
coefficients (rp) from evaluating the linear relationship of these same traits between the two
554
measurement methods. All correlations were significant at α = 0.10. Color Parameter L* a* b*
Method
Corral
Hidalgo
Newdak
Ogle
SD081107
SSA Colorimeter SSA Colorimeter SSA Colorimeter
48.290 56.869 4.935 6.062 26.993 23.371
47.138 58.062 4.726 6.182 25.230 22.266
50.227 59.294 3.732 5.666 26.276 23.538
50.006 59.756 4.569 6.089 26.999 23.348
49.346 59.156 4.355 5.910 25.937 22.785
Correlation 0.742 0.915 0.857
555 556
The estimates of repeatability (r) on an individual seed basis for weight, height, length,
557
width, and volume measured by the SSA ranged from 0.151 to 0.299, whereas for manual
558
measurements repeatability estimates for an individual seed ranged from 0.147 to 0.377 for the
559
same five traits (Table 2). The repeatability estimates for these five traits were not significantly
560
different (paired t-test, P > 0.05) between the SSA and manual methods. Neither the SSA nor the
561
manual methods consistently had the highest repeatabilities. The SSA measurements exhibited
562
higher repeatability for weight and height; however, manual measurements for seed length,
563
volume, and width had higher repeatability estimates. Conversely, the RGB color values had the
564
lowest repeatability estimates (mean r of 0.029) of any measured trait (Table 2). On average, the
565
repeatabilities for the three color value traits were nearly six to seven fold lower than those
566
obtained for the other five non-color traits by the SSA (mean r of 0.230) and manual (mean r of
567
0.263) individual seed phenotyping methods.
568 569
The repeatability estimates for the SSA measured traits (Table 2) were used to calculate the gain in accuracy expected from a reduction in the phenotypic variance by multiple
30
Page 31 of 64
The Plant Phenome Journal Accepted Paper, posted 10/16/2018. doi:10.2135/tppj2018.07.0005
570
measurements on an individual seed. The gain in accuracy expected from multiple measurements
571
(n = 1 to 10) of each seed was highest for the traits with the lowest repeatabilities, and lowest for
572
traits with the highest repeatabilities (Fig. 3), congruent with expectations. Of the eight SSA
573
measured traits, the RGB color value traits would benefit the most from multiple measurements.
574
Additionally, there was an observed concomitant decrease in accuracy gains as the number of
575
measurements increased. Generally, the results suggested that two to three measurements per
576
seed by the SSA provided the best balance between gain in accuracy and resource expenditure
577
(Fig. 3), as there was only a minimal reduction in the phenotypic variance with four or more
578
measurements for an individual seed.
31
The Plant Phenome Journal Accepted Paper, posted 10/16/2018. doi:10.2135/tppj2018.07.0005
579 580
Fig. 3. Gain in accuracy from multiple phenotypic measurements of an individual seed with the
581
single-seed analyzer (SSA).
582 583
In a sampling analysis focused on the accuracy in estimation of morphological
584
parameters, we calculated the number of different seeds per genotype that needed to be measured
585
by the SSA to estimate a mean value with an assumed error rate of 10% for the more repeatable
586
non-seed color traits. The results of this analysis showed that an estimated sample size of only
587
one seed was required for seed height, width, and length, while weight and volume had estimated
588
sample sizes of seven and eight seeds, respectively, to allow for estimation of trait values such 32
Page 32 of 64
Page 33 of 64
The Plant Phenome Journal Accepted Paper, posted 10/16/2018. doi:10.2135/tppj2018.07.0005
589
that the 90% confidence interval was equal to 10% of the trait mean (Table 5). When considering
590
a confidence interval of 95%, the number of estimated seeds that needed to be measured for
591
these five traits increased by one seed for length and three seeds each for weight and volume,
592
whereas no additional seeds were required for measurement for width and height.
593 594
Table 5. Number of seeds needed for measurement by the single-seed analyzer (SSA) to estimate
595
a mean trait value with an error rate of 10% at a confidence interval (CI) of 90% and 95%. Trait Weight (g) Length (cm) Width (cm) Height (cm) Volume (cm3)
Mean 0.025 0.714 0.273 0.214 0.019
Error +/- 10% of mean 0.003 0.071 0.027 0.021 0.002
n for 90% CI 6.738 1.333 0.919 0.549 8.002
n for 95% CI 9.624 1.903 1.313 0.784 11.430
596 597
Discussion
598
The quantification of phenotypic trait variation on large numbers of genetically distinct
599
individuals continues to require a considerable investment of both time and financial resources
600
for plant breeding programs (Araus and Cairns, 2014, Furbank and Tester, 2011, Pauli et al.,
601
2016, White et al., 2012). To address this challenge, there have been significant efforts focused
602
on the development, testing, and validation of plant phenotyping systems for both greenhouse
603
and field environments (Andrade-Sanchez et al., 2014, Deery et al., 2014, Jiang et al., 2018,
604
Massimo et al., 2017). These phenotyping advancements have shifted the emphasis towards the
605
use of validated systems for comprehensively assessing plant morphological and physiological
606
traits over varying spatiotemporal scales (Fahlgren et al., 2015, Honsdorf et al., 2014, Pauli et al.,
607
2016). Often of less focus relative to agronomically and economically important phenotypes
608
evaluated under field conditions, such as grain and biomass yield, are measurement of traits on a
33
The Plant Phenome Journal Accepted Paper, posted 10/16/2018. doi:10.2135/tppj2018.07.0005
609
single seed basis (Jahnke et al., 2016). These traits, which have consistently been shown to have
610
a direct relationship with end-product quality (Melchinger et al., 2018, Montilla-Bascón et al.,
611
2017, Rolletschek et al., 2015, Spielbauer et al., 2009), would significantly benefit from having a
612
low-cost, easy to operate seed phenotyping system amenable to laboratory settings. Herein, we
613
developed and tested a novel computational image analysis pipeline combined with a SSA
614
machine that enables the accurate measurement of individual oat seed characteristics in a cost-
615
effective and high-throughput manner.
616
The SSA machine and cameras, which cost an estimated $20,000, in combination with
617
the implementation of image analysis methods based on open source software allowed for the
618
detection of significant differences in individual seed weight, length, width, height, and volume
619
parameters among the five oat genotypes evaluated. The estimates of these seed properties were
620
highly concordant with those measured manually using a handheld digital caliper. Conversely,
621
the more subtle variation in seed color across the five oat genotypes was not significantly (P