1 Formula for the Sample Linear Correlation Coefficient
Recommend Documents
data correction, labeling methods and rectal biopsy sampling in ... We show that the Intraclass Correlation Coefficient (ICC) can be used as a ... median values instead of mean values improves data correction. ... linear correlation coefficient (R ..
The tetrachoric correlation coefficient (Pearson, 1900) estimates the relationship between two dichotomous variables assuming an underlying bivariate normal.
Apr 19, 1982 - Abstract. The polyserial and point polyserial correlations are discussed as generalizations of the biserial and point biserial correlations.
Jul 3, 2012 - The famous LittlewoodâRichardson rule [16] provides a ... Jennifer Morse and Anne Schilling ... LittlewoodâRichardson coefficients cν,â,n. λµ.
Table S1: Pearson correlation coefficient (r) between each explanatory variable (NSR: number of natives species; AR: altitudinal range; BA: basin area; NPP: net ...
1 Omitted Coefficient Estimates for National Sample. Table 1 presents the full set of coefficient estimates for the OLS and the second stage 2SLS estimates.
Mendeleck are with the Mechanical Engineering Faculty, University of. Campinas, SP ... to USA high schools and Universities/Companies inside and outside the ...
coefficient can be related via a Taylor series expansion to allow inference on the coefficients in simple and multiple regression. This general method includes ...
counts by means of the intraclass correlation coefficient derived from the Poisson-Normal ... subject variance is expressed as a product of the scale parameter and the mean, whereas in the second the ... of CD34+ cells are obtained using different te
representations, the cube of the correlation coefficient, is given as the ratio of the ... The Galton-Pearson correlation coefficient is perhaps the most broadly ...
KB, JS and JK designed the study. KB and JS participated in data analysis, developed the formula and drafted the manuscript. All authors read and approved the ...
Jun 19, 2018 - statistics in current use are made, and some examples given. .... Note that the ordinary correlation coefficient p(X, Y) for two linear variables X and Y ... where g is a density on the circle with mean resultant length R. Then pT ...
Mar 30, 2011 - [9] ¨O. Egecioglu, T. Redmond, C. Ryavec, Almost Product Evaluation of ... [19] M. Petkovic, P. Rajkovic, & P. Barry, The Hankel transform of ...
Apr 3, 2013 - Correlation coefficient between gene and miRNA expression hsa-miR-132-3p hsa-miR-212. VHL. -0,875. EDG1. -0,889. ANKRD28. -0,865.
How common is the transitivity misconception? In other words, how ...... introductory courses of statistics and that it could be added to the list of common students'.
Keywords: Variable Selection; Maximum Likelihood Estimation; Spline Smoothing. 1. Introduction .... present the penalized maximum likelihood method with.
acquainted with both these tools the PPCC test provides a LaBrecque, J., Goodness-of-fit tests ... W., and T. R. G~~ledge, Jr., Use of the correlatior. coef- ... That is, a sample could be fit to a number of reason- Thomas, W.O., Jr., A uniform ...
shown that the maximum correlation coefficient between X and Y + λZ as a ... Key words. dependence, maximum correlation, self-decomposable random ...
Apr 19, 2010 - It was proved by Okounkov and Pandhari- pande [32] that the large partition asymptotics of the Hurwitz numbers recover the Witten-. Kontsevich ...
Oct 4, 2016 - phenomena such as Bose-Einstein condensates [1], wave- power hydraulics [2] ... Hindawi Publishing Corporation. Mathematical Problems in ...
Keywords: heat equation, fractional Brownian motion, Itô's formula. MSC: 60H15 ..... Thus, invoking Lemma 2.1, we obtain that, for a given α < 1/2,. Cx(s, u) ≤ c.
Apr 10, 2018 - Keywords: Thin film luminescent solar concentrator (LSC) .... AvaSpec-2048 (Avantes, UK) fiber optic spectrometer was used to re- cord the ...
to estimate the population correlation coefficient (P). In statistics, the Pearson product-moment correlation coefficient, referred as Pearson's r (proposed by Fisher.
Feb 20, 2008 - 1Department of Mechanic, Chongqing Institute of Technology, Chongqing ... Safety Research Center, Korea Atomic Energy Research Institute, ...
1 Formula for the Sample Linear Correlation Coefficient
sample linear correlation coefficient. • rXY measures the strength and direction of
linear association between two quantitative variables X and Y. Formula for the ...
The Sample Linear Correlation Coefficient
Formula for the Sample Linear Correlation Coefficient
• rXY (or just r for short) is the sample linear correlation coefficient
rXY =
i
- X )(Yi - Y ) /(n - 1)
i =1
sX sY
66 64
Sister's Height (inches)
68
Scatter Plot of the Heights of a Brother and Sister in 11 Families
62
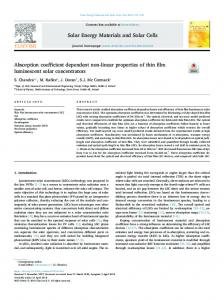
For example, consider 11 families randomly selected from the population of families with one brother and one sister, both full grown. Let Xi denote the height (in inches) of the brother in the i-th family. Let Yi denote the height (in inches) of the sister in the i-th family.
n
60
• rXY measures the strength and direction of linear association between two quantitative variables X and Y.
? (X
66
68
70
72
Brother's Height (inches)
1
25
0
0
1
0
1
-3
9
1 1
2
68
64
-1
3
66
65
-3
4
67
63
-2
-1
2
4
5
70
65
1
1
1
1
1
6
71
62
2
-2
-4
4
4
7
70
65
1
1
1
1
1
8
73
64
4
0
0
16
0
9
72
66
3
2
6
9
4
10
65
59
-4
-5
20
16
25
66
62
-3
-2
6
9
4
759
704
0
0
39
74
66
11
X = 759 / 11 = 69
∑i =1 n
rXY =
Y = 704 / 11 = 64
( X i − X ) (Yi −Y ) /(n − 1) s X sY
=
SX =
74 11 −1
SY =
Scatter Plot of the Heights of a Brother and Sister in 11 Families
r=0.558 68
(Yi − Y )2
4
5
66
(Xi − X)2
10
2
64
( X i − X ) (Yi −Y )
Xi − X Yi − Y
69
Sister's Height (inches)
Yi
71
62
Xi
60
i 1
66 11 − 1
3. 9 ≈ 0 .558 (7 .4 ) (6 .6 )
66
68
70
72
Brother's Height (inches)
Is a Bear's Neck Circumference Correlated with a Bear's Weight?
400 300
Weight in Pounds
200 100
• rXY estimates the population linear correlation coefficient ?XY . • rXY is dimensionless and is always between 1 and -1. • rXY =1 if and only if all data points fall perfectly on a line with positive slope. • rXY =-1 if and only if all data points fall perfectly on a line with negative slope. • rXY =0 suggests that there is no linear association between X and Y.
500
Some Properties of rXY
10
15
20
25
30
Neck Circumference in Inches
2
Is Outside Temperature Associated with Crawling Time? Nov
Oct
32
Dec Apr
31
Jun
Feb Jan
30
Average Crawling Age in Weeks
400 300 200
Aug
Mar
29
100
Weight in Pounds
Sep Jul
r=0.934 33
500
34
Is a Bear's Neck Circumference Correlated with a Bear's Weight?
May
10
15
20
25
30
30
40
Neck Circumference in Inches
Sep
70 Apr
31
Jun
Feb Mar
China Russia Iraq Morocco
Vietnam S.Africa
Egypt Pakistan Haiti Uganda
Madagascar
50
30
Jan
Life Expectancy in Years
32
Dec
60
33
Aug
Yemen
Cambodia Angola
May
30
40
50
70
Japan France Canada,Australia UK US Mexico Sri Lanka
29
Average Crawling Age in Weeks
r=-0.699
Nov
Oct
60
Does Watching TV Increase Life Expectancy? 80
34
Is Outside Temperature Associated with Crawling Time? Jul
50
Average Monthly Temperature (F) in First 6 Months
60
Average Monthly Temperature (F) in First 6 Months
70
0
50
100
150
200
People Per Television
3
Guess the correlation for each pair of variables. Japan France Canada,Australia UK US Mexico Sri Lanka