Dept. of Computer Engineering and Computer Science. University of Louisville. Recently, online organizations became inte
MINING AND TRACKING EVOLVING WEB USER TRENDS FROM LARGE WEB SERVER LOGS Basheer Hawwash and Olfa Nasraoui
Knowledge Discovery and Web Mining Lab
Dept. of Computer Engineering and Computer Science
University of Louisville
Recently, online organizations became interested in tracking users' behavior on their websites to better understand and satisfy their needs. In response to this need, Web Usage Mining tools were developed to help them use web logs to discover usage patterns or pro�les. However, since website usage logs are being continuously generated, in some cases, amounting to a dynamic data stream, most existing tools are still not able to handle their changing nature or growing size. This paper proposes a scalable framework that is capable of tracking the changing nature of user behavior on a website, and represent it in a set of evolving usage pro�les. These pro�les can o�er the best usage representation of user activity at any given time, and they can be used as an input to higher-level applications such as a Web recommendation system. Our speci�c aim is to make the Hierarchical Unsupervised Niche Clustering (HUNC) algorithm more scalable, and to add integrated pro�le tracking and cluster-based validation to it. Our experiments on real web log data con�rm the validity of our approach for large data sets that previously could not be handled in one shot.
1. Introduction Organizations that provide online services, ranging from e-commerce transactions to document and multimedia browsing repositories, are in a continuous competition with each other to keep their existing customers and to lure new ones.
1
Furthermore, this competition is
increasing because of the relative ease of starting an online business and the fact that a competitor's website is often just one or two clicks away. The challenging nature of the online market has motivated online companies to start monitoring their online usage activity data to better understand and satisfy their website users. However, tremendous amounts of online clickstreams take place every day, making the data logged from them so large that trying to use conventional analysis methods is neither possible nor cost-e�ective. As a result, it has become imperative to use automated and e�ective data mining methods to turn this raw data into knowledge that can help online organizations to better understand their users. Web Usage Mining is the process of applying data mining techniques on web log data to analyze the prevalent online activity patterns and extract from them user pro�les (e.g. a set of usage clusters and the URLs that are relevant to each cluster). These pro�les can then be used in higher-level applications such as recommendation or personalization services. There has been a considerable amount of research in web usage mining [1, 3, 4, 6, 14, 15, 18, 20]. However, there has been very few detailed studies that address the scalability and evolution concerns given the large streams of clickstream data and its evolving nature. This paper proposes a new framework that can handle the changing behavior of the users of a website by continuously discovering, maintaining, and furthermore validating an unknown number of clusters and their corresponding usage patterns/pro�les over time. Our speci�c aim is to make the Hierarchical Unsupervised Niche Clustering (HUNC) algorithm more scalable, and to add integrated pro�le tracking and cluster-based validation to it. In this framework, web usage mining is performed on a regular basis to discover new user pro�les, and at each new time period, the recent user clickstreams or sessions are compared against the previous period's pro�les, then these pro�les are incrementally updated taking into account their similarity to the new clickstreams. Each time that a new session matches an existing pro�le, it is used to update it, then the new session is discarded, thus greatly reducing the amount of new data to be mined in the new period. The remaining reduced data consisting of only new sessions, that do not match any existing pro�le, are then used
2
to discover new pro�les to be added to the existing updated pro�les. This approach results in a scalable pro�le discovery that furthermore adapts with the current usage trends. The contributions of this paper can be summarized as follows: (i) enhancing the scalability of pro�le discovery, (ii) tracking the evolution of the discovered pro�les over time by updating an archive of pro�les on an on-going basis, (iii) generating user-friendly pro�les that can be used in higher-level applications, (iv) evaluating the quality of the proposed pro�le discovery.
2. Related Work
2.1 Overview of Web Usage Mining Web Usage Mining is the process of applying data mining techniques to extract useful knowledge such as typical usage patterns from web log data. The analysis of the discovered usage patterns can help online organizations gain a variety of business bene�ts, such as developing cross-product marketing strategies, enhancing promotional campaigns, and web personalization. Early research has been conducted in Web Usage Mining [1, 2, 4, 5, 14, 15, 25, 26] to address the challenges of pre-processing, usage data analysis and modeling, and data mining which ranged from clustering to association and sequential rule mining. Several tools have
Pattern
thus been developed [1, 3, 15, 18, 20] to infer usage patterns from web usage data (
Discovery)
Pattern Analysis ).
and then to interpret these usage patterns (
2.2 Web Usage Mining process Typically, discovering the Web usage patterns, such as pro�les or prediction models, consists of three steps: preprocessing the raw usage data, discovering patterns from the pre-processed data, and analyzing these discovered patterns.
3
There are two primary tasks in preprocessing:
tion
also known as
sessionization.
data cleaning,
and
transaction identi�ca-
Data cleaning eliminates irrelevant items such as image
requests and search engine requests from the server log. The transaction identi�cation process groups the sequences of page requests into logical units, each of which is called a
session
which is the set of pages that are visited by a single user within a prede�ned period of time. After pre-processing, the Web sessions are used as an input to patten discovery methods that are typically rooted in areas such as data mining, arti�cial intelligence, or statistics. These discovery methods may include:
Path Analysis Clustering
[20, 23, 25, 26]
Statistical Analysis, Sequential Pattern mining
, Association Rule Mining
[19, 24],
Classi�cation [22],
[21]
,
and
[2, 5, 6].
After discovery, the usage patterns are analyzed to better understand and interpret them, using a variety of analysis tools from the �elds of statistics, graphics, visualization, or database querying. Examples of analysis tools can be found in [18, 19, 26].
2.3 The Hierarchical Unsupervised Niche Clustering algorithm (HUNC) HUNC is a hierarchical version of the Unsupervised Niche Clustering (UNC) algorithm. UNC is an evolutionary approach to clustering proposed by Nasraoui and Krishnapuram in [14], that uses a Genetic Algorithm (GA) [16] to evolve a population of cluster prototypes through generations of competition and reproduction.
UNC has proven to be robust to
noise, but was formulated based on an Euclidean metric space representation of the data. Later, the HUNC (Hierarchical Unsupervised Niche Clustering) algorithm [6] was proposed to generate a hierarchy of clusters which gives more insight into the Web Mining process, and makes it more e�cient in terms of speed. HUNC does not assume the number of clusters in advance, can provide pro�les to match any desired level of detail, and requires no analytical derivation of the prototypes. This allows HUNC to use specialized similarity measures based only on the user access patterns. HUNC algorithm is shown in Algorithm 1.
4
Algorithm 1
HUNC
Input: xj : user sessions, Nmin : minimum allowed cluster cardinality , σsplit : minimum allowed cluster scale Output: pi : User profiles (sets of URLs, later referred to as raw profiles) χi : Clusters of user sessions closest to profile i 1: Encode binary session vectors xj 2: Set current resolution Level L = 1 3: Apply UNC (one level clustering) to entire data set with small population size (this results in cluster representatives pi and corresponding scales σi ) 4: repeat until : cluster cardinality Ni < Nmin or scale σi < σsplit 5: Increment resolution level: L = L + 1 6: For each parent cluster pi found at Level (L − 1) 7: if cluster cardinality Ni > Nmin or cluster scale σi > σsplit then 8: Reapply UNC only on data records xj that are closest to this parent cluster pi based on distance measure (this results in cluster representatives pi and corresponding scales σi ) Algorithm: Unsupervised Niche Clustering (UNC) Input: xj : data records, in this case user sessions, Np : population size, G: Number of generations Output: Cluster representatives: a set of profiles pi and scales σi 1: Randomly select from xj an initial population of Np candidate representatives pi maxi,j dij 2: Set initial scales σi = 10 3: repeat for G generations 4: Update the distance dij of each data record xj relative to each candidate cluster representative using distance 5: Update the robust weight wij = e−dij /(2σi ) of each data record xj relative to each candidate cluster representative pi P j wij dij P 6: Update the scale σi = for each candidate cluster representative j wij (derived by setting fitness Pgradient: ∂fi /∂σi = 0 while wij are fixed)
7: 8: 9: 10: 11: 12: 13:
wij
Update density fitness fi = jσi of each cluster representative pi for i = 1 to Np /2 do Select randomly from population candidate parent pi without replacement Select randomly from population another candidate parent pk without replacement Obtain children c1 and c2 by performing crossover and mutation between the chromosome strings of pi and pk Update the scale σi and the fitness fi of each child Apply Deterministic Crowding to fill new population: Assign each child ci to closest parent if child's fitness > closest parent's fitness then child replaces closest parent in the new population else closest parent remains in the new population 5
2.4 Mining evolving pro�les Most research in web mining has focused primarily on data collected during
time frame.
a particular
However, because of the dynamic nature of the Web, researchers have recently
paid more attention to mining evolving Web user pro�les that vary with time. For example, [7] proposed a stream clustering methodology that was inspired by the natural immune system's ability to adapt to a dynamic environment, while [8] studied the evolving nature of the web, where the Web was represented as a directed graph. Earlier work in learning with concept drift is also related to mining evolving patterns. This includes the work in [13] which addressed the issue of learning evolving concepts, which are concepts that gradually change over time, as well as [11] which presented a method for gradual forgetting, that assigned a weight to each training example according to its appearance over time.
More recently,
[12] proposed a framework, based on the HUNC clustering algorithm, to discover pro�les using HUNC, then track how the discovered pro�les evolve over consecutive time periods, and further categorize this evolution based on several prede�ned categories of evolution such as emergence or birth, death, persistence, or atavism. The main distinction of this paper, compared to the work in [12] is that whereas [12] did not handle the scalability concerns, this paper directly addresses the computational cost by eliminating a large proportion of a weblog from further analysis during the pre-processing stage. Also unlike [12] which consisted of decoupled mining and evolution tracking processes, the method presented in this paper tightly integrates the evolution tracking with the actual cluster mining, and thus leverages the former to enhance the scalability of the latter.
Another main distinction is in the
validation procedure that we use in this paper, which is cluster-based, and thus directly assesses the validity of the discovered clusters in such familiar cluster validity terms as the cluster density, compactness, and separation between clusters. To take this validation further, we also tracked these validity criteria over time to visualize how cluster quality evolves over time. Consequently, whereas in [12], we only characterized the type of evolution qualitatively, here we track objective metrics that related to the clusters or pro�les with time,
6
leading to a powerful quantitative temporal evaluation that can make it easier to support further decision making processes down the stream. For example, the quantitative metrics can form new features that can be used in further decision making.
3. Methodology Most existing web usage mining algorithms have failed to address the notion of change and large data sets. Even the few approaches that tried to capture and handle the changing nature of the web, were concerned with understanding the changes in the users' access patterns over a period of time [12], but failed to utilize this change directly in order to maintain and develop the evolving pro�les.
On the other hand, the approach proposed
in this paper discovers the usage patterns over di�erent periods of time, and furthermore captures the changes undergone by the patterns in order to update them accordingly.
3.1 Overview of the Proposed Methodology The web usage mining process is traditionally done in several steps with only a few variations.
It starts with preprocessing the log �les, discovering the usage patterns using
a web usage mining algorithm, and then interpreting the discovered patterns. These steps have been used to discover usage patterns, predominately, within one speci�c period of time, but they can arguably be reapplied periodically, over several periods, to capture the changes in navigation patterns. However, there are some concerns using this approach, as explained below.
•
Reapplying the steps periodically can either be performed on the entire historic data, or on the new log �les only. The former approach reduces the probability of discovering new trends because of their small weight compared to older trends, while the latter approach completely forgets all previous patterns which may not be reasonable or e�cient, since some of these patterns might still be signi�cant in the new period, and would have to be rediscovered again.
7
•
Trying to always discover the new behaviors from all the accumulated log �les up to the current period will require signi�cant computational resources, which de�es the scalability requirement.
•
All the above approaches do not capture the changes in the usage behaviors in detail, i.e. we do not know which URLs have changed or have become more interesting from one period to another.
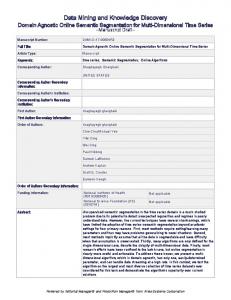
The proposed framework, depicted in Figure 1, overcomes the above issues and can be summarized as follows, assuming that we start with a set of initial (
previous
or
seed ) pro�les
mined from an initial period:
1.
Preprocess the new web log data to extract the current user sessions,
2.
Update the previous pro�les using the extracted user sessions,
3.
Re-apply clustering to the distinct user sessions only (i.e. the ones not used in step 2 to update the previous pro�les),
4.
Post-process the distinct (new) pro�les mined in step 3,
5.
Combine the updated pro�les with the distinct pro�les to create the new seed pro�les for future periods,
6.
Interpret and evaluate the discovered pro�les
7.
Go to step 1 as data from a new period becomes ready
8
Figure 1: Proposed Pattern Discovery Process Flowchart Initial Mining 1
Seed Web Log
2
3
HUNC Mining
Post-process
Seed Sessions
Preprocess
HUNC Clusters
Seed Profiles
Seed URL Map
Mining at T1 2
1
Update Profiles
New Sessions (at T1) New Web Logs (at T1)
New Updated Profiles (at T1)
Preprocess New URL Map (at T1)
New Distinct Sessions (at T1) 3 5 HUNC Mining New Distinct Profiles (at T1)
4
Combine Profiles
Post-process
New HUNC Clusters (at T1)
New Seed Profiles(at T1)
Mining at T2 2
1
Update Profiles
New Sessions (at T2) New Web Logs (at T2)
New Updated Profiles (at T2)
Preprocess New URL Map (at T2)
New Distinct Sessions (at T2) 3 5 HUNC Mining New Distinct Profiles (at T2)
4
New HUNC Clusters (at T2)
Combine Profiles
Post-process New Seed Profiles(at T2)
3.2 Preprocessing the logs The �rst step in pre-processing is data cleaning where all irrelevant elements such as images, requests from crawling agents, and unsuccessful requests are removed. The next step in preprocessing is sessionization, where consecutive page requests with the same originating IP address, session, or cookie ID, are grouped into units called sessions. Each session represents all the pages visited by a particular user within a prede�ned period of time. The session is encoded as an
Nu -dimensional
binary vector
9
sj
ith
with the following property:
user
(i)
sj =
where
j
1
if user accessed URL j during session i
0
otherwise
is a unique number in
1, .., Nu
and
Nu
is the total number of valid URLs.
3.3 Updating pro�les After pre-processing, the sessions are categorized into sessions.
matching
sessions and
distinct
The new matching sessions, that match any of the old pro�les, will be used to
update these pro�les, the
old pro�les
are the accumulation of the evolving pro�les discovered
and updated with arriving data, up to the previous period. The
distinct sessions
are the
remaining sessions extracted during preprocessing, and that were not found to be �similar" enough to any old pro�le. Only these distinct sessions, that do not match any pro�le, will undergo the next step of discovering the new pro�les/trends. A pro�le
Pi
Xi ,
is a vector representation of the cluster
which is a set of user sessions
that are more similar to each other than to the sessions in other clusters. represented as
Pi = (Pi1 , .., PiNu )t
where
Pij
is the relevance weight of
is estimated by the conditional probability of accessing to
ith
cluster
Xi ,
U RLj
The pro�le is
in cluster i, and
U RLj
during the sessions assigned
|Xij | |Xi |
(1)
i.e.,
(k)
(k)
Pij = p(sj = 1|sj ∈ Xi ) =
(k)
Xij = {s(k) ∈ Xi |sj > 0} Xij
represents the set of sessions in cluster
the number of sessions in cluster A pro�le
Pi
has a cardinality,
cluster prototype of
Xi ,
i.e.
(2)
Xi , that accessed the j th
Xi . |Xij | will be denoted as Nij Ni ,
URL,
U RLj , and |Xi | is
in the following discussion.
which is the number of sessions that are closest to the
Ni = |Xi |.
Moreover, the pro�le
that determines to what extent the sessions in cluster
10
Xi
Pi
has a scale measure
σi2
are dispersed around its cluster
representative.
The scale measure is a cluster parameter in HUNC which is derived to
optimize HUNC's density criterion as follows
PN σi2
where
Xi ,
wij
j=1
= PN
j=1 wij
,
(3)
is a robust typicality weight that measures how typical a session
xj
is in cluster
and serves to distinguish outliers. It is given by
wij = e
d2ij
wij d2ij
is the distance between session
scale measure
σi2
xj
−
d2 ij 2σ 2 i
.
(4)
and the prototype of cluster
wij ,
as given by (6). The
can be considered as a radius of the cluster or pro�le, and the more similar
the input sessions are to the cluster prototype, the smaller weight
Xi ,
σi2 .
Moreover, based on the robust
it is possible to detect outliers which will have smaller weights.
In order to match new sessions with old pro�les, we compute the similarity between a session
S
and a pro�le
P
using the Cosine Similarity between two sets as follows:
|P ∩ S| Simcos (P, S) = p |P | · |S| Where
|P |
is the number of URLs in pro�le
P,
and
|S|
(5)
is the number of URLs in session
S.
The similarity is then mapped to the dissimilarity:
d2 = (1 − Simcos (P, S))2 .
(6)
Another way to match a new session to an old pro�le is by computing the session's robust weight relative to the pro�le, de�ned in (4), and comparing it to a threshold value; this matching will be referred to as
Robust Weight Similarity.
The advantage of using
the robust weight is that the weights are normalized by the scale of each cluster; hence,
11
they are less sensitive to the threshold, and they also depend on the pro�le's dispersion or compactness.
Thus, pro�les with smaller scales will be more strict in matching, and vice
versa for large-scale pro�les. One important issue when assessing the similarity between a pro�le and a session is to consider only
signi�cant
common URLs, i.e., URLs whose weight exceeds a threshold value,
when computing the cosine similarity.
Thresholding URLs is an additional precaution to
�lter out the e�ect of potential outliers that might contaminate a pro�le. However, if the threshold is too strict, then this might cause discarding important updates to pro�les, while still in their infancy stages (thus their URL weights are still low).
Hence, choosing the
optimal threshold value is vital, and is an important parameter to study. In addition to the above parameters, we record the starting and ending times for each pro�le. The former is the time stamp of the �rst session that gave rise to the pro�le, while the latter is the time stamp of the most recent session that was used to update the pro�le. Finally, after de�ning all the needed quantities, we can summarize the pro�le updating in Algorithm 2.
12
Algorithm 2
Update_Pro�les
Input: The set of all new sessions Sa , The (old) seed profiles and their parameters P (Nij , Ni , σi2 ) Output: The set of distinct sessions Sd , The updated profiles Pu 1 Update Profiles (Sa , P ) 2 { 3 For each session S in Sa 4 { 5 Compute Sim(S, Pi ) for all current profiles Pi 6 Find profile Pk that is closest to S 7 If Sim(S, Pk ) > Simmin then 8 UpdateProfile(Pk , S) 9 Else 10 Add S to Sd 11 } 12 } 13 14 15 16 17 18 19 20 21 22 23 24 25 26 27
UpdateProfile (Pi , S) { For each U RLj in Pi { If U RLj in present in Session S then N +1 Pij = Niji +1 Else Nij Pij = Ni +1 } For each U RLk in S but not in Pi { Add U RLj to Pi Pij = Ni1+1 } Compute d2new = (1 − Sim(Pi , S))2
28 29 30 31
Update profile scale: σi2new = ioldNi +1 Ni = Ni + 1 Update the End-Date of Pi to the last date of last access in Sa }
σ2
Ni +d2new
The algorithm starts by �nding the closest matching pro�le to each session, and then uses the matching session to update that pro�le. If the session does not match any pro�le, i.e., its similarity with all pro�les is not greater than the threshold a
distinct
Simmin , then it is classi�ed as
session. In this algorithm, a crisp membership is used, i.e., only the closest pro�le
13
is updated, as opposed to updating all pro�les close to the session (which would be a fuzzy membership). It can be argued, intuitively, that a crisp or hard membership should yield higher precision at the cost of lower coverage, which, from a business perspective, means that each user is mapped to exactly one detailed pro�le, instead of many. Updating the closest matching pro�le is done by incrementing its cardinality by one, increasing the weight of common URLs, adding new URLs (that are in the session but not in the pro�le), updating the weight for the remaining URLs and updating the pro�le's starting and ending dates.
Finally, the scale of the pro�le is updated by adding the e�ect of the
2 new session's distance (dnew ). The weight of each new session is considered to be 1 (unlike the variance de�nition in (3)), since we are already restricting only very similar sessions to update a matching (and furthermore, the closest) pro�le. The complexity of Algorithm 2 can be shown to be
O(Ns ∗ |P | ∗ M ax(|U RL|P , |U RL|S ))
where
Ns
is the number of new sessions,
maximum number of URLs in a pro�le, and
|P |
(7)
is the number of pro�les,
|U RL|S
|U RL|P
is the
is the maximum number of URLs per
sessions. Furthermore, we exploit the fact that Web sessions are extremely sparse (typically fewer than 10 URLs per session), when comparing sessions and pro�les as sets.
This is
reduced even further when applying a threshold on the URL signi�cance weight. Moreover, the number of pro�les tends to be small because only strong pro�les are mined at any period. Thus, the number of new sessions is what really a�ects the complexity of the updating algorithm the most, albeit still linearly.
3.4 Discovering distinct pro�les After the old pro�les have been updated, only distinct sessions will undergo the pattern discovery process.
The HUNC algorithm described in Section 2.3 is used to discover the
new patterns, and the output will be denoted as the
14
new pro�les.
These new trends may
represent a potential new interesting market niche, or a radical change in the current market needs and behavior.
The output of the pattern discovery process is a set of new clusters
that are represented as a set of URLs. Each cluster has a variance measure measure
Ni ,
sum of weights, and a density or �tness.
σi2 ,
cardinality
The variance is de�ned in (3), the
t
cardinality is the number of sessions assigned/closest to this cluster up to period ( ) and is donated as
Ni .
The Density
fi
of Pro�le
i
is de�ned as:
PNi fi =
j=1 wij . σi2
(8)
Since the distinct sessions are only part of the original sessions, HUNC's run time and resource usage are reduced, which increases the scalability of this approach.
3.5 Post-processing the distinct pro�les The purpose of post-processing is to formulate the discovered patterns in a way that is more understandable by Humans, and usable by higher-level applications.
The post-
processing phase is applied only on the newly discovered clusters. During the post-processing phase, each URL is mapped to the closest cluster. The set of all URLs in the same cluster constitutes a pro�le. A relevance weight is calculated for each URL as in (4), and the pro�le variance and cardinality are calculated as well - which are the same as in the cluster.
A
sample pro�le is shown in Figure 2. This pro�le has 11 signi�cant URLs with their weight shown on the left next to each URL. It represents 58 sessions in the period 1/30/98 until 2/4/98, and its variance is low which means that the URLs are very close to each other.
15
Figure 2: Sample Pro�le
Profile: 9, Num.URLS: 11, Cardinality: 58 StartDate: 30/Jan/1998:17:30:33 , End Date: {0.98 - /courses.html} {0.98 - /courses100.html} {0.96 - /courses_index.html} {0.82 - /} {0.74 - /cecs_computer.class} {0.34 - /courses300.html} {0.20 - /courses200.html} {0.17 - /courses_webpg.html} {0.12 - /~joshi/courses/cecs352} {0.10 - /courses400.html} {0.10 - /people.html}
04/Feb/1998:13:37:34 , Variance:
0.0857
3.6 Combining pro�les In this phase, the updated pro�les and the newly discovered pro�les are combined into one set of pro�les that will serve as the new seed of pro�les for the next pattern discovery period. Moreover, statistics about the pattern discovery process are collected, such as the number of updated pro�les, the number of newly discovered pro�les, and the number of distinct sessions. These statistics help in monitoring the performance of the discovery process, and in analyzing the output. For example, they can answer questions such as: �
During which period did the browsing behavior change the most? �
�
Did changing the content of the website in period T change the users' behavior? �
3.7 Interpreting the pro�les Once the browsing behavior of users is summarized in the form of pro�les, these pro�les could serve as an input to higher-level tools that can analyze the usage patterns and make conclusions that help in a further decision making process. The analysis tools can draw on statistics, graphics, visualization or database querying.
The information presented in the
pro�les could also be used directly in higher level applications (e.g.
the list of URLs to
implement collaborative �ltering recommendations), or to evaluate the pro�les quality (e.g. the pro�le scale or variance). There are also other metrics that are gathered for each pattern
16
discovery cycle, and used for a higher level analysis of the pro�le evolution and interaction, e.g. number of distinct sessions per period. These will be presented in Section 4.
4. Experiments The proposed framework was applied on two real web site logs: a smaller log from the University of Missouri's CECS department's web site, and a much larger log from University of Louisville's library website (library.louisville.edu).
For each web site, a set of evolving
usage pro�les were extracted, and their quality was evaluated using a set of metrics. This section starts by de�ning these evaluation metrics in Section 4.1, then discusses the di�erent parameters that will be used and their con�gurations in Section 4.2. Experiments on both datasets showed similar results but due to paucity of space, only the results for the bigger data set, University of Louisville Library, will be discussed in Section 4.3. Finally, a summary of the experiments and the optimal con�guration is presented in Section 4.4.
4.1 Evaluation Metrics The pro�les that result from the pattern discovery process can be evaluated manually, by visiting the URLs and trying to determine whether these links are related.
However
this evaluation method can be subjective, time consuming, or even outdated since URLs are dynamically changing. Moreover, it is not enough that the pro�le �descriptions� are plausible; the pro�les should form good �clusters�, i.e. they should be compact and separated. Thus, a more reliable and accurate method is to use a set of
objective
evaluation metrics to assess
the quality of pro�les. Table 1 lists the evaluation metrics, and their desired and expected ranges, where
Ns
is the total size of the data. These metrics will be described in the next
sections in detail. Table 2 lists the evaluation metrics and a short describtion that re�ects their behavior in the context of web usage mining.
17
Table 1: Evaluation Metrics Summary
Evaluation Metric
Notation
Pro�le Variance
σi2
Low
[0-1]
Pro�le Cardinality
Ni
High
[1-Ns ]
Matching Sessions
-
High
[1-Ns ]
Pro�les Count
-
High
[1-Ns ]
Pro�le Pair-wise Similarity
Simcos (Pi , Pj ) Di
Low
[0-1]
High
[1-∞]
Pro�le Density
Desired Value Range
Table 2: Metrics Quality Description
Evaluation Metric Description Pro�le Variance
Low variance re�ects high similarity in users' behavior
Pro�le Cardinality
High cardinality means that this behavior is shared by many users
Matching Sessions
High value re�ects similar users' behavior at consecutive time intervals
Pro�les Count Pair-wise Similarity Pro�le Density
High value re�ects diversity in users' behavior represented by di�erent patterns Low similarity emphasizes di�erences in the users' behaviors High density means high similairty in behaviors of many users
4.1.1 Pro�le Variance The pro�le variance or scale (σ ) was de�ned in (3), and re�ects how much the sessions in that cluster are dispersed. The pro�le variance is normalized in the range [0-1], and its value approaches 1 as the sessions in the corresponding cluster get further from the cluster prototype, and thus further from each other (i.e. a lower pro�le variance is desirable.
are less similar to each other).
Hence,
The pro�le variance is proportionally related to the
dissimilarity (di�erence) between the session and a pro�le. As the dissimilarity increases, the variance will increase. The dissimilarity was de�ned in (6). In fact, the cosine similarity can be reformulated using the pro�le variance as
SimCos = 1 −
√
σ
(9)
4.1.2 Pro�le Cardinality The pro�le cardinality is the number of sessions assigned to the corresponding cluster. A
18
higher cardinality means that this pro�le is more popular and interesting. However, a higher cardinality pro�le might also be a result of the �default� cluster that captures all the �noise� in the data, which are sessions that are too di�erent to form any strong and consistent usage patterns. When the pro�le gets updated, its cardinality is increased. Hence, the cardinality of a pro�le at any given time is the sum of the number of sessions that the pro�le has acquired up to and including that time period. The cardinality
Ni
of a pro�le
Pi
at time period
t can
be written as follows
Nit =
t X
nji ,
(10)
j=1 where
nji
is the number of sessions identi�ed to be closest to the pro�le
i
j
at time . Further-
more, for evaluation purposes, the accumulated cardinality is normalized by the sum of all pro�le cardinalities up to time period
t,
as follows
Nt (Nit )norm = P|P | i
t j=1 Nj
where
|P |
,
(11)
is the total number of pro�les.
4.1.3 Matching vs. distinct sessions The
matching
sessions refer to the sessions that matched an existing pro�le and are thus
used to update the properties of that pro�le, while the
distinct
sessions are the ones that are
not close enough to any of the existing pro�les, and therefore they are used to extract new pro�les in a new period. A high matching session percentage indicates high quality pro�les (that have been discovered up to the previous period), and furthermore reduces the cost of pattern discovery, since fewer (distinct) sessions would have to undergo the mining process.
4.1.4 Number of pro�les Tracking the numbers of pro�les discovered and updated at each cycle of the mining
19
process can give an insight about which time periods have witnessed changes in usage behavior, and what were the trends. Each pro�le at each cycle can be categorized as (created from the distinct sessions),
Updated
Static
Discovered
(was not updated by any matching sessions),
or
(by matching sessions).
4.1.5 Pro�le Pair-wise Similarity The Binary Cosine Dissimilarity de�ned in (6) will be used for creating a pro�le-topro�le dissimilarity matrix. The value of 0.01 will be used as the threshold value, i.e., if the di�erence between two pro�les is less than 0.01 then the pro�les will be considered
similar.
The value of 0.01 in the di�erence means a similarity of 0.9 between pro�les as given in (5). A large number of similar pro�les indicates a poor clustering result.
4.1.6 Pro�le Density Pro�le density was de�ned in Section 3.4 as the sum of session weights divided by the pro�le variance. The weight of each session is now considered to be 1, since we are already
t restricting only very similar sessions to update the pro�le. Hence, the pro�le density (Di ) at time period
t
can be de�ned as follows
Dit = where
Nit
Nit , σi2
(12)
is the pro�le cardinality up to time period t. The pro�le quality generally increases
as its variance decreases as discussed in Section 4.1.1, and a higher cardinality is also desirable as discussed in Section 4.1.2. Hence, a high density is desirable and indicates a high quality pro�le with high compactness (low variance) and more importance (high cardinality).
20
4.2 Experimental Con�guration The pattern discovery process depends on a number of options and parameters that a�ect the usage pro�les and their quality. Varying the number and values of these parameters would help in determining the best con�guration to be used, and help point out the weaknesses and strengths of the proposed framework. The con�guration options and parameters include:
1. Method of discovery:
evolution
(the method used in this paper) or
traditional
(Full)
where pro�les are discovered from all historic logs at once.
2. Method of matching pro�les:
ilarity
Binary Cosine Similarity
Eq.(5) or
Robust Weight Sim-
Eq.(4).
3. Similarity threshold: used as cut o� value to determine how similar a session is to a pro�le (i.e. if
Sim(Sj , Pi ) > Simmin
then update
Pi ).
4. URL weight threshold: used as cut o� value in two phases of the discovery process: the post-processing phase in HUNC discussed in Section 3.5 to make sure that only URLs that are signi�cant enough in the cluster are selected in the �nal pro�les, and in the pro�le updating algorithm (Algorithm 2) where only signi�cant URLs in the pro�le are compared to the current sessions.
These parameters and their di�erent values are listed in Table 3. For the URL signi�cance weight threshold, the term old, the term term
URL_TH will be used, for the Binary Cosine Similarity thresh-
CosSim_TH
is used, and for the Robust Weight Similarity threshold, the
RobWT_TH is used.
The HUNC algorithm is used to discover the pro�les from distinct sessions. Table 4 shows all the HUNC parameters and their values. Changing the values of these parameters might a�ect the resulting pro�les quality.
But they were chosen based on previous experiments
on many website logs. Since this paper aims to study the changing usage behavior over the
21
Table 3: Experimental Con�guration
Method Matching Criteria URL_TH CosSim_TH RobWT_TH Evolution
Binary
Robust
FULL
-
0.04
0.3
-
0.04
0.5
-
0.1
0.3
-
0.1
0.5
-
0.04
-
0.3
0.04
-
0.6
0.1
-
0.3
0.1
-
0.6
-
-
-
web, and not the performance of HUNC, these parameter values will be the default values for all experiments. Table 4: HUNC Parameters
Parameter
De�nition
Value
Min Cardinality
The smallest allowable size of an individual
20
Min Cardinality Split
If cardinality of individual is less than this, it will not be split
30
Variance Threshold Split
If Individual threshold is less than this, it will not be split
0.1
Variance Factor
Factor of variance used as threshold for within niche distance
0.5
Min Fitness Cross
Threshold for identifying valid individuals when restricting mating of good individuals from di�erent niches
1000
Max Levels
Maximum number of levels of hierarchical clustering
8
Population Size
The initial population size used in genetic algorithm
20
CrossOver Probability
The probability of performing crossover
0.9
Mutation Probability
The probability of parts of chromosome of being mutated
0.000005
4.3 University of Louisville Library 4.3.1 The Dataset The logs were collected for requests done to the University of Louisville's Library main website (library.Louisville.edu) for �ve consecutive days: from Wednesday February 27th, 2008 until Sunday March 2nd, 2008. There were a total of 364,409 requests, grouped into 14,888 sessions. The pro�le evolution tracking was done on a daily basis, so there were �ve time periods, with the data properties shown in Table 5.
22
Table 5: U of L Library: Dataset Properties
Period Date Access Requests Count Sessions Count Percentage of Total Data Wed, Feb 27th, 2008 104,794 4,196 28.76% Thu, Feb 28th, 2008 92,446 3,657 24.65% Fri, Feb 29th, 2008 70,722 2,919 19.41% Sat, Mar 1st, 2008 40,834 1,791 11.2% Sun, Mar 2nd, 2008 55,613 2,325 15.26% In the �ve time periods, around 85% of the requests were �bad access" requests, i.e. irrelevant and noise requests. This observations shows the importance of the preprocessing phase, because all these bad requests would have adversely a�ected the resulting pro�les discovery.
4.3.2 Pro�le Variances The pro�les evolution over time is shown in Figures 3, 4, 5, and 6. Since the number of pro�les is large for some con�gurations (about 50), only the highest cardinality pro�les are shown because their behavior is more reliable.
Fig.
3 (b) shows that the majority of
pro�les maintain a stable low variance, whereas Fig. 3 (a) shows a slow increase in pro�le variances. Hence, a stricter similarity threshold resulted in better quality pro�les when using the Binary Cosine Similarity. Fig. 4 shows that all pro�les are of high quality with variance less than 0.3, which is more desirable than the results in Fig. threshold caused more stability and better quality of pro�les.
23
3.
Hence, a higher URL
Figure 3: U of L Library: Pro�le Variances (Binary Cosine Similarity , URL TH(0.04)) (a)
(b)
Figure 4: U of L Library: Pro�le Variances (Binary Cosine Similarity, URL TH(0.1)) (b)
(a)
Figs. 5 and 6 show the variance evolution when using the Robust Weight Similarity. The pro�les show similar metrics as in Fig. 3. The last con�guration in Fig. 6 (b) shows the best quality of pro�les, because most pro�les began with a small variance, and they kept improving, in contrast with the other con�gurations, where the variances either remained the same or increased. An overall conclusion can be drawn that more restrictive threshold values combined with the use of the pro�le and scale-sensitive Robust Weight Similarity tend to result in discovering very high quality pro�les over time.
The changes in the existing pro�le variance and the
emergence of new pro�les show that the users change their behavior over time, and that the
24
proposed framework was able to capture these changes. Figure 5: U of L Library: Pro�le Variances (Robust Weight Similarity , URL TH(0.04)) (a)
(b)
Figure 6: U of L Library: Pro�le Variances (Robust Weight Similarity , URL TH(0.1))
(a)
(b)
To study the overall pro�le quality, Fig. 7 shows the minimum, maximum, median, and average variance of the �nal pro�les at the end of evolution. The minimum, median, and average variance remained stable and within the same range for all di�erent con�gurations which indicates that the overall quality of pro�les is good. Fig. 7 (a) shows that moving the URL weight threshold value from 0.04 to a more restrictive value of 0.1 caused the maximum variance to drop drastically. On the other hand, the value of the cosine similarity threshold did not seem to have any e�ect. A low URL threshold value will cause more URLs to be added to the pro�le. Hence the pro�le would be matched with more sessions, which risks
25
reducing its quality. Fig. 7 (b) shows an opposite behavior, where the similarity threshold has more e�ect on the value of the maximum variance.
In contrast to the Binary Cosine
Similarity, the Robust Weight Similarity takes into account the pro�le variance, not just the number of common URLs in the pro�le and session. Hence, if the pro�le has low variance, it becomes harder for new sessions to match it. For this reason, changing the number of URLs in the pro�le by changing the URL threshold value will not have the same a�ect as it had when using the Binary Cosine Similarity. Figure 7: U of L Library: Pro�les Sigma Aggregates
(a)
(b)
4.3.3 Pro�le Evolution The percentage of each type of pro�le (discovered vs.
updated) for each time period
is shown in Fig. 8 for the Binary Cosine Similarity, and in Fig. 9 for the Robust Weight Similarity. The percentages of pro�les seem to be similar using the di�erent con�gurations, with the majority of pro�les being updated. However, a higher similarity threshold value caused more restricted pro�le updates, with more new pro�les being discovered or equivalently, more old pro�les remaining the same, as shown in Figs.
9 (b) and (d).
From the
users' behavior perspective, having the majority of pro�les being updated means that their activity is changing slowly over time, with small part of their activity to be completely new (which is re�ected by discovering new pro�les). Hence, this further proves that pro�les were
26
able to capture the changes over time while maintaining high quality. Figure 8: U of L Library: Pro�le Counts (Binary Cosine Similarity) (a)
(b)
(c)
(d)
Figure 9: U of L Library: Pro�le Counts (Robust Weight Similarity) (a)
(b)
(c)
(d)
4.3.4 Matching vs. Distinct sessions Fig.
10 shows the percentages of matching and distinct sessions for each time period
when using the Binary Cosine Similarity. All con�gurations show that at each time period, the percentage of matching sessions was between 15% and 25%. Fig. 11 shows the number of matching and distinct sessions when using the Robust Weight Similarity.
Figs.
11 (a)
and (c) show a similar behavior where the vast majority of sessions got matched, which is compatible with the �ndings in Fig. 9 (a) and (c). Figs. 11 (b) and (d) show a completely opposite behavior to Figs.
11 (a) and (c) where the majority of sessions are treated as
distinct. This is re�ected in Figs. 9 (b) and (d) where some pro�les were distinct. However having high percentage of distinct sessions doesn't mean high number of distinct pro�les being discovered, because these distinct sessions might be similar and account to only few pro�les. And this can be explained as changes in user behavior over time, but these changes
27
are similar to each other, i.e. users are interested in the same new links at the same time period. Figure 10: U of L Library: Matching vs. Distinct Sessions (Binary Cosine Similarity) (a)
(b)
(c)
(d)
Figure 11: U of L Library: Matching vs. Distinct Sessions (Robust Weight Similarity) (a)
(b)
(c)
The overall trend of matching sessions is shown in Fig.
(d)
12, which shows that for the
Binary Cosine Similarity, the percentage of matching sessions is similar for all con�gurations. However, for the Robust Weight Similarity, the percentage gets much higher when the matching threshold is lower. Figure 12: U of L Library: Matching Sessions Percentage
28
4.3.5 Pro�le Cardinality In Figure 13, the cardinality of the pro�les, with maximum variance (thus lowest quality) and minimum variance (thus highest quality), is plotted for each con�guration.
Fig.
13
(a) presents the results when using the Binary Cosine Similarity, showing that the URL weight threshold has most e�ect on the high quality pro�le (a high URL threshold reduces cardinality), whereas the similarity threshold value was the main factor a�ecting the lower quality pro�le. Fig. 13 (b) shows the results when using the Robust Weight Similarity. The cardinality of the high quality pro�le (with low variance) remains the same for all di�erent con�gurations. However, the cardinality of the pro�le with maximum variance is sensitive only to the similarity threshold value, where a lower threshold value causes higher cardinality. Figure 13: U of L Library: Cardinality of Max and Min Sigma
(a)
(b)
The cardinality percentage of each pro�le at each time period are plotted when using the Binary Cosine Similarity and Robust Weight Similarity in Figs. 14 and 15, respectively. For all con�gurations, the majority of pro�les witnessed a slight decrease in their cardinality over time, which means that there is a high competition between pro�les over acquiring new sessions. Only two pro�les are of poor quality: one in Fig. 15 (a) and one in Fig. 15 (c), where they have a high cardinality and variance, which means that they are most likely the �default� pro�les that end up acquiring all outlying sessions that did not match any of the
29
good clusters. The default pro�le is an expected artifact of the session to cluster assignment process, and is easy to recognize thanks to the evaluation metrics. Despite the fact that most pro�les has less than 10% cardinality, a lot of pro�les were generated which means diversity of users' behavior. Section 4.3.7 will elaborate more on the similarities among pro�les.
Figure 14: U of L Library: Pro�le Cardinalities (Binary Cosine Similarity) (a)
(b)
(c)
(d)
30
Figure 15: U of L Library: Pro�le Cardinalities (Robust Weight Similarity) (a)
(b)
(c)
(d)
4.3.6 Pro�le Counts The number of pro�les generated from the usage behavior is shown in Fig.
16.
Since
HUNC is a hierarchical algorithm, a high number of pro�les indicates more detailed pro�les, which is desirable. However, a larger number of pro�les typically causes a lower cardinality in the pro�les, as expected.
The Robust Weight Similarity Threshold value seems to be
the only factor a�ecting the number of pro�les, where a stricter value (0.6) generated more detailed pro�les.
31
Figure 16: U of L Library: Total Pro�les Count
4.3.7 Pro�le Pairwise Similarity The maximum, minimum, average, and median pro�le pairwise similarities are plotted in Fig. 17, as well as the percentage of
duplicate
dissimilarity from each other is less than 0.01.
pro�les.
Duplicate
Both Figs.
pro�les are those whose
17 (a) and (b) show similar
trends, where the maximum and median dissimilarity is 1 (which means that the majority of pro�les are completely di�erent), while the average di�erence is around 0.7 which can be translated to pro�les which are only 16% similar based on (5) and (6). The percentage of duplicate pro�les is almost zero in all cases, which supports our desire of developing high quality, distinct, and evolving (b) which translates to the (a) pro�les through di�erent time periods, dynamic nature of users' behavior. Figure 17: U of L Library: Pro�le Pair-wise Similarity Aggregates
32
4.3.8 Pro�le Density The pro�le Density evolution for the Binary Cosine Similarity and Robust Weight Similarity are shown in Figs. 18 and 19 respectively. The majority of pro�les seemed to improve their density over time, with the exception of a few pro�les as shown in Fig. 18 (a), which means that their variance kept increasing (since the cardinality cannot decrease over time). Figure 18: U of L Library: Pro�le Densities (Binary Cosine Similarity) (a)
(b)
(c)
(d)
33
Figure 19: U of L Library: Pro�le Densities (Robust Weight Similarity) (a)
(b)
(c)
(d)
4.3.9 Evolution vs. traditional or full discovery All the pro�les generated when using the traditional discovery approach had variance less than 0.2. And their density was high as shown in Fig. 20. Some of the pro�les generated using the evolution-based approach showed a comparable density as was seen in Fig. 19.
34
Figure 20: U of L Library: Traditional Pro�le Density
Fig.
21 compares the aggregate metrics for both discovery approaches (traditional vs.
evolution). The median, maximum, and average variances are lower when using the traditional approach than when using the evolution-based approach. However, Fig. 21 (b) shows that using the Robust Weight Similarity in tandem with evolution-based mining has discovered pro�les (at least one) whose variance is the lowest (hence highest quality) compared to all other approaches. Figure 21: U of L Library: Evolution vs Traditional Variance Aggregates
(a)
(b)
(c)
(d)
35
4.3.10 Analysis of the Evolution of the pro�les metrics Monitoring the pro�les metrics over time described in previous sections gives some insight on the evolution process of pro�les. Evaluating the quality of pro�les at each time period independently might result in misjudging the pro�le quality, whereas tracking the pro�le's metrics over di�erent time periods would result in a more accurate description of the pro�les' behavior, hence adding a model of pro�les' metrics evolution over time would improve the quality of the evaluation process (which will be conducted as a future research). For example, Pro�le 7 in Figure 19 (a) had a low density in the �rst two time periods compared to Pro�le 0, which would falsely indicate a lower quality, however, if compared along all time periods it shows that the density of Pro�le 7 is increasing whereas the density of Pro�le 0 is stable, hence Pro�le 7 is attracting more sessions (higher cardinality) while these sessions are closer to the pro�le prototype (lower variance) over time (i.e. Pro�le 7 became more specialized in a certain users' behavior over time).
4.4 Experiments Summary The results of the experiments showed that using the Robust Weight Similarity with a high similarity threshold value of 0.6, and a strict URL weight threshold of 0.1, gives the best results. The compactness of the pro�les for this con�guration kept improving over time, as seen in Fig. 6 (b). A lower pro�le variance means that the sessions are more similar to the pro�le. The high quality of the pro�les has made these pro�les able to match more incoming new sessions, as seen in Fig. 9 (d), where the majority of the pro�les got updated. Moreover, this con�guration resulted in more detailed pro�les, where the average number of pro�le was around 50% as seen in Fig. 16. These detailed pro�les were also very di�erent from each other (based on the pro�le pair-wise similarity measure), as seen in Fig. 17 (b), where the percentage of duplicate pro�les was almost 0. The pro�le quality using this con�guration was further con�rmed when the density of pro�les was found to be increasing over time, as seen in Fig. 19 (d).
36
Conclusion Online organizations and businesses have recently started using Web Usage Mining techniques to help track the behavior of their website users, and hence, better understand and satisfy their users' needs and maintain their loyalty.
However, only very few web usage
mining algorithms were able to deal with the changing nature of the web user activities, and a very limited body of literature has even addressed this evolution at all.
We have
presented an innovative and scalable framework that is capable of capturing the changing group behavior of the users of a website by mining its Web access log data over several periods, and by evaluating the results of this web usage mining using an arsenal of objective evaluation metrics that study the quality and characteristics of the pro�les over time. Unlike our previous work in [12], the work in this paper naturally threads together the pro�les over several periods, instead of having to do so post-mining. Also, unlike [12], we perform the threading pre-mining, which means that we match and thus discard large portions of the web access data during the pre-processing phase itself, leaving only a smaller portion of data to undergo rediscovery, thus improving scalability. The proposed framework develops a set of evolving pro�les that represent the usage patterns as pro�les, with each pro�le in turn consisting of a set of URLs, and each URL having its own degree of signi�cance in that pro�le. These pro�les o�er a simple way to model the users' behavior at any given time. In the future, we plan to tie our web usage mining directly into a model-based collaborative �ltering recommendation module. We will also investigate alternative and faster optimization techniques for the pro�le discovery (clustering), as well as methods to model the evolution of the evaluation metrics over time.
37
Bibliography [1] R. Cooley, B. Mobasher, and J. Srivastava. Web Mining:
Information and Pattern
discovery on the World Wide Web, Proc. IEEE Intl. Conf. Tools with AI, Newport Beach, CA, pp. 558-567, 1997.
[2] O. Nasraoui and R. Krishnapuram, and A. Joshi. Mining Web Access Logs Using a Relational Clustering Algorithm Based on a Robust Estimator, 8th International World Wide Web Conference, Toronto, pp. 40-41, 1999.
[3] J. Srivastava, R. Cooley, M. Deshpande. and P-N Tan, Web usage mining: Discovery and applications of usage patterns from web data, SIGKDD Explorations, Vol. 1, No. 2, Jan 2000, pp. 1-12.
[4] M. Spiliopoulou and L. C. Faulstich. WUM: A Web utilization Miner, in Proceedings of EDBT workshop WebDB98, Valencia, Spain, 1999.
[5] T. Yan, M. Jacobsen, H. Garcia-Molina, and U. Dayal. From user access patterns to dynamic hypertext linking. In Proceedings of the 5th International World Wide Web conference, Paris, France, 1996.
[6] O. Nasraoui and R. Krishnapuram. A New Evolutionary Approach to Web Usage and Context Sensitive Associations Mining, International Journal on Computational Intelligence and Applications - Special Issue on Internet Intelligent Systems, Vol. 2, No. 3, pp. 339-348, Sep. 2002.
38
[7] O. Nasraoui, C. Cardona, C. Rojas, and F. Gonzalez. Mining Evolving User Pro�les in Noisy Web Clickstream Data with a Scalable Immune System Clustering Algorithm, in Proc. of WebKDD 2003, Washington DC, Aug. 2003, 71-81.
[8] P. Desikan and J. Srivastava, Mining Temporally Evolving Graphs. In Proceedings of �WebKDD- 2004 workshop on Web Mining and Web Usage Analysis�, B. Mobasher, B. Liu, B. Masand, O. Nasraoui, Eds. part of the ACM KDD: Knowledge Discovery and Data Mining Conference, Seattle, WA, 2004.
[9] O. Nasraoui, C. Rojas, and C. Cardona, A Framework for Mining Evolving Trends in Web Data Streams using Dynamic Learning and Retrospective Validation, in Computer Networks, Special Issue on Web Dynamics, 50(14), Oct., 2006.
[10] I. Grabtree and S. Soltysiak, Identifying and Tracking Changing Interests. International Journal of Digital Libraries, vol. 2, 38-53.
[11] I. Koychev, Gradual Forgetting for Adaptation to Concept Drift. In Proceedings of ECAI 2000 Workshop Current Issues in Spatio-Temporal Reasoning. Berlin, Germany, 2000, pp. 101-106
[12] O. Nasraoui, M. Soliman, E. Saka, A. Badia, R. Germain, A Web Usage Mining Framework for Mining Evolving user Pro�les in Dynamic web Sites, IEEE Transactions on Knowledge and Data Engineering, Feb. 2008, pp 202-215
[13] A. Maloof, S. Michalski, Learning Evolving Concepts Using Partial-Memory Approach. Working Notefs of the 1995 AAAI Fall Symposium on Active learning, Boston, MA. Pp 70-73
[14] Nasraoui O., and Krishnapuram R., �A Novel Approach to Unsupervised Robust Clustering using Genetic Niching,� Proc. of the 9th IEEE International Conf. on Fuzzy Systems, San Antonio, TX, May 2000, pp. 170-175.
39
[15] L. Catledge and J. Pitkow. Characterizing browsing behaviors on the World Wide Web. Computer Networks and ISDN Systems, 27(6), 1995.
[16] J. H. Holland, Adaption in Natural and Arti�cial Systems (MIT Press, 1975)
[17] O. Nasraoui, C. Cardona-Uribe, C. Rojas-Coronel, �TECNO-Streams�: tracking evolving clusters in noisy data streams with a scalable immune system learning model, in: IEEE International Conference on Data Mining, Melbourne, Florida, November 2003.
[18] J. Pitkow and K.Bharat. Webviz: A tool for world-wide web access log analysis. In First International WWW Conference, 1994.
[19] B. Mobasher, N. Jain, E.Han, and J. Srivastava. Web mining: Pattern discovery from world wide web transactions. Technical Report TR 96-050, University of Minnesota, Dept. of Computer Science, Minneapolis, 1996
[20] R. Sarukkai, Link prediction and path analysis using Markov chains, Computer Networks Volume 33, Issues 1-6, June 2000, Pages 377-386
[21] R. Agrawal and R. Srikant, "Mining sequential patterns," p. 3, 11th International Conference on Data Engineering (ICDE'95), 1995
[22] P.-N. Tan, M. Steinbach, and V. Kumar, Introduction to Data Mining, Addison Wesley, 2005.
[23] R.Baraglia and F. Silvestri, "An Online Recommender System for Large Web Sites" IEEE/WIC/ACM International Conference on Web Intelligence (WI'04), pp. 199-205, 2004.
[24] Agrawal, R. and Srikant, R. Fast Algorithms for Mining Association Rules in Large Databases. In Proceedings of the 20th international Conference on Very Large Data Bases, p. 487-499, Sep. 1994.
40
[25] J Borges and M Levene , Data Mining of User Navigation Patterns, in Proc. of WebKDD 2000, KDD workshop on Web Usage Analysis and User Pro�ling, 2000
[26] M Spiliopoulou, C Pohle, and LC Faulstich, Improving the E�ectiveness of a Web Site with Web Usage Mining, In Proc. of WebKDD 2000, KDD workshop on Web Usage Analysis and User Pro�ling, 2000.
41