INTRODUCTION: MULTIPLE STARBURSTS IN M82. 1.1. A Fossil Starburst ? M82 is the prototype starburst galaxy. Observations at all wavelengths from radio ...
THE ASTRONOMICAL JOURNAL, 121 : 768È792, 2001 February ( 2001. The American Astronomical Society. All rights reserved. Printed in U.S.A.
THE FOSSIL STARBURST IN M821 RICHARD DE GRIJS2 AND ROBERT W. OÏCONNELL Department of Astronomy, University of Virginia, P.O. Box 3818, Charlottesville, VA 22903-0818 ; grijs=ast.cam.ac.uk, rwo=virginia.edu
AND JOHN S. GALLAGHER III Department of Astronomy, University of Wisconsin, 475 North Charter Street, Madison, WI 53706 ; jsg=astro.wisc.edu Received 2000 October 2 ; accepted 2000 November 2
ABSTRACT We present high-resolution HST imaging in the optical (WFPC2) and near-infrared (NICMOS) of a disk region 1 kpc northeast of the starburst core in the nearby galaxy M82. This region, M82 ““ B,ÏÏ has been suspected to be a fossil starburst site in which an intense episode of star formation occurred over 100 Myr ago, and our new observations conÐrm this interpretation. M82 thus presents us with the opportunity to observe both active and evolved starburst environments at close range. The surface brightness of M82 B is well above normal for galactic disks and comparable to the core surface brightnesses in spiral galaxies. Its intrinsic surface brightness at an age of 10 Myr was comparable to that found in the present-day nuclear starburst, indicating an event of comparable amplitude. We Ðnd a large, evolved system of super star clusters in M82 B. Using size as a criterion to distinguish cluster candidates from point sources, we identify a total of 113 super star cluster candidates. We use a two-color BV I diagram and evolutionary spectral synthesis models to separately estimate the extinction and age of each cluster. The clusters range in absolute magnitude from M0 \ [6 to [10, with a peak at [7.5. The derived age distribution suggests steady, continuing clusterV formation at a modest rate at early times ([2 Gyr ago), followed by a concentrated formation episode D600 Myr ago and more recent suppression of cluster formation. The peak episode coincides with independent dynamical estimates for the last tidal encounter with M81, which presumably induced the starburst. Our J- and H-band observations resolve the bright giant population in M82Ïs disk for the Ðrst time. Star formation evidently continued in M82 B until about 20È30 Myr ago, but none is found associated with the youngest generations in the nuclear starburst (age [ 15 Myr). After correcting the cluster luminosity function to a Ðducial age of 50 Myr, we Ðnd that the bright end is characterized by a power-law slope with a \ [1.2 ^ 0.3, similar to that of other young cluster systems in interacting galaxies. There is tentative evidence for broadening of the luminosity function due to dynamical destruction of lower mass clusters. Cluster sizes (2.34 ¹ R [ eff 10 pc, or 2.4 [ R [ 7.9 pc) and estimated masses (a median of 105 M ) are consistent with values core _ found for young super star cluster populations in M82Ïs core and other galaxies and with the progenitors of globular clusters. Key words : galaxies : evolution È galaxies : individual (M82) È galaxies : photometry È galaxies : starburst È galaxies : star clusters 1.
INTRODUCTION : MULTIPLE STARBURSTS IN M82
M82 (e.g., Lynds & Sandage 1963 ; Fabbiano & Trinchieri 1984 ; Watson, Stanger, & Griffiths 1984 ; McCarthy, Heckman, & van Breugel 1987 ; Shopbell & BlandHawthorn 1998 ; Strickland, Ponman, & Stevens 1997). All of the bright radio and infrared (IR) sources associated with the active starburst are conÐned to the galaxyÏs center. They lie within a radius of D250 pc and mostly su†er heavy extinction by dust, estimated to be in the range A D 5È25 V et al. (e.g., Telesco et al. 1991 ; McLeod et al. 1993 ; Satyapal 1995). They correspond spatially with bright optical structures, labeled M82 A, C, and E in OM. These are probably those parts of the starburst core which happen to be the least obscured along the line of sight (OÏConnell et al. 1995). However, there is good photometric and spectroscopic evidence that this was not the only major starburst episode to have occurred in M82. A region about 1 kpc northeast from the galactic center, M82 B (see OM and Fig. 1), has exactly the properties one would predict for a fossil starburst with an amplitude similar to the active burst in M82 A, C and E. M82 B has an intrinsic surface brightness of k0 D 16.5 mag arcsec~2 (measured in a 7A aperture). V Although this is fainter than the intrinsic V -band surface
1.1. A Fossil Starburst ? M82 is the prototype starburst galaxy. Observations at all wavelengths from radio to X-rays (reviewed in Telesco 1988 and Rieke et al. 1993) are consistent with the following scenario. During the last several 100 Myr, tidal interactions between M82 and M81 and/or other member galaxies of the M81 group have channeled large amounts of gas into the central regions of M82. This has induced a starburst which has continued for up to about 50 Myr at a star formation rate of D10 M yr~1. Energy deposited by supernovae, at a _ rate of D0.1 supernova yr~1 (e.g., OÏConnell & Mangano 1978, hereafter OM ; Rieke et al. 1980 ; McLeod et al. 1993), drives a large-scale galactic wind along the minor axis of ÈÈÈÈÈÈÈÈÈÈÈÈÈÈÈ 1 Based on observations with the NASA/ESA Hubble Space T elescope, obtained at the Space Telescope Science Institute, which is operated by the Association of Universities for Research in Astronomy (AURA), Inc., under NASA contract NAS 5-26555. 2 Present address : Institute of Astronomy, University of Cambridge, Madingley Road, Cambridge CB3 0HA, England UK.
768
FOSSIL STARBURST IN M82
769
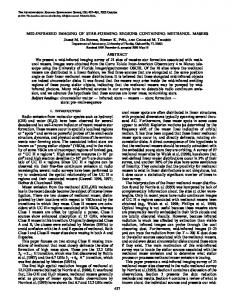
FIG. 1.ÈM82 B-band image, extracted from a Palomar 5 m plate taken by Sandage (exposure time 20 minutes, seeing [1A ; see OÏConnell et al. 1995) ; the W FPC2 Ðelds covered by the observations presented in this paper are indicated. The locations of regions M82 A, C, and H are also indicated.
brightness of M82 A, C, and E in the active starburst, it is nonetheless much higher than the maximum brightnesses encountered in spiral disks, even when seen edge-on. For the disks of typical edge-on Sb-Sd galaxies, de Grijs (1998) Ðnds central surface brightnesses of order k D 20È22 and B k D 18È20 mag arcsec~2. The surface brightness of M82 B I is, in fact, comparable to the nuclear brightnesses of bright Sb-Sc galaxies measured with similar resolution (e.g., de Jong 1996). By extrapolating region BÏs surface brightness back to an age of 10 Myr, using the evolutionary synthesis models of Bruzual & Charlot (see Leitherer et al. 1996 ; hereafter B96), we estimate that its surface brightness was of order k0 D 14.5 mag arcsec~2, similar to that presently observedV in the active starburst M82 A. The spectrum of M82 B is likewise consistent with a fossil starburst event, entirely comparable to that now transpiring in M82 A. It is dominated by Balmer absorption lines and shows a large Balmer discontinuity (OM ; Marcum & OÏConnell 1996). Emission lines are very weak, unlike in M82 A, which has intense line emission. These are the hallmarks of the anomalous ““ E]A ÏÏ spectra found in distant galaxy clusters that exhibit the Butcher-Oemler e†ect (Butcher & Oemler 1978 ; Oemler 1992). Such spectra are generally interpreted as the signature of a truncated burst of star formation that occurred 100È1000 Myr earlier (e.g., Couch & Sharples 1987 ; Dressler & Gunn 1990). These starbursts are thought to be part of the process by which disk galaxies are converted to elliptical or lenticular galaxies and probably result from tidal interactions, mergers or perhaps ram-pressure stripping by the intergalactic medium (Butcher & Oemler 1978 ; Oemler 1992 ; Barger et al. 1996).
From 20È40 A resolution spectrophotometry, OM and Marcum & OÏConnell (1996) Ðnd evidence of a sharp mainsequence truncation in M82 B, corresponding to a turno† age of D100È200 Myr and an average extinction of A D V 0.6 mag. Region AÏs spectrum, on the other hand, indicates a very young population (D5 Myr) and is more heavily a†ected by extinction (A D 2.2 mag). V properties of M82 B, three other Apart from the physical considerations support the notion that multiple starbursts have occurred in M82. First, the triggering gravitational interactions between M82 and other members of the M81 group and the associated tidal gas Ñows have been proceeding for more than 200 Myr (e.g., Yun, Ho, & Lo 1994), in which time multiple starbursts could easily have occurred. Second, starbursts are unlikely to be synchronized throughout the disturbed galaxy, and Satyapal et al. (1997) Ðnd evidence of outward propagation of star formation in the dense core of M82. Finally, it is likely that starbursts are strongly self-limited, or quenched, by supernova-driven outÑows, which remove the remaining cool gas from the immediate starburst region (e.g., Chevalier & Clegg 1985 ; Doane & Mathews 1993). The remarkable minor-axis wind in M82 is a dramatic example of this process. However, the disturbed conditions near an early burst may discourage reignition at the same site when cool gas inÑows resume, shifting the location of active star formation. Although other interesting examples of relatively nearby post-starburst systems have been located (e.g., Vigroux, Boulade, & Rose 1989 ; Oegerle, Hill, & Hoessel 1991 ; Caldwell et al. 1993 ; Caldwell & Rose 1997) none of these, nor
770
DE GRIJS, OÏCONNELL, & GALLAGHER
any other nearby starburst, o†er the opportunity to study two discrete starbursts at such close range as M82. The active starburst in the inner 250 pc of M82 has been studied thoroughly, whereas the fossil starburst in region B has not received much attention. The aim of this paper is to study the remains of this earlier episode in detail, with emphasis on young star cluster candidates. 1.2. Super Star Clusters in M82 Using Hubble Space T elescope (HST ) imaging of the bright central regions A, C, and E of M82, OÏConnell et al. (1995) resolved these into a swarm of over 100 young star cluster candidates, with a mean L D 4 ] 106 L , brighter V _ than any globular cluster in the Local Group. Satyapal et al. (1997) found evidence in the near-IR of a dozen compact clusters lying deeper within the heavily obscured core of the galaxy near A, C, and E. The core clusters show an age dispersion of 6 Myr and indications of outward propagation of star formation. Gallagher & Smith (1999) determined a signiÐcantly older age of 60 Myr for the luminous cluster F, which is located 440 pc southwest of the nucleus. Such ““ super ÏÏ star clusters (SSCs) have been discovered, mostly with HST , in other interacting, amorphous, dwarf, and starburst galaxies (e.g., Arp & Sandage 1985 ; Melnick, Moles, & Terlevich 1985 ; Meurer et al. 1992 ; Holtzman et al. 1992 ; Whitmore et al. 1993, 1999 ; Hunter et al. 1994, 2000 ; OÏConnell, Gallagher, & Hunter 1994 ; Ho & Filippenko 1996b ; Conti, Leitherer, & Vacca 1996 ; Ho 1997 ; Watson et al. 1996 ; Carlson et al. 1998). Their diameters, luminosities, andÈin several casesÈmasses are consistent with these being young globular clusters formed as a result of recent gas Ñows (e.g., van den Bergh 1995 ; Meurer 1995 ; Ho & Filippenko 1996a ; Hunter et al. 2000). In the case of M82 F, Smith & Gallagher (2000) obtained a dynamical mass of 2 ] 106 M . It is possible that a large fraction of the star formation _ in starbursts takes place in the form of such concentrated clusters. The discovery that globular cluster formation, once thought to occur only during early stages of galaxy evolution, continues today is one of HST Ïs main contributions to astrophysics to date. M82 is one of the few galaxies containing a rich, starburst-induced cluster system, which is near enough that the internal structure of individual SSCs can be studied. Most cluster systems are too distant for such work, even with HST . Apart from their intrinsic interest, SSCs can be individually age-dated and are therefore important tracers of the history of the starburst process across the face of a galaxy like M82. If region B is indeed a fossil starburst site, it probably contains evolved clusters, which originally had properties similar to those now observed in region A. The presence of both the active and the fossil starburst sites in M82 therefore provides a unique arena for the study of the stellar and dynamical evolution of star cluster systems. Even in the time interval of 0.3È1 Gyr that has probably elapsed since the starburst in region B, evolutionary e†ects might be detectable because of the dense environment of the starburst. In order to explore the fossil starburst site and to detect candidate SSCs, we therefore made new, multiband optical/near-IR observations of region B with HST . In ° 2, we provide an overview of the observations and the image processing techniques applied. Sections 3 and 4 describe the general characteristics of region B ; ° 5 gives an
Vol. 121
outline of the analysis techniques used to select our star cluster candidates and obtain the results presented in the subsequent sections. We report the Ðrst detection of the resolved Ðeld stellar population in the disk of M82 in ° 6. A discussion of the ages of the star cluster sample, in terms of evolutionary spectral synthesis models is presented in ° 7. The cluster luminosity functions and estimated masses are discussed in °° 8 and 9, respectively. In ° 10 we present a detailed analysis of the cluster proÐles. Finally, in ° 11 we summarize our results and conclusions. 2.
OBSERVATIONS AND DATA REDUCTION
2.1. Broadband HST Imaging We observed M82 B on 1997 September 15 with both the W ide Field Planetary Camera 2 (W FPC2) and the NearInfrared Camera and Multi-Object Spectrometer (NICMOS) on board the HST (program ID 7446). We imaged two adjacent 35A square Ðelds, ““ B1 ÏÏ and ““ B2,ÏÏ with the Planetary Camera (PC) chip (0A. 0455 pixel~1) of the WFPC2. Field centers (J2000.0) of the PC were R.A. \ 09h56m02s. 695, decl. \ ]69¡41@10A. 05 for B1 and R.A. \ 09h55m57s. 195, decl. \ ]69¡41@06A. 35 for B2. We used the F439W, F555W, and F814W passbands, with total integration times of 4400, 2500, and 2200 s, respectively, for region B1 and 4100, 3100, and 2200 s, respectively, for region B2. The Ðeld of view during the observations was rotated clockwise by, respectively, 19¡.09 and 20¡.55 from the north-south axis. These observations were obtained with four exposures per Ðlter, using two exposure times, to facilitate the removal of cosmic-ray events and increase dynamic range. The W FPC2 F439W, F555W, and F814W Ðlters are roughly comparable to the Johnson-Cousins broadband B, V , and I Ðlters, respectively. In Figure 1 we have overlaid the contours of our two W FPC2 Ðelds on a B-band image, extracted from a Palomar 5 m plate taken by Sandage (exposure time 20 minutes, seeing [1A ; see OÏConnell et al. 1995). The PC CCD chip is the square ““ step ÏÏ in the overall L-shaped footprint of the W FPC2. The contours are labeled by the part of region B which is centered on the PC. ““ B1 ÏÏ is an irregular, high surface brightness region lying along the major axis of the galaxy about 55A (960 pc) northeast of the brightest optical region, A. (For the distance of M82, we adopt 3.6 Mpc, or m [ M \ 27.8 mag, based on the Cepheid distance for M81 obtained by Freedman et al. 1994 ; see also Sakai & Madore 1999. The corresponding linear scale is 17.5 pc arcsec~1.) Region B2 is halfway between B1 and A and is therefore closer to the nuclear starburst. It has lower B-band surface brightness than B1 and is more enveloped in complex dust lanes. The conspicuous central dust lane, which bisects the galaxy marks the western edge of B2. In the near-IR we chose to use NICMOS Camera 2 (0A. 075 pixel~1) as the best compromise of resolution and Ðeld of view. For both B1 and B2, we acquired four partially overlapping exposures in both the F110W and F160W Ðlters (comparable to the Bessell J and H Ðlters, respectively) in a tiled pattern. The integrations, with e†ective integration times of 768 s for each Ðeld and Ðlter, were taken in MULTIACCUM mode to preserve dynamic range and to correct for cosmic rays. Sky background exposures were not necessary because of the brightness of the sources.
No. 2, 2001
FOSSIL STARBURST IN M82
2.2. Image Processing Pipeline image reduction and calibration was done with standard procedures by the Space Telescope Science Institute (STScI), using the updated and corrected on-orbit Ñat Ðelds most appropriate for our observations. Since our W FPC2 images with a common pointing were aligned to within a few hundredths of a pixel, we simply co-added the individual observations in a given Ðlter using the IRAF/STSDAS3 task CRREJ. This task also removed cosmic-ray events in a series of iterations that allow correction for cosmic-ray hits in pixels adjacent to those that already have been corrected in an earlier iteration. After some experimenting, we found that as few as two to three iterations produce output images in which the remaining cosmic-ray hitsÈif anyÈare indistinguishable from Poisson noise in the relatively bright background levels of our images. Due to the smaller Ðeld of view of NICMOS Camera 2, we had to mosaic the four tiled exposures at each position to cover an area comparable to the PC Ðeld. The mosaicking was done using objects in common on the frames for the determination of the exact spatial o†sets. The Ñux histogram in the overlapping area was used to determine the necessary adjustment of background levels (see de Grijs 1997, 1998). The rebinning (under conservation of the observed Ñux) and rotation of the NICMOS images to the W FPC2 pixel size and orientation, and the alignment of the optical and near-IR images were performed using the standard IRAF tasks MAGNIFY, ROTATE, and IMALIGN. We determined the rotation angles and alignment o†sets using objects in common on optical and near-IR images. The Ðnal, aligned images were trimmed to a standard size (759 ] 747 pixels, or 34A. 53 ] 33 A. 99) to facilitate object detection in a common reference frame. 2.3. Photometric Calibration We used the transformation coefficients of Holtzman et al. (1995) to convert measurements made from the W FPC2 images to the standard B, V , I photometric system : B \ [2.5 log C0 (F439W) ] (0.003 ^ 0.007) ] (B[V ) ] ([0.088 ^ 0.003)(B[V )2 ] (20.070 ^ 0.004) ] 2.5 log (GR) ,
(1)
V \ [2.5 log C0 (F555W) ] ([0.052 ^ 0.007) ] (V [I) ] (0.027 ^ 0.002)(V [I)2 ] (21.725 ^ 0.005) ] 2.5 log (GR) ,
(2)
and I \ [2.5 log C0 (F814W) ] ([0.062 ^ 0.009) ] (V [I) ] (0.025 ^ 0.002)(V [I)2 ] (20.839 ^ 0.006) ] 2.5 log (GR) .
(3)
ÈÈÈÈÈÈÈÈÈÈÈÈÈÈÈ 3 The Image Reduction and Analysis Facility (IRAF) is distributed by the National Optical Astronomy Observatories, which is operated by the Association of Universities for Research in Astronomy, Inc., under cooperative agreement with the National Science Foundation. STSDAS, the Space Telescope Science Data Analysis System, contains tasks complementary to the existing IRAF tasks. We used Version 2.0 (1997 September) for the data reduction performed in this paper.
771
Here, C0 is the sum of the pixel values from the processed images in the spatial area of interest divided by the integration time, and GR is the gain ratio as deÐned by Holtzman et al. (1995). For the PC chip, with an analog-to-digital gain of seven electrons (as for our observations) GR \ 1.987. These transformations hold for [0.3 \ (B[V ) \ 1.5 and [0.3 \ (V [I) \ 1.5. The cluster colors in M82 B are well within these colors ranges (° 7.2). The color terms in equations (1)È(3) are deÐned in the standard system ; consequently, the equations must be applied iteratively to measures from the WFPC2 frames. Based on both ground-based and HST observations, emission lines are not strong in regions B1 and B2, although some [O II] j3727 emission is present throughout and there are faint compact Ha sources in the western half of B2 (OM ; de Grijs et al. 2000). We therefore do not include any correction for contamination by emission-line Ñux of the optical standard magnitudes. The corresponding Ñight-to-JH transformation coefficients for the calibration of our NICMOS images, for 0.2 \ (J[H) \ 1.1, were adopted from Stephens et al. (2000) : J \ [2.5 log C0 (F110W) [ (0.344 ^ 0.063) ] (m[F110W] [ m[F160W]) ] (22.054 ^ 0.034)
(4)
and H \ [2.5 log C0 (F160W) [ (0.305 ^ 0.065) ] (m[F110W] [ m[F160W]) ] (21.715 ^ 0.037) ,
(5)
where m(i) \ [2.5 log C0 (i). [For their calibration, Stephens et al. 2000 measured log C0 (i) for calibrator stars in an 0A. 5 aperture.] The colors of the cluster candidates in M82 B fall within the range for which this calibration is applicable. We estimated foreground extinction by our Galaxy from Burstein & Heiles (1984) ; who give A \ 0.12 mag for M82. B W FPC2 passbands We determined the extinction in the assuming the Galactic extinction law of Rieke & Lebofsky (1985 ; A /A \ 1.324), with the following results : A /A B\ V1.367, A /A \ 1.081, A /A \ F439W F555W F814W 0.480, A V /A \ 0.352, and AV /A \ 0.191 mag.V F110W V V compared our As a photometric consistency F160W check, we photometry of the M82 B1 region with ground-based observations. The total V -band magnitude and (B[V ) color in a 7A diameter aperture, aligned with the relatively sharp dust feature at the outer edge of the B1 region, and not corrected for either foreground or internal extinction, are V \ 13.3 ^ 0.2 ; (B[V ) \ 0.82. This corresponds to aB1V -band B1 surface brightness of k \ 17.3 ^ 0.2 mag arcsec~2. V,B1of the same area yield V \ Ground-based observations B1 13.05 and (B[V ) \ 0.84 (OM). Considering the possible B1 e†ects of centering di†erences and small atmospheric zeropoint o†sets, the agreement is excellent. In addition, comparison of derived V -band magnitudes of isolated stars in our u Cen control Ðeld (° 2.4) with those obtained by DÏCruz et al. (2000) from the same Ðeld showed agreement to within the measurement errors. 2.4. Synthetic Control Fields Small-scale variability in the bright M82 background is a serious problem for our resolved-source photometry (see ° 4
772
DE GRIJS, OÏCONNELL, & GALLAGHER
Vol. 121
TABLE 1 BACKGROUND SURFACE BRIGHTNESSES AND STATISTICS OF THE M82 B FIELDS
Region
Filter
Mode (mag arcsec~2)
p (mag arcsec~2)
B1 . . . . . .
B V I J H
19.58 18.68 17.35 16.25 15.64
0.76 0.66 0.55 0.54 0.53
and Table 1). To assess its impact, we tested our reduction and calibration procedures on synthetic data Ðelds in two di†erent ways. 1. First, we created artiÐcial star Ðelds by randomly and uniformly adding 500 Gaussian star proÐles to empty frames of the same size as our science observations (with zero background). We required that the centers of the artiÐcial sources should be at least 6 pixels (0A. 273) from the edges of the frames. The FWHMs of the synthetic point sources were obtained from observational PSFs in the WFPC2 PSF library, with FWHM \ 1.44 pixels or 0A. 066, F555W FWHM \ 1.59 pixels or 0A. 072, and they were scaled F814W magnitudes. The histogram of input magnito the desired tudes was chosen to approximate a power-law distribution, similar to those of the luminosity functions in the M82 B regions, and extending to well below the 50% completeness limits (° 5.3). To simulate the observational situation as closely as possible, we added Poisson noise to the point sources. We then added these control Ðelds to the observed M82 data frames to produce synthetic data frames to use as tests of our photometric accuracy and completeness. 2. In ° 5.4 we use image sizes to discriminate stars from clusters. So that we could test our technique on stellar images which were as realistic as possible, we created another set of synthetic images based on real HST observations in the F555W passband of an uncrowded star Ðeld in the globular cluster u Centauri obtained by DÏCruz et al. (2000). We combined the PC exposures of their ““ position 2 ÏÏ (J2000.0, R.A. \ 13h26m41¡.48, decl. \ [47¡31@07A. 38)
Region
Filter
Mode (mag arcsec~2)
p (mag arcsec~2)
B2 . . . . . .
B V I J H
19.58 18.75 17.34 15.96 15.26
0.57 0.52 0.46 0.74 0.76
into a single median-Ðltered F555W image. Sky background is near zero on this image. We then added this ““ u Cen Ðeld ÏÏ image, with di†erent scale factors, to our observed M82 data frames as a test of our techniques to distinguish stars from clusters. In Figure 2 we show the error curves resulting from measuring the brightnesses of the artiÐcial sources in our type 1 control Ðeld in the same fashion as those of the real sources discussed in ° 5.1. As a function of input source magnitude we have plotted the (1 p) standard deviations of the distribution of the di†erences between the input and retrieved magnitudes, for all passbands and both regions. The resulting error estimates (e.g., p D 0.1 mag at V D 21) are V be the case for isolated signiÐcantly higher than would point sources on a clean sky background. The increase is due to the bright and variable background in M82. 3.
GENERAL MORPHOLOGY OF REGION B
The mosaics for regions B1 and B2 resulting from our reduction are shown in Figures 3 and 4, respectively. Each Ðgure includes the entire V -band W FPC2 mosaic for that region, corresponding to the contours overlaid on the ground-based image (Fig. 1), surrounded by the fullresolution PC and NICMOS images of the region in the Ðve Ðlters used. Figures 5 and 6 are enlargements of the B1 and B2 Ðelds, respectively, showing the B-band PC image on the left and the mean of the NICMOS J and H mosaics on the right.
FIG. 2.ÈPhotometric error curves for the M82 B Ðelds, as a function of input (synthetic) source magnitude
No. 2, 2001
FOSSIL STARBURST IN M82 WF:
10’’
PC:
5’’
773 B
N E
V
V
M82 B1
H
J
I
FIG. 3.ÈV -band W FPC2 mosaic of M82 B1, and PC (or equivalent) Ðelds for all passbands ; the NICMOS Ðelds were adjusted to match the PC Ðeld and pixel size.
Both regions are riddled with dust lanes which become more prominent at shorter wavelengths. The densest lanes are found in the southwest quadrant of region B2, nearest the center of M82. Here, they are detectable even on the longest-wavelength (H-band) image. Extinction e†ects completely transform the appearance of region B2 between the H and the B bands. The most luminous objects in B2 are obscured in the B-band by the lanes in the lower right quadrant. The H-band image of B1 is nearly free of distinct dust lanes and shows a partially resolved, bright concentration of light running along the major axis of the galaxy. This is undoubtedly the underlying stellar disk of M82. A dust lane bisects region B1. The photometry and spectra of region B discussed by OM and Marcum & OÏConnell (1996) were based on observations of the easternmost part of B1 (top left lobe, Fig. 5). There are bright resolved or semi-resolved structures in all bands, though fewer are present at short wavelengths. The brighter of these appear to be SSCs. Only a few such objects are detectable even with good seeing on groundbased images (e.g., object H in Fig. 1). The myriad of faint point sources detectable in the I band but more easily visible on the J and H frames are luminous, cool giants, resolved for the Ðrst time in the main body of the galaxy on these exposures (° 6). The red giant branch tip was Ðrst
detected in the halo of M82 on HST V and I exposures at I D 24.0 by Sakai & Madore (1999). 4.
REGION B BACKGROUND SURFACE BRIGHTNESS
To determine the background surface brightness level in regions B1 and B2, we sampled Ñuxes in 500 randomly placed 10 pixel radius apertures in each Ðeld and Ðlter. Results are summarized in Table 1. The modal background surface brightnesses and dispersions are derived from Gaussian Ðts to the resulting Ñux histograms. The B-band value for region B1 is signiÐcantly fainter than that quoted in ° 2.3 because the 7A apertures used there were centered on the brightest subregion within the B1 Ðeld. Both regions are anomalously bright compared with normal galaxies. The background surface brightnesses in Table 1 are D1È3 mag arcsec~2 brighter than the typical disk central surface brightnesses of normal spiral galaxies, seen either face-on (e.g., de Jong 1996) or edge-on (e.g., de Grijs 1998). In fact, they are similar to the bulge core brightnesses of normal galaxies. As argued in ° 1.1, this is evidence for unusually intense star formation in the past, extending up to a radius of 1 kpc, well beyond the conÐnes of the active present-day starburst. M82 would be regarded as a very unusual galaxy even in the absence of its emission-line plume and the radio/IR
WF:
10’’
PC:
5’’
B
N E
V
V
M82 B2
H
J
I
FIG. 4.ÈObservations of M82 B2, similar to those of B1 in Fig. 3
FIG. 5.ÈComparison of the detailed structures in M82 B1 between the optical B band and the mean of the near-IR J and H Ðlters
FOSSIL STARBURST IN M82
775
FIG. 6.ÈSame as Fig. 5, but for region B2
indicators of activity because of the strange, high surface brightness optical structures found in its central disk. 5.
CLUSTER IDENTIFICATION AND PHOTOMETRY
5.1. Source Selection We based our initial selection of source candidates on a modiÐed version of the DAOFIND task in the DAOPHOT software package (Stetson 1987), running under IDL.4 Experiments revealed a large disparity in candidate lists based on the di†erent wavelength bands, as might be expected from the appearance of Figures 3È6. Candidates identiÐed in the near-IR images are often too faint for meaningful measurements in the B or V bands and vice versa. Therefore, we decided to combine and cross-correlate source lists obtained in individual passbands and to supplement the automated identiÐcations with visual inspections. We performed extensive checks to Ðnd the best selection criteria and thus to minimize the e†ects of dust features, residual cosmic rays, Poisson noise in regions of high surface brightness, and the CCD edges. We chose our detection thresholds such that the numbers of initial candidates selected from each passband were comparable. Next, we cross-correlated the source lists obtained in the individual passbands, allowing for only a 1 pixel positional mismatch between the individual optical or near-IR bands ; we allowed for a 2 pixel mismatch when cross-correlating optical/near-IR source positions, since the NICMOS and WFPC2 optical paths are slightly di†erent. This procedure led us to conclude that the cross-correlation of the identiÐcations in the F555W and F814W Ðlters (V and I) contains the most representative fraction of the population of genuine sources in M82 B. ÈÈÈÈÈÈÈÈÈÈÈÈÈÈÈ 4 The Interactive Data Language (IDL) is licensed by Research Systems, Inc., of Boulder, CO.
To reject artifacts remaining in the cross-correlated V ?I list and real sources which were badly situated for aperture photometry, we visually examined all the candidates on enlargements of the F555W and F814W images. We discovered that many of the listed candidates were artifacts and, moreover, that a number of plausible candidates had not been included by the automated algorithms because of complicated structures, extended proÐles, or a highly nonuniform background. There were 268 and 147 sources in the B1 and B2 Ðelds, respectively, that were missed by the automated detection routine in F555W and F814W. We added these to the lists. The complete source lists thus obtained contain 735 and 640 candidates in M82 B1 and B2, respectively. Several systematic biases are inevitably introduced by the source selection procedure. Very blue or very red objects could be excluded because of the primary V ?I selection. From the standpoint of age-dating the star forming activity in region B, the blue omissions are probably more important. Visual inspection of the B-band frames indicated that a number of the obvious sources brighter than B ^ 24.0 mag were missed. We added these sources to the lists, 40 and 25, respectively, in B1 and B2. In addition, most of the swarm of faint pointlike sources present in the F110W and F160W frames are not detected in V either and therefore are not included in our Ðnal source list. Although most of these fainter near-IR sources appear to be cool stars (we comment on them separately in ° 6), we added the 58 and 94 brightest near-IR sources that were missed by our automated detection routine to the source lists for B1 and B2, respectively. Extinction is obviously a limiting factor in our ability to sample the resolved sources in region B. By basing our selection on V and I, we are probably biased toward the surface regions of M82 B. However, we are conÐdent that we have been able to detect nearly all of the cluster candidates in the brightest 3È4 mag of the luminosity function in any of the observed passbands.
776
DE GRIJS, OÏCONNELL, & GALLAGHER
Vol. 121
The total number of visually veriÐed sources contained in our source lists is 833 and 759, respectively, for M82 B1 and B2. 5.2. Source Photometry The coordinates from the source lists obtained in the previous section were used as the centers for DAOPHOT aperture photometry in all passbands. The correct choice of source and background aperture sizes is critical for the quality of the resulting photometry. Due to the complex structure of M82 B, we concluded that we had to assign apertures for source Ñux and background level determination individually to each candidate by visual inspection. The ““ standard ÏÏ apertures for the majority of the sources were set at a 5 pixel radius for the source aperture and an annulus between 5 and 8 pixels for the background determination, although in individual cases we had to deviate signiÐcantly from these values. Our photometry includes most of the light of each cluster candidate. At the distance of M82, an aperture of radius 5 pixels (0A. 228) corresponds to a projected linear diameter of D8 pc, which is larger than the sizes of the majority of SSCs that have been detected in other galaxies (e.g., Whitmore et al. 1993 ; Hunter et al. 1994 ; OÏConnell et al. 1994 ; Barth et al. 1995 ; Whitmore & Schweizer 1995 ; Schweizer et al. 1996 ; Watson et al. 1996 ; Miller et al. 1997 ; De Marchi et al. 1997). Deconvolved HST WF/PC1 images also indicate that the young star clusters in the central regions of M82 typically have half-peak intensity sizes of D3.5 pc or 0A. 2 (OÏConnell et al. 1995). 5.3. Completeness We estimated the completeness of our source lists by using the synthetic F555W and F814W images derived for artiÐcial stars described in ° 2.4. The artiÐcial sources were given input magnitudes between 20.0 and 26.0 mag and (F555W[F814W) colors distributed around zero (V [I B 1.3), which is approximately typical of the color distribution of the cluster candidates (° 7.2). We found that the e†ects of image crowding are small : only D1%È2% of the simulated objects were not retrieved by the DAOFIND routine due to crowding. However, the e†ects of the bright and irregular background and dust lanes are large. Figure 7 shows the fraction of simulated point sources that was recovered, as a function of brightness in the STMAG system. Incompleteness becomes severe (i.e., the completeness drops below D50%) for m (F555W) [ ST 23.1 and 23.3 mag for M82 B1 and B2, respectively, and for m (F814W) [ 23.5 mag. The di†erence between F555W ST Johnson V is F555W[V ^ 0.02 to 0.05 for A0V to and O5V spectral types, and between F814W and Cousins I is F814W[I D [1.1 to [1.2 for similar spectral-type objects (from the IRAF/SYNPHOT package). Since the incompleteness threshold is mainly sensitive to the local background noise, we added 200 synthetic sources to smaller areas (250 ] 250 pixels or 11A. 375 ] 11A. 375) in the B1 region with relatively high and relatively low backgrounds in the F814W passband. The completeness curves resulting from this exercise are shown in Figure 7c. Our results are comparable to those obtained from a similar exercise by Miller et al. (1997) ; they clearly show the signiÐcant e†ects of the variable background. Foreground stars are not a source of confusion in the case of M82. The Milky Way models of Bahcall & Soneira
FIG. 7.ÈResults of completeness tests obtained from artiÐcial star counts as described in the text.
(1980) predict that only 1.5 ^ 0.2 foreground stars, in the magnitude range of our cluster candidates, would be in the PC Ðeld. 5.4. Separation of Clusters from Stars, Quality Assessment, and Final Cluster Sample M82 is near enough, and the HST images have high enough resolution, that we can separate at least the larger clusters in M82 from stars on the basis of their sizes. Separation on the basis of brightness alone, which is the primary method available even with HST in the case of most putative SSC systems, is dangerous here because of the possible presence of luminous supergiant stars. In general, the radial luminosity proÐle of a star cluster is characterized by a core radius, R , the radius at which the corepeak surface brightness, surface brightness equals half the and an e†ective radius, R , enclosing half of the total light. In practice, these radii areeffdifficult to measure directly from HST observations because of resolution and background e†ects. Therefore, the method most often used to extract spatial information for marginally resolved young star cluster candidates is to measure the magnitude di†erence between two apertures, chosen to be characteristic of the selected sourcesÏ spatial extents (e.g., Whitmore et al. 1993 ; Barth et al. 1995 ; Whitmore & Schweizer 1995 ; Holtzman et al. 1996 ; Schweizer et al. 1996 ; Miller et al. 1997 ; Carlson et al. 1998). These magnitude di†erences can be calibrated by convolving the theoretical or observational PSF with an assumed radial light distribution for the clusters. Unfortunately, the complex structure of M82 B precludes use of this method. We found from tests using our synthetic star Ðelds (° 2.4) that a variable background signiÐcantly distorts the histogram of magnitude di†erences in the two aperture method, although a smooth background does not. This leads to overestimates of the sizes of point sources. Instead of the aperture method, we have based our discriminant for extended sources in the M82 B Ðelds on the statistical di†erences between the size characteristics of
No. 2, 2001
FOSSIL STARBURST IN M82
777
FIG. 8.ÈDistribution of p for B1 and B2 (open histograms). All sources down to and including the 50% completeness limits have been included. The Gaussian shaded histograms are the corresponding size distributions for the u Cen control Ðeld, scaled to the peak of the M82 B histograms and added to the observed Ðelds. We have indicated the size limit adopted to distinguish between stars and star clusters by the dashed line at p \ 1.25 pixels. G
sources in these Ðelds and those of the stars in the u Cen control Ðeld (° 2.4) added to the M82 B Ðelds with scaling such that the output magnitudes of the u Cen stars were in the same range as those of the M82 B sources. We determined characteristic sizes in the F555W images of both our M82 B candidate source list and the u Cen stars using a two-dimensional Gaussian Ðtting routine. Although the true luminosity proÐles of the star clusters in M82 B may di†er from Gaussians (° 10), this method allows us to distinguish satisfactorily between compact and extended sources. Results of such Ðts to the candidate sources and to the u Cen stars injected into the M82 B images are shown in Figure 8. The shaded histograms show the distribution of
FIG. 9.ÈCluster luminosity functions for our sample of candidate SSCs. The open histogram represents the CLF for M82 B1 ; the shaded histogram shows the B2 CLF. The dashed line indicates our selection limit at V \ 22.5 mag.
sizes for the u Cen control stars, while the open histograms show the distributions for the candidate clusters in M82 B. There is a clear di†erence, demonstrating that many of the candidates are indeed extended sources. On statistical grounds, relatively little contamination of our results by point sources will occur if we adopt for our primary cluster sample objects with p º 1.25 pixels (0A. 0569, or 1.0 pc), G where p is the best-Ðt Gaussian sigma. G We are mainly interested in obtaining good photometry for a representative, if not complete, sample of M82 B clus-
FIG. 10.ÈSelection of the extended cluster samples in the V [p plane. All sources with p º 1.25 pixels are shown as Ðlled dots ; smaller Gsources are plotted as openG circles. The selection limits at p \ 1.25 pixels and the G 50% completeness limits are shown as the dashed lines. Our Ðnal, veriÐed samples are represented by the sources in the upper left section of the V [p plane. G
778
DE GRIJS, OÏCONNELL, & GALLAGHER TABLE 2 OBSERVED PROPERTIES OF THE CLUSTER SAMPLE IN M82 B1
No. 1 ..... 2 ..... 3 ..... 4 ..... 5 ..... 6 ..... 7 ..... 8 ..... 9 ..... 10 . . . 11 . . . 12 . . . 13 . . . 14 . . . 15 . . . 16 . . . 17 . . . 18 . . . 19 . . . 20 . . . 21 . . . 22 . . . 23 . . . 24 . . . 25 . . . 26 . . . 27 . . . 28 . . . 29 . . . 30 . . . 31 . . . 32 . . . 33 . . . 34 . . . 35 . . . 36 . . . 37 . . . 38 . . . 39 . . . 40 . . . 41 . . . 42 . . . 43 . . .
* R.A.a (sec) [1.33 [0.01 0.28 [1.16 1.62 0.57 0.75 0.86 1.18 0.80 0.84 0.03 1.11 0.41 0.33 0.24 2.16 2.47 3.28 2.22 [0.20 1.41 1.56 1.25 0.08 2.49 2.94 3.34 [0.07 3.33 3.75 2.51 1.67 2.68 0.84 3.76 2.11 3.48 5.96 3.46 3.81 4.92 1.19
* Decl.a p G (arcsec) (arcsec) 1.55 1.47 1.44 4.71 [0.26 2.49 5.70 6.44 6.95 8.10 8.38 0.55 8.95 0.73 0.87 1.65 8.33 8.10 6.70 9.04 4.31 2.26 3.07 4.06 6.32 2.18 2.44 2.22 8.38 3.38 2.76 5.33 7.17 6.30 9.80 4.81 8.34 0.34 6.34 2.39 2.32 1.45 0.62
0.07 0.13 0.10 0.13 0.12 0.14 0.09 0.13 0.09 0.06 0.11 0.09 0.13 0.14 0.16 0.07 0.08 0.11 0.08 0.12 0.14 0.10 0.08 0.12 0.15 0.11 0.12 0.11 0.12 0.06 0.14 0.07 0.07 0.12 0.20 0.14 0.10 0.11 0.10 0.07 0.18 0.17 0.11
B (mag)
V (mag)
I (mag)
J (mag)
H (mag)
22.86 ^ 0.08 21.99 ^ 0.07 [22.97 21.91 ^ 0.07 21.90 ^ 0.05 20.47 ^ 0.06 19.96 ^ 0.04 19.61 ^ 0.03 22.34 ^ 0.12 22.46 ^ 0.11 19.71 ^ 0.03 21.49 ^ 0.08 22.00 ^ 0.07 21.49 ^ 0.08 [21.31 23.48 ^ 0.24 22.67 ^ 0.08 19.65 ^ 0.02 [22.55 19.87 ^ 0.03 21.75 ^ 0.04 20.47 ^ 0.03 [22.07 20.39 ^ 0.03 21.57 ^ 0.05 21.51 ^ 0.08 21.66 ^ 0.04 18.56 ^ 0.01 22.00 ^ 0.09 20.63 ^ 0.02 [22.77 21.95 ^ 0.07 23.44 ^ 0.39 21.89 ^ 0.13 21.41 ^ 0.05 22.46 ^ 0.14 20.49 ^ 0.04 21.92 ^ 0.08 23.41 ^ 0.09 22.94 ^ 0.07 21.32 ^ 0.06 [22.61 23.35 ^ 0.09
21.59 ^ 0.03 21.18 ^ 0.06 22.04 ^ 0.11 20.91 ^ 0.05 20.69 ^ 0.03 19.71 ^ 0.04 19.17 ^ 0.03 19.19 ^ 0.02 21.81 ^ 0.11 21.89 ^ 0.08 19.15 ^ 0.03 20.76 ^ 0.08 21.25 ^ 0.07 20.59 ^ 0.05 19.83 ^ 0.04 22.08 ^ 0.10 21.88 ^ 0.06 19.01 ^ 0.02 21.15 ^ 0.06 19.12 ^ 0.02 21.24 ^ 0.05 19.80 ^ 0.03 21.32 ^ 0.07 19.79 ^ 0.04 20.70 ^ 0.03 21.18 ^ 0.08 21.16 ^ 0.04 17.93 ^ 0.01 21.31 ^ 0.06 20.09 ^ 0.02 21.63 ^ 0.08 21.24 ^ 0.05 22.46 ^ 0.22 21.46 ^ 0.08 20.63 ^ 0.05 21.19 ^ 0.08 19.51 ^ 0.02 21.29 ^ 0.06 22.48 ^ 0.07 22.48 ^ 0.07 20.64 ^ 0.04 21.35 ^ 0.03 22.38 ^ 0.05
19.89 ^ 0.02 20.15 ^ 0.05 19.61 ^ 0.06 19.16 ^ 0.03 19.18 ^ 0.02 18.32 ^ 0.02 18.08 ^ 0.02 18.46 ^ 0.03 21.14 ^ 0.18 20.93 ^ 0.09 18.30 ^ 0.03 19.79 ^ 0.07 [20.89 19.19 ^ 0.03 18.12 ^ 0.02 20.17 ^ 0.03 20.75 ^ 0.09 18.03 ^ 0.02 19.31 ^ 0.02 18.11 ^ 0.03 [20.25 18.70 ^ 0.03 19.67 ^ 0.02 18.85 ^ 0.04 19.47 ^ 0.03 20.71 ^ 0.11 20.48 ^ 0.07 16.97 ^ 0.01 20.17 ^ 0.06 19.27 ^ 0.03 20.24 ^ 0.06 20.26 ^ 0.05 21.28 ^ 0.11 20.42 ^ 0.06 19.43 ^ 0.04 19.56 ^ 0.04 18.17 ^ 0.02 20.28 ^ 0.07 21.22 ^ 0.09 21.67 ^ 0.11 19.52 ^ 0.03 20.13 ^ 0.04 21.14 ^ 0.05
18.70 ^ 0.12 20.32 ^ 0.21 18.25 ^ 0.10 17.76 ^ 0.07 18.12 ^ 0.08 17.18 ^ 0.06 17.20 ^ 0.06 17.75 ^ 0.07 19.44 ^ 0.18 21.34 ^ 0.63 17.55 ^ 0.07 18.77 ^ 0.13 [20.62 17.91 ^ 0.10 16.99 ^ 0.05 19.07 ^ 0.15 18.79 ^ 0.14 17.18 ^ 0.06 18.35 ^ 0.09 17.68 ^ 0.08 19.75 ^ 0.21 17.52 ^ 0.07 18.70 ^ 0.11 17.98 ^ 0.09 18.83 ^ 0.12 19.70 ^ 0.21 20.51 ^ 0.27 16.15 ^ 0.03 19.14 ^ 0.14 18.65 ^ 0.12 19.57 ^ 0.18 19.80 ^ 0.22 20.58 ^ 0.29 21.14 ^ 1.10 19.17 ^ 0.15 18.29 ^ 0.10 17.25 ^ 0.06 19.03 ^ 0.15 22.05 ^ 0.75 20.55 ^ 0.28 18.47 ^ 0.10 19.32 ^ 0.15 19.49 ^ 0.23
18.14 ^ 0.12 [19.42 [17.64 17.11 ^ 0.07 17.70 ^ 0.08 16.65 ^ 0.05 16.75 ^ 0.05 17.42 ^ 0.08 [18.73 [19.87 17.24 ^ 0.08 17.92 ^ 0.11 [19.75 17.29 ^ 0.09 16.50 ^ 0.05 18.17 ^ 0.13 [17.83 16.59 ^ 0.05 [17.80 17.36 ^ 0.09 18.76 ^ 0.17 16.82 ^ 0.07 18.26 ^ 0.12 17.33 ^ 0.08 18.46 ^ 0.13 [18.35 [20.11 15.72 ^ 0.03 18.42 ^ 0.12 18.19 ^ 0.11 19.18 ^ 0.19 19.63 ^ 0.28 20.79 ^ 0.55 21.32 ^ 2.04 19.05 ^ 0.19 17.47 ^ 0.08 16.88 ^ 0.06 18.44 ^ 0.14 [19.17 20.16 ^ 0.30 17.78 ^ 0.09 18.70 ^ 0.13 20.34 ^ 0.25
Notes
b
b
b b
a O†sets with respect to coordinates : R.A. \ 09 56 00.0, decl. \ 69 41 00.0. b Source identiÐcations marginal.
ters. Therefore, we visually inspected all candidates with V ¹ 22.5, i.e., slightly brighter than the 50% completeness limits, for contrast, deÐnition, aperture centering, and background sampling. We rejected candidates that were too di†use or that might be the e†ects of background Ñuctuations. Many sources contained multiple components, and the apertures were adjusted to include all of these. We also visually inspected the two-dimensional Gaussian Ðts to those sources that were assigned p º 2 pixels in the initial automated Ðtting pass. If needed,G apertures for our Ðnal photometric pass (and thus the source magnitudes), center coordinates, selection criteria for inclusion into the Ðnal source lists, and p Ïs were adjusted. G Thus, our primary cluster candidate samples consist of well-deÐned sources with p º 1.25 pixels, V ¹ 22.5 mag, G and relatively smooth backgrounds. These samples contain
43 and 70 cluster candidates in B1 and B2, respectively. Their positions, sizes, and brightnesses are tabulated in, respectively, Tables 2 and 3. The corresponding apparent V -band brightness distribution for the cluster sample (without extinction corrections) is shown in Figure 9. Upper limits in any passband were obtained by taking the brightest Ñux measurement in a Ðve-by-Ðve position grid (within 25 ] 25 pixels, or 1A. 14 ] 1A. 14). Figure 10 shows our selection criteria in the V -p plane, where we have plotted all of the source candidatesGregardless of quality, brightness, or size. The horizontal plume of sources at small sizes and faint magnitudes represents the background of stars in the galaxy. The brightest unresolved sources are detected at V D 21È22 (M D [6). This is consistent with the expected brightness Vof luminosity class I supergiants in M82 before extinction corrections (e.g.,
TABLE 3 OBSERVED PROPERTIES OF THE CLUSTER SAMPLE IN M82 B2
No.
* R.A.a (sec)
*Decl.a (arcsec)
p G (arcsec)
B (mag)
V (mag)
I (mag)
J (mag)
H (mag)
1 ....... 2 ....... 3 ....... 4 ....... 5 ....... 6 ....... 7 ....... 8 ....... 9 ....... 10 . . . . . . 11 . . . . . . 12 . . . . . . 13 . . . . . . 14 . . . . . . 15 . . . . . . 16 . . . . . . 17 . . . . . . 18 . . . . . . 19 . . . . . . 20 . . . . . . 21 . . . . . . 22 . . . . . . 23 . . . . . . 24 . . . . . . 25 . . . . . . 26 . . . . . . 27 . . . . . . 28 . . . . . . 29 . . . . . . 30 . . . . . . 31 . . . . . . 32 . . . . . . 33 . . . . . . 34 . . . . . . 35 . . . . . . 36 . . . . . . 37 . . . . . . 38 . . . . . . 39 . . . . . . 40 . . . . . . 41 . . . . . . 42 . . . . . . 43 . . . . . . 44 . . . . . . 45 . . . . . . 46 . . . . . . 47 . . . . . . 48 . . . . . . 49 . . . . . . 50 . . . . . . 51 . . . . . . 52 . . . . . . 53 . . . . . . 54 . . . . . . 55 . . . . . . 56 . . . . . . 57 . . . . . . 58 . . . . . . 59 . . . . . . 60 . . . . . . 61 . . . . . . 62 . . . . . . 63 . . . . . . 64 . . . . . .
58.35 54.76 59.18 54.78 55.98 59.20 55.76 56.08 56.36 55.92 56.19 54.54 53.44 56.37 57.14 55.85 55.25 57.15 56.55 54.34 57.45 56.62 57.90 57.01 56.06 55.59 56.94 58.09 55.11 55.55 58.14 58.71 58.06 55.30 57.88 54.01 57.69 55.14 58.01 55.43 56.98 59.80 55.92 56.22 58.20 54.88 56.65 54.70 58.35 57.92 60.41 57.88 58.86 58.06 55.58 60.05 60.42 60.35 60.26 58.50 59.83 58.77 57.83 55.66
47.94 55.37 49.03 57.31 56.89 51.77 58.66 58.16 57.82 58.72 58.33 61.69 63.70 58.45 57.65 60.16 61.31 58.30 60.17 65.94 60.53 62.28 59.97 62.20 64.02 65.91 63.62 62.27 67.74 66.99 62.52 61.61 62.92 68.13 63.63 71.07 64.55 69.71 65.15 69.94 67.39 62.46 70.09 69.60 67.38 73.60 70.80 74.99 68.76 70.35 67.54 72.53 70.80 72.79 77.50 70.62 70.80 70.94 71.73 76.27 74.32 77.33 79.12 84.39
0.15 0.09 0.11 0.16 0.24 0.22 0.15 0.10 0.08 0.07 0.08 0.10 0.13 0.14 0.15 0.10 0.24 0.08 0.14 0.09 0.09 0.07 0.08 0.11 0.17 0.13 0.06 0.08 0.15 0.13 0.08 0.07 0.07 0.10 0.09 0.19 0.13 0.14 0.07 0.13 0.11 0.18 0.10 0.15 0.09 0.08 0.10 0.14 0.11 0.09 0.08 0.15 0.10 0.13 0.11 0.12 0.16 0.15 0.07 0.17 0.13 0.09 0.17 0.08
23.07 ^ 0.17 [22.32 [23.01 21.01 ^ 0.02 20.41 ^ 0.04 [23.12 21.73 ^ 0.07 23.69 ^ 0.11 22.80 ^ 0.10 [23.23 [23.48 19.04 ^ 0.02 21.96 ^ 0.05 23.77 ^ 0.18 22.35 ^ 0.05 [23.44 21.88 ^ 0.07 23.52 ^ 0.15 [23.22 [22.88 22.55 ^ 0.07 23.64 ^ 0.16 23.62 ^ 0.23 [22.27 20.97 ^ 0.06 19.11 ^ 0.01 22.77 ^ 0.15 22.43 ^ 0.11 22.82 ^ 0.10 21.77 ^ 0.07 22.07 ^ 0.08 22.65 ^ 0.09 23.19 ^ 0.17 23.04 ^ 0.07 [22.86 20.45 ^ 0.02 20.55 ^ 0.06 21.11 ^ 0.04 21.69 ^ 0.18 19.70 ^ 0.01 19.39 ^ 0.02 23.39 ^ 0.28 21.35 ^ 0.03 21.38 ^ 0.05 22.85 ^ 0.10 22.30 ^ 0.05 22.75 ^ 0.07 22.39 ^ 0.05 20.97 ^ 0.05 22.09 ^ 0.09 22.66 ^ 0.11 21.58 ^ 0.06 21.18 ^ 0.05 21.24 ^ 0.04 22.57 ^ 0.06 21.52 ^ 0.09 21.61 ^ 0.08 [21.15 23.19 ^ 0.14 22.15 ^ 0.06 22.45 ^ 0.06 22.88 ^ 0.07 21.47 ^ 0.03 23.14 ^ 0.07
22.01 ^ 0.09 20.23 ^ 0.03 21.37 ^ 0.03 20.12 ^ 0.02 19.77 ^ 0.05 21.33 ^ 0.05 20.58 ^ 0.06 22.00 ^ 0.06 22.31 ^ 0.20 22.10 ^ 0.04 22.46 ^ 0.11 17.90 ^ 0.01 20.84 ^ 0.03 22.45 ^ 0.04 20.79 ^ 0.03 22.32 ^ 0.06 20.76 ^ 0.06 22.17 ^ 0.10 20.68 ^ 0.04 21.52 ^ 0.04 21.30 ^ 0.06 22.42 ^ 0.08 22.46 ^ 0.21 21.24 ^ 0.08 20.32 ^ 0.07 18.57 ^ 0.01 22.44 ^ 0.28 21.78 ^ 0.10 22.31 ^ 0.07 20.87 ^ 0.04 21.50 ^ 0.09 21.48 ^ 0.04 22.47 ^ 0.16 22.48 ^ 0.05 22.04 ^ 0.15 19.72 ^ 0.01 19.81 ^ 0.03 20.66 ^ 0.04 21.23 ^ 0.17 19.31 ^ 0.01 18.56 ^ 0.02 21.48 ^ 0.10 20.91 ^ 0.02 20.91 ^ 0.04 21.68 ^ 0.05 22.17 ^ 0.04 21.99 ^ 0.05 21.84 ^ 0.05 19.96 ^ 0.04 21.46 ^ 0.08 22.17 ^ 0.11 20.93 ^ 0.05 20.38 ^ 0.04 20.91 ^ 0.05 22.15 ^ 0.04 20.77 ^ 0.07 20.59 ^ 0.05 19.81 ^ 0.04 22.15 ^ 0.10 21.56 ^ 0.06 21.97 ^ 0.06 22.30 ^ 0.05 20.93 ^ 0.02 22.36 ^ 0.04
20.86 ^ 0.09 17.21 ^ 0.01 19.08 ^ 0.02 18.89 ^ 0.04 18.61 ^ 0.10 19.48 ^ 0.03 18.84 ^ 0.06 19.44 ^ 0.04 20.53 ^ 0.14 20.33 ^ 0.09 20.50 ^ 0.09 16.40 ^ 0.01 19.38 ^ 0.03 20.58 ^ 0.10 18.38 ^ 0.03 19.71 ^ 0.03 19.22 ^ 0.05 19.58 ^ 0.07 17.80 ^ 0.02 19.80 ^ 0.03 18.73 ^ 0.04 20.91 ^ 0.10 20.76 ^ 0.19 19.41 ^ 0.04 19.17 ^ 0.07 17.68 ^ 0.01 21.20 ^ 0.24 20.29 ^ 0.08 21.33 ^ 0.11 19.43 ^ 0.03 20.46 ^ 0.10 19.78 ^ 0.03 21.29 ^ 0.18 21.40 ^ 0.07 20.38 ^ 0.10 18.82 ^ 0.02 18.15 ^ 0.04 20.09 ^ 0.06 20.66 ^ 0.22 18.56 ^ 0.02 17.38 ^ 0.02 [19.18 20.34 ^ 0.05 20.09 ^ 0.05 19.95 ^ 0.03 [21.55 21.06 ^ 0.06 20.83 ^ 0.05 18.65 ^ 0.04 20.12 ^ 0.05 21.64 ^ 0.20 20.16 ^ 0.07 19.60 ^ 0.04 20.34 ^ 0.08 21.64 ^ 0.07 19.81 ^ 0.08 19.15 ^ 0.03 18.14 ^ 0.02 20.27 ^ 0.04 20.58 ^ 0.05 [21.13 21.54 ^ 0.07 20.00 ^ 0.04 21.42 ^ 0.06
19.59 ^ 0.16 14.75 ^ 0.02 ... 16.93 ^ 0.07 18.15 ^ 0.22 14.43 ^ 0.01 [18.40 17.84 ^ 0.08 20.32 ^ 0.31 18.91 ^ 0.16 19.26 ^ 0.17 15.17 ^ 0.03 18.41 ^ 0.10 18.30 ^ 0.14 16.88 ^ 0.07 17.90 ^ 0.09 18.20 ^ 0.10 18.32 ^ 0.15 15.57 ^ 0.03 18.84 ^ 0.12 16.55 ^ 0.05 20.85 ^ 0.32 19.54 ^ 0.24 18.14 ^ 0.09 18.10 ^ 0.10 16.96 ^ 0.05 19.94 ^ 0.25 19.40 ^ 0.22 21.10 ^ 0.43 18.50 ^ 0.12 20.12 ^ 0.21 18.63 ^ 0.11 19.57 ^ 0.21 20.31 ^ 0.25 19.02 ^ 0.15 17.99 ^ 0.08 16.72 ^ 0.05 19.55 ^ 0.19 19.58 ^ 0.23 17.88 ^ 0.08 16.19 ^ 0.04 17.98 ^ 0.09 20.45 ^ 0.26 20.38 ^ 0.23 19.27 ^ 0.15 [19.97 20.92 ^ 0.27 20.04 ^ 0.22 17.66 ^ 0.08 19.14 ^ 0.15 [20.12 19.99 ^ 0.22 19.08 ^ 0.15 19.73 ^ 0.20 20.61 ^ 0.32 18.69 ^ 0.13 17.49 ^ 0.06 17.13 ^ 0.06 19.33 ^ 0.17 20.00 ^ 0.21 20.79 ^ 0.30 21.10 ^ 0.32 19.24 ^ 0.15 20.87 ^ 0.35
19.53 ^ 0.20 [13.74 ... [15.76 17.98 ^ 0.37 [17.39 [19.04 [17.21 [17.70 18.36 ^ 0.21 18.69 ^ 0.17 14.58 ^ 0.03 18.00 ^ 0.09 [16.76 16.08 ^ 0.06 [17.11 17.56 ^ 0.09 [17.30 [14.59 18.50 ^ 0.12 [15.59 [19.01 18.84 ^ 0.21 17.63 ^ 0.09 17.39 ^ 0.08 16.55 ^ 0.05 19.21 ^ 0.20 18.74 ^ 0.19 20.46 ^ 0.44 18.05 ^ 0.13 [18.58 18.24 ^ 0.12 [18.32 19.67 ^ 0.24 18.28 ^ 0.13 17.52 ^ 0.08 16.12 ^ 0.05 18.86 ^ 0.17 [18.07 17.45 ^ 0.08 15.88 ^ 0.04 [17.01 [18.74 [18.36 18.75 ^ 0.15 [19.43 [20.97 19.38 ^ 0.20 17.40 ^ 0.07 18.61 ^ 0.14 [19.28 20.09 ^ 0.38 18.52 ^ 0.15 19.37 ^ 0.22 [19.58 17.86 ^ 0.12 17.07 ^ 0.06 16.67 ^ 0.06 18.78 ^ 0.16 19.35 ^ 0.20 20.62 ^ 0.43 21.06 ^ 0.38 18.89 ^ 0.16 19.90 ^ 0.27
Notes
b
b b
b
b b b
b b
b b
b
b
b
b b
780
DE GRIJS, OÏCONNELL, & GALLAGHER
Vol. 121
TABLE 3ÈContinued
No.
* R.A.a (sec)
*Decl.a (arcsec)
p G (arcsec)
B (mag)
V (mag)
I (mag)
J (mag)
H (mag)
65 . . . . . . 66 . . . . . . 67 . . . . . . 68 . . . . . . 69 . . . . . . 70 . . . . . .
60.11 60.01 57.72 59.95 55.50 58.21
76.41 76.87 82.21 78.41 87.07 83.36
0.16 0.08 0.23 0.13 0.09 0.11
21.57 ^ 0.05 23.18 ^ 0.08 21.56 ^ 0.04 22.43 ^ 0.08 22.76 ^ 0.06 20.40 ^ 0.01
20.70 ^ 0.03 22.66 ^ 0.10 20.64 ^ 0.02 21.63 ^ 0.05 22.19 ^ 0.04 19.93 ^ 0.01
19.46 ^ 0.03 21.89 ^ 0.09 19.21 ^ 0.02 20.56 ^ 0.04 21.49 ^ 0.07 19.20 ^ 0.02
19.04 ^ 0.14 20.77 ^ 0.31 18.06 ^ 0.09 19.58 ^ 0.18 20.71 ^ 0.29 18.91 ^ 0.12
18.72 ^ 0.17 19.94 ^ 0.26 17.38 ^ 0.08 19.03 ^ 0.17 20.23 ^ 0.29 [18.09
Notes
a O†sets with respect to coordinates : R.A. \ 09 55 00.0, decl. \ 69 40 00.0. b Source identiÐcations marginal.
Humphreys & McElroy 1984). Few of the sources in the primary cluster candidate lists are likely to be stars. 6.
THE STELLAR BACKGROUND IN THE DISK OF M82
As is evident from Figure 10 or a close examination of the original images, the galactic background of the M82 B regions is predominantly composed of faint point sources, and these become increasingly dominant at longer (near-IR) wavelengths. Although Sakai & Madore (1999) detected individual giants in the halo of M82, this is the Ðrst resolution of its disk into stars.
In order to only select well-deÐned, real point sources from our near-IR images, we required them to have matching detections in the I, J, and H bands. Total magnitudes were determined from aperture photometry, using aperture radii corresponding to 3 PC pixels ; background levels were measured in annuli with radii between 5 and 8 pixels. Aperture corrections, based on synthetic HST PSFs, were applied. The near-IR brightness histograms of these faint point sources, which are characterized by p B 0.9È1.0 pixels (D0A. 040), peak around J B 21 and H B G20 mag. Figure 11
FIG. 11.È(a) and (b) : Near-IR color-magnitude diagrams for the stellar background in the disk of M82. The thick lines represent theoretical isochrones for ages t(yr) \ 10, 30, and 100 Myr (top to bottom ; Girardi et al. 2000 ; Salasnich et al. 2000). Typical photometric uncertainties and the direction of the reddening vector are indicated. The dotted lines represent observational selection limits ; the dashed lines indicate the envelope of the regions occupied by the theoretical isochrones between 10 and 30 Myr. For comparison, we have also included K and M supergiants in the LMC (open circles ; Oestreicher et al. 1997). (c) and (d) : Theoretical isochrones for ages t(yr) \ 10 and 30 Myr, as in (a) and (b). The symbol sizes are proportional to the predicted number of stars as described in the text.
No. 2, 2001
FOSSIL STARBURST IN M82
shows the corresponding color-absolute magnitude diagrams for the (I?J?H) cross-correlated point sources with the highest-quality photometry (photometric uncertainty d(J[H) ¹ 0.15 mag). Sources in B1 and B2 are combined in the plots ; no extinction corrections are made. Overplotted in Figure 11 are solar-metallicity stellar isochrones from the Padua library corresponding to ages of 10, 30, and 100 Myr, with initial stellar masses ranging from 0.15 to D20, 9, and 5 M , respectively (Girardi et al. 2000 ; _ Salasnich et al. 2000). In Figures 11c and 11d, we plot the two youngest isochrones (10 and 30 Myr) on the same scale as in Figures 11a and 11b but use symbols whose sizes are proportional to the predicted number of stars at each point, derived from the cumulative mass functions tabulated with the isochrones. For comparison, we have added to the plots photometry for the late-type K and M supergiant candidates in the Large Magellanic Cloud compiled from earlier studies by Oestreicher, Schmidt-Kaler, & Wargau (1997 ; open circles). These are clearly o†set from the bulk of the M82 disk stars. The LMC supergiants are well modeled by massive stars with ages of order 10 Myr. The population in the M82 disk is evidently older. The isochrones indicate that the brightest M82 giants are core helium-burning stars with ages D20È30 Myr. SigniÐcant star formation has not occurred in region B in the last 10È15 Myr. The age estimates would not change signiÐcantly for metal abundances of 0.4È1.2 Z , _ the likely range for M82. Although the J and H bands are not very sensitive to dust (see the A arrows in Fig. 11), the few data points scattered on the redV side of the isochrones are most likely produced by variable internal extinction within the disk of M82. This also explains the apparent lack of bluer starsÈredward of the dashed lines representing the envelopes of the regions occupied by the theoretical isochrones between 10 and 30 MyrÈwhich are most heavily a†ected by the high internal extinction in M82 B. Our magnitude cut-o† (dotted lines) prevents us from detecting the upper main sequence or giants older than about 80 Myr. An age for the youngest bright giants in region B of Z20 Myr is consistent with the age estimates of the youngest clusters in our cluster sample (see ° 7.1), although the peak of cluster formation was much earlier. Only 4.3% of the integrated J-band light in region B1 originates in the resolved population, meaning that the great majority of cool stars were formed at earlier times. We return to the question of the star formation history in the disk in ° 11. 7.
781
study of young star clusters since they include improved treatment of supergiant stars (Gallagher & Smith 1999), are roughly equivalent to BC96 for the colors used in this paper. Consequently, we have adopted the BC96 models. We use single-generation models with the Salpeter (1955) IMF and solar metallicity (Z ^ 0.02), unless otherwise _ indicated. Near-solar metallicity should be a reasonable match to the young objects in M82 (e.g., Gallagher & Smith 1999). Fritze-von Alvensleben & Gerhard (1994) also Ðnd from chemical evolution models that young clusters should have Z D 0.3È1.0 Z . _ 7.1. Age and Extinction Separation in the T wo-Color Diagram In Figure 12 we present a two-color diagram for the cluster samples in M82 B1 and B2. Overplotted with the thick lines are the colors for solar-metallicity BC96 singlegeneration models from 10 Myr to 20 Gyr. Reddening trajectories for selected models (ages of 10 Myr, 100 Myr, 1 Gyr, and 10 Gyr) are shown with thin lines for a foreground screen extinction geometry ; these are crossed by thin lines corresponding to A \ 1, 2, and 3 mag. V diagram are distinguished as a funcThe clusters in the tion of source brightness : the Ðlled circles represent sources with V ¹ 21.0, while the open circles are the remaining sources brighter than V \ 22.5. This includes objects for which we only have upper limits in one passband. For these sources, the length of the arrow indicates the measurement uncertainty resulting from the 5 ] 5 position grid sampling (° 5.1). In Figure 12 the observations fall, as they should, in the ““ allowed ÏÏ part of the plot, near or above the locus of unextincted, single-generation populations. The few sources below the envelope are consistent with the photometric errors. The larger scatter and slightly redder colors in
EXTINCTIONS AND AGES FOR INDIVIDUAL CLUSTERS
To examine the cluster luminosity function and the history of cluster formation, we need reliable estimates for extinction within M82. It is obvious from the dust lanes and color contrasts within region B (see ° 3) that we cannot simply adopt a mean value for the internal extinction. Instead, we need to estimate the extinction for each cluster individually. Fortunately, our multicolor imagery permits a simultaneous estimate of cluster extinctions and ages through comparisons to the colors of single-generation stellar populations predicted by theoretical evolutionary spectral synthesis models. The set of such models most commonly used was developed by BC96 and references therein). We Ðnd that the more recently developed PEGASE models (Fioc & RoccaVolmerange 1997), which ought to be better suited for the
FIG. 12.ÈOptical color-color diagrams for the M82 B1 and B2 cluster samples. Solid dots : V ¹ 21.0 ; open circles : 21.0 \ V ¹ 22.5. The heavy solid lines are the locations of unextincted, single-generation models of di†erent ages by BC96. The thin lines indicate the e†ects of reddening on these models.
782
DE GRIJS, OÏCONNELL, & GALLAGHER
region B2 imply that the sources in B2 are, on average, more a†ected by extinction than those in B1. The model grid shows that a BV I diagram is well suited to disentangle the e†ects of age and extinction. We explored the use of a similar V IH two-color diagram. Unfortunately, the aging and extinction trajectories are nearly parallel here, and it is much less useful for age/extinction separation. The BC96 models, the PEGASE models, and the Starburst99 models (Leitherer & Heckman 1995 ; Leitherer et al. 1999) all give similar results in the V IH plane. We can use the location of each cluster in Figure 12 to estimate its age and extinction, assuming solar metallicity. The e†ects of varying the metallicity from 0.2 Z to 2.5 Z _ colors, so _ for the BC96 models are [0.1 mag in each of our di†erences in metallicity will not strongly a†ect the derived age distribution. Our best age and extinction estimates for each cluster, as well as the extinction-corrected colors and absolute V -band
magnitudes, are listed in Tables 4 and 5 for B1 and B2, respectively. Typical estimated errors in the ages are ^40%. Our treatment ignores the e†ects of any extinction internal to the clusters themselves. 7.2. Color Comparison with Other Cluster Systems In Figure 13 we show the (B[V ) and (V [I) color 0 0 histograms of our cluster candidates, corrected for internal extinction on a cluster-by-cluster basis (° 7.1). We also show the corresponding color distributions of comparison samples of SSC systems based on HST photometry. These are corrected for foreground (Galactic) extinction but not for extinction within the parent galaxy. In Table 6 we have collected the characteristics of the color distributions of these cluster samples, including their estimated ages. It is immediately clear that the M82 B color distributions are redder than those of the comparison systems. Since the latter reside in regions with high and nonuniform dust
TABLE 4 DERIVED PROPERTIES OF THE CLUSTER SAMPLE IN M82 B1
No.
A V (mag)
M0 V (mag)
(B[V ) 0 (mag)
(V [I) 0 (mag)
(V [H) 0 (mag)
(J[H) 0 (mag)
log (Age) (yr)
1 ....... 2 ....... 3 ....... 4 ....... 5 ....... 6 ....... 7 ....... 8 ....... 9 ....... 10 . . . . . . 11 . . . . . . 12 . . . . . . 13 . . . . . . 14 . . . . . . 15 . . . . . . 16 . . . . . . 17 . . . . . . 18 . . . . . . 19 . . . . . . 20 . . . . . . 21 . . . . . . 22 . . . . . . 23 . . . . . . 24 . . . . . . 25 . . . . . . 26 . . . . . . 27 . . . . . . 28 . . . . . . 29 . . . . . . 30 . . . . . . 31 . . . . . . 32 . . . . . . 33 . . . . . . 34 . . . . . . 35 . . . . . . 36 . . . . . . 37 . . . . . . 38 . . . . . . 39 . . . . . . 40 . . . . . . 41 . . . . . . 42 . . . . . . 43 . . . . . .
0.95 0.11 ... 1.81 0.56 1.37 0.38 0.28 0.00 0.56 0.27 0.18 ... 1.06 ... 1.23 0.53 0.46 ... 0.21 0.79 0.76 2.15 0.40 0.51 0.00 0.00 0.39 0.76 0.26 0.30 0.30 0.15 1.10 0.74 0.73 0.57 0.51 0.46 0.40 0.75 ... 0.33
[7.16 [6.73 \[5.76 [8.70 [7.67 [9.46 [9.01 [8.89 [5.99 [6.47 [8.92 [7.22 \[6.55 [8.27 \[7.97 [6.95 [6.45 [9.25 \[6.65 [8.89 [7.35 [8.76 [8.63 [8.41 [7.61 [6.62 [6.64 [10.26 [7.25 [7.97 [6.47 [6.86 [5.49 [7.44 [7.91 [7.34 [8.86 [7.02 [5.78 [5.72 [7.91 \[6.45 [5.75
0.96 0.77 ... 0.41 1.03 0.32 0.67 0.33 0.53 0.39 0.47 0.67 \0.75 0.56 ... 1.00 0.62 0.49 ... 0.68 0.25 0.42 [0.05 0.47 0.70 0.33 0.50 0.50 0.44 0.46 [1.04 0.61 0.93 0.07 0.54 1.03 0.80 0.46 0.78 0.33 0.44 ... 0.86
1.21 0.97 \2.43 0.81 1.22 0.68 0.89 0.58 0.67 0.67 0.71 0.88 \0.36 0.85 \1.71 1.27 0.86 0.74 \1.84 0.90 \0.58 0.71 0.54 0.73 0.97 0.47 0.68 0.76 0.75 0.69 1.23 0.82 1.10 0.47 0.82 1.25 1.04 0.75 1.02 0.60 0.73 \1.22 1.07
2.67 \1.67 \4.40 2.31 2.53 1.93 2.11 1.54 \3.08 \1.56 1.69 2.69 \1.50 2.43 \3.33 2.90 \3.61 2.04 \3.35 1.59 1.83 2.35 1.29 2.13 1.82 \2.83 \1.05 1.89 2.26 1.69 2.20 1.36 1.55 [0.77 0.97 3.12 2.16 2.43 \2.93 1.99 2.24 \2.65 1.77
0.46 \0.89 \0.61 0.46 0.36 0.38 0.41 0.30 \0.71 \1.41 0.28 0.83 ... 0.51 \0.49 0.77 \0.90 0.54 \0.55 0.30 0.91 0.62 0.21 0.61 0.32 \1.35 \0.40 0.39 0.64 0.43 0.36 0.14 [0.23 [0.30 0.04 0.74 0.31 0.54 \2.83 0.35 0.61 \0.62 [0.89
10.2 9.3 ... 8.8 10.1 8.7 9.0 8.7 8.9 8.8 8.8 9.0 \9.2 8.9 ... 10.0 9.0 8.9 ... 9.1 8.5 8.8 8.7 8.8 9.1 8.7 8.9 8.9 8.8 8.8 10.3 9.0 9.8 7.6 8.9 10.1 9.3 8.8 9.3 8.7 8.8 \10.3 9.7
TABLE 5 DERIVED PROPERTIES OF THE CLUSTER SAMPLE IN M82 B2
No.
A V (mag)
M0 V (mag)
(B[V ) 0 (mag)
(V [I) 0 (mag)
(V [H) 0 (mag)
(J[H) 0 (mag)
log (Age) (yr)
1 ....... 2 ....... 3 ....... 4 ....... 5 ....... 6 ....... 7 ....... 8 ....... 9 ....... 10 . . . . . . 11 . . . . . . 12 . . . . . . 13 . . . . . . 14 . . . . . . 15 . . . . . . 16 . . . . . . 17 . . . . . . 18 . . . . . . 19 . . . . . . 20 . . . . . . 21 . . . . . . 22 . . . . . . 23 . . . . . . 24 . . . . . . 25 . . . . . . 26 . . . . . . 27 . . . . . . 28 . . . . . . 29 . . . . . . 30 . . . . . . 31 . . . . . . 32 . . . . . . 33 . . . . . . 34 . . . . . . 35 . . . . . . 36 . . . . . . 37 . . . . . . 38 . . . . . . 39 . . . . . . 40 . . . . . . 41 . . . . . . 42 . . . . . . 43 . . . . . . 44 . . . . . . 45 . . . . . . 46 . . . . . . 47 . . . . . . 48 . . . . . . 49 . . . . . . 50 . . . . . . 51 . . . . . . 52 . . . . . . 53 . . . . . . 54 . . . . . . 55 . . . . . . 56 . . . . . . 57 . . . . . . 58 . . . . . . 59 . . . . . . 60 . . . . . . 61 . . . . . . 62 . . . . . . 63 . . . . . . 64 . . . . . .
0.00 ... ... 0.46 0.99 ... 1.34 2.39 ... 1.49 2.38 0.69 0.58 1.33 0.58 3.40 0.81 3.18 ... ... 3.49 0.48 1.22 1.87 0.89 0.42 ... 1.85 0.78 1.14 0.75 1.16 0.75 0.89 1.91 0.00 2.14 0.00 0.00 0.39 0.62 ... 0.00 0.37 1.16 0.21 0.00 0.73 0.46 1.49 0.00 0.00 ... 0.00 0.00 0.00 0.81 ... 2.03 0.57 0.42 0.00 0.52 0.00
[5.79 \[7.57 \[6.43 [8.14 [9.02 \[6.47 [8.56 [8.19 \[5.49 [7.19 [7.72 [10.59 [7.54 [6.68 [7.59 [8.88 [7.85 [8.81 \[7.12 \[6.28 [9.99 [5.86 [6.56 [8.43 [8.37 [9.65 \[5.36 [7.87 [6.27 [8.07 [7.05 [7.48 [6.08 [6.21 [7.67 [8.08 [10.13 [7.14 [6.57 [8.88 [9.86 \[6.32 [6.89 [7.26 [7.28 [5.84 [5.81 [6.69 [8.30 [7.83 [5.63 [6.87 \[7.42 [6.89 [5.65 [7.03 [8.02 \[7.99 [7.68 [6.81 [6.25 [5.50 [7.39 [5.44
1.06 ... ... 0.74 0.32 ... 0.72 0.92 \0.49 [0.65 [0.25 0.92 0.93 0.89 1.37 [0.02 0.86 0.32 ... ... 0.12 1.06 0.76 [0.42 0.36 0.40 \0.33 0.05 0.26 0.53 0.33 0.79 0.48 0.27 [0.20 0.73 0.05 0.45 0.46 0.26 0.63 \1.91 0.44 0.35 0.79 0.06 0.76 0.31 0.86 0.15 0.49 0.65 \0.80 0.33 0.42 0.75 0.76 ... 0.38 0.41 0.34 0.58 0.37 0.78
1.15 \3.02 \2.29 0.99 0.65 \1.85 1.05 1.32 \1.78 1.00 0.73 1.14 1.16 1.18 2.11 0.85 1.12 0.94 \2.88 \1.72 0.76 1.26 1.07 0.86 0.69 0.67 \1.24 0.53 0.58 0.85 0.65 1.10 0.79 0.62 0.67 0.90 0.55 0.57 0.57 0.55 0.86 \2.30 0.57 0.63 1.13 \0.51 0.93 0.63 1.07 0.57 0.53 0.77 \0.78 0.57 0.51 0.96 1.02 \1.67 0.83 0.68 \0.62 0.76 0.66 0.94
2.48 \6.49 ... \3.98 0.97 \3.94 \0.43 \2.82 \4.61 2.51 1.81 2.75 2.36 \4.59 4.23 \2.40 2.53 \2.25 \6.09 \3.02 \2.83 \3.01 2.61 2.07 2.20 1.67 \3.23 1.51 1.21 1.88 \2.30 2.28 \3.53 2.08 2.18 2.20 1.92 1.80 \3.16 1.54 2.17 \4.47 \2.17 \2.24 1.97 \2.57 \1.02 1.86 2.18 1.62 \2.89 0.84 \1.86 1.54 \2.57 2.91 2.85 \3.14 1.70 1.74 1.00 1.24 1.61 2.46
0.06 \1.01 ... \1.12 0.06 ... ... \0.37 \2.62 0.39 0.32 0.52 0.35 \1.40 0.74 \0.43 0.55 \0.68 \0.98 \0.34 \0.59 \1.79 0.57 0.31 0.61 0.37 \0.73 0.46 0.56 0.33 \1.46 0.27 \1.17 0.54 0.54 0.47 0.37 0.69 \1.51 0.39 0.24 \0.97 \1.71 \1.98 0.40 ... \[0.05 0.58 0.21 0.37 ... [0.10 \0.56 0.36 \1.03 0.83 0.33 \0.46 0.33 0.59 0.13 0.04 0.29 0.97
10.0 ... ... 9.3 8.7 ... 9.2 9.7 \8.8 9.4 8.9 9.7 9.8 10.1 ... 9.0 9.5 9.2 ... ... 8.9 10.3 9.7 9.0 8.7 8.8 \8.8 7.3 8.7 8.9 8.7 9.8 8.8 8.6 8.8 9.2 7.5 8.8 8.8 8.5 9.0 ... 8.8 8.7 9.9 7.5 9.3 8.7 9.5 8.3 8.6 9.0 \9.0 8.7 8.8 9.2 9.3 ... 8.8 8.8 8.7 9.0 8.8 9.3
784
DE GRIJS, OÏCONNELL, & GALLAGHER
Vol. 121
TABLE 5ÈContinued
No.
A V (mag)
M0 V (mag)
(B[V ) 0 (mag)
(V [I) 0 (mag)
(V [H) 0 (mag)
(J[H) 0 (mag)
log (Age) (yr)
65 . . . . . . 66 . . . . . . 67 . . . . . . 68 . . . . . . 69 . . . . . . 70 . . . . . .
0.62 ... 1.08 0.21 0.00 0.10
[7.72 \[5.14 [8.24 [6.38 [5.61 [7.97
0.67 \0.52 0.57 0.73 0.57 0.44
0.92 \0.77 0.87 0.96 0.70 0.68
1.47 \2.72 2.37 2.43 1.96 \1.76
0.25 \0.83 0.56 0.53 0.48 \0.81
9.0 \9.0 8.9 9.2 8.9 8.8
extinction in their parent galaxies (e.g., Whitmore et al. 1993 ; Whitmore & Schweizer 1995 ; Miller et al. 1997 ; Carlson et al. 1998), their intrinsic colors are likely even bluer. The M82 A cluster sample is corrected only for foreground Galactic reddening, and the extremely red colors are due to the very high extinction in the active starburst region (OÏConnell et al. 1995). The M82 B clusters are intrinsically both redder and (see ° 9) less luminous (because of fading with age) than those in
the ““ classic ÏÏ SSC systems. We were able to survey this system well only because of its proximity. This emphasizes the strong selection e†ects which operate, even with HST , for identiÐcation of clusters in more distant galaxies. 7.3. T he Cluster Formation History of M82 B In Figure 14 we show the age distributions for the clusters in regions B1 and B2. Both contain clusters with a wide range of ages, from D30 Myr to over 10 Gyr. The distribu-
FIG. 13.È(B[V ) and (V [I) color distributions of the candidate clusters in the M82 B regions and those of comparison samples of luminous young star cluster systems taken from the literature. Internal extinction corrections were applied to the individual M82 B sources ; the other color histograms were corrected only for foreground Galactic extinction (Burstein & Heiles 1984). (a) and ( f ), (b) and (g) : M82 B1 and B2, respectively (this work). The shaded histograms represent the samples with well-determined colors ; the open histograms contain sources for which only upper or lower limits could be obtained ; (c) and (i) NGC 1275 (Richer et al. 1993) ; (d) and (k) NGC 4038/39 (Whitmore et al. 1999) ; (open) young clusters (\30 Myr) ; (shaded) intermediate-age clusters (0.25È1.0 Gyr) ; (e) and (l) NGC 7252 (Miller et al. 1997) ; (h) M82 A (OÏConnell et al. 1995) ; ( j) NGC 3921 (Schweizer et al. 1996).
No. 2, 2001
FOSSIL STARBURST IN M82
785
TABLE 6 COLOR DISTRIBUTIONS OF THE CLUSTER CANDIDATES IN M82, THE GLOBULAR CLUSTER POPULATION IN THE MILKY WAY, AND YOUNG STAR CLUSTER POPULATIONS IN COMPARISON GALAXIES
Galaxy
Sample
M82 . . . . . . . . . . . . . . . .
B1
M82 . . . . . . . . . . . . . . . .
B2
Milky Way . . . . . . . . .
Total
LMC . . . . . . . . . . . . . . .
Total
NGC 1275 . . . . . . . . .
c
Colora
Mean (mag)
Dispersion p (mag)
(B[V ) 0.78 0.29 0 (V [I) 1.13 0.40 0 (B[V ) 0.87 0.45 0 (V [I) 1.33 0.62 0 Local, Well-studied Comparison Samples
Age range (Gyr, for Z ) _ 0.35È1.4
Referencesb
0.35È1.4
(B[V ) 0.71 0.12 12È14 0,c (V [I) 0.84 0.13 0,c (B[V ) 0.20 0.30 0.03È10 (mean D 0.3) 0 Young Star Cluster Populations Based on HST Photometry
R97, R98, vdB92 EF88
(B[V ) 0.03 0.32 [0.3 H92, R93 0 (V [I) 0.09 0.55 (mean D107yr) 0 NGC 3921 . . . . . . . . . p ¹ 0.25 (V [I) 0.69 0.08 [ 0.50 S96 V~I 0 Associations (V [I) 0.59 (median D 0.25) S96 0 NGC 4038/39 . . . . . . Young clusters (B[V ) 0.17 0.22 \0.030 W99 0 Young clusters (V [I) 0.38 0.30 \0.030 W99 0 Intermed. age clusters (B[V ) 0.30 0.27 0.25 È1.0 W99 0 Intermed. age clusters (V [I) 0.53 0.35 0.25È1.0 W99 0 NGC 7252 . . . . . . . . . V \ 24 (B[V ) 0.65 0.005È0.040 W93, M97 0 0,1 (V [I) 0.4 (mean D 0.034) W93, M97 0,1 (B[V ) 1.0 0.50È0.80 W93, M97 0,2 (V [I) 0.8 0.25 (mean \ 0.65) W93, M97 0,2 a Correction for foreground extinction is indicatd by the subscript ““ 0,ÏÏ internal extinction correction by the subscript ““ c.ÏÏ b This paper if no reference given. EF : Elson & Fall 1988 ; H92 : Holtzman et al. 1992 ; M98 : Miller et al. 1998 ; R93 : Richer et al. 1993 ; R97, R98 : Reid 1997, 1998 ; S96 : Schweizer et al. 1996 ; vdB92 : VandenBerg 1992 ; W93 : Whitmore et al. 1993 ; W99 : Whitmore et al. 1999. c Cross-correltated sources with those of Holtzman et al. 1992.
tions are statistically identical. In each case, about 22% of the clusters are older than 2 Gyr, with a Ñat distribution to over 10 Gyr. There is a strong peak of cluster formation at D600 Myr ago, but very few clusters are younger than 300 Myr. The full-width of the peak is D500 Myr, but this is
undoubtedly broadened by the various uncertainties entering the age-dating process. The selection bias is such that the truncation of cluster formation for t \ 200 Myr is better established than is the constant formation rate at t [ 2 Gyr. The photometry suggests steady, continuing cluster formation at a very modest rate at early times ([2 Gyr ago) followed by a concentrated formation episode lasting from 400È1000 Myr ago and a subsequent suppression of cluster formation. Region B has evidently not been a†ected by the more recent (\30 Myr) starburst episode now continuing in the central regions. It has long been supposed that tidal interactions among the nearby M81 group members are responsible for the unusual gas streamers in the group and the starburst in M82 (Gottesman & Weliachew 1977 ; Cottrell 1977 ; van der Hulst 1979 ; Yun 1992 ; Yun et al. 1994). The observed distribution of intragroup gas is consistent with a three-body model in which there was a perigalactic passage between M82 and M81 (at a distance of 21 kpc) 500 Myr ago (Brouillet et al. 1991). This independent dynamical estimate of the last M81/M82 passage is remarkably close to the peak of the cluster formation burst seen in our data. This suggests that cluster formation was induced in the disk of M82 by the last encounter with M81. The current starburst in the center of the galaxy is probably related to late infall of tidally disrupted debris from M82 itself (OM ; Yun et al. 1993). 8.
FIG. 14.ÈAge distribution of the star clusters in M82 B1 and B2. Shaded histogram : well-determined ages ; open histogram : upper or lower limits only ; see Tables 4 and 5.
ESTIMATED CLUSTER MASSES
We present the distribution of extinction-corrected absolute magnitudes of the M82 B cluster sample in panels a and
786
DE GRIJS, OÏCONNELL, & GALLAGHER
Vol. 121
FIG. 15.ÈCluster luminosity functions of the M82 B regions, compared with the Galactic globular cluster population and to recently published luminous young star cluster systems in other nearby galaxies, based on HST observations. The M82 CLFs have been corrected for internal extinction ; the other CLFs were corrected only for Galactic foreground extinction (Burstein & Heiles 1984). Extinction corrections toward Milky Way globular clusters were adopted from Harris (1996). Where available we have indicated the completeness limits by the dashed lines. If no independent distance estimate was available, distance moduli were calculated for H \ 50 km s~1 Mpc~1. (a) and (b) : M82 B1 and B2 (this paper ; only sources with V ¹ 22.5 and p º 1.25 pixels are included, the 0 G limits could be determined) ; shaded CLFs represent the samples with well-determined magnitudes ; the open histograms contain sources for which only lower (c) Milky Way globular clusters (Harris 1996) ; (d) M82 A (OÏConnell et al. 1995) ; (e) NGC 1275 (Carlson et al. 1998) ; ( f ) NGC 3597 (Holtzman et al. 1996) ; (g) NGC 3921 (Schweizer et al. 1996) ; (h) NGC 4038/39 (Whitmore et al. 1999) : open CLF : young clusters (\30 Myr) ; shaded CLF : intermediate-age clusters (0.25È1.0 Gyr) ; (i) and ( j) : NGC 7252 (Whitmore et al. 1993 ; Miller et al. 1997), inner (r \ 6A) and outer (r [ 6A) sample, respectively.
b of Figure 15. In Figure 16a we display the corresponding V -band intrinsic luminosity function for regions B1 and B2 combined. Using the age estimates derived in ° 7, we can now apply the age-dependent mass-to-light ratio predicted for a single burst stellar population by BC96 to derive estimated masses for our cluster sample. Our estimates assume a Salpeter (1955) initial mass function. The results are shown in Figure 16b. The masses of the young clusters in M82 B with V ¹ 22.5 mag are mostly in the range 104È106 M , with a median of 105 M . _ The high end of the M82 _cluster mass function overlaps with those estimated by similar techniques for young SSCs in other galaxies (e.g., Richer et al. 1993 ; Holtzman et al. 1996 ; Tacconi-Garman, Sternberg, & Eckart 1996 ; Watson et al. 1996 ; Carlson et al. 1998). Independent dynamical mass estimates are available only for a few of the most luminous SSCs, one of them M82 F, and are approximately
106 M (Ho & Filippenko 1996a, 1996b ; Smith & Gallagh_ Because of the proximity of M82, we have been er 2000). able to probe the young cluster population in M82 B to fainter absolute magnitudes, and thus lower masses, than has been possible before in other galaxies. Other SSC cluster samples are biased toward high masses by selection e†ects. The M82 cluster masses are comparable to the masses of Galactic globular clusters (e.g., Mandushev, Spassova, & Staneva 1991 ; Pryor & Meylan 1993), which are typically in the range 104È3 ] 106 M . If they survive to ages of Z10 Gyr, the M82 clusters will_have properties similar to those of disk population Galactic globulars. 9.
THE CLUSTER LUMINOSITY FUNCTION
The cluster luminosity function (CLF) is one of the most important diagnostics in the study of globular and SSC
No. 2, 2001
FOSSIL STARBURST IN M82
787
FIG. 16.È(a) Combined V -band CLF for M82 B1 and B2, in units of V -band solar luminosities and corrected for internal extinction. The 50% completeness limit is indicated by the vertical dashed line ; (b) M82 B cluster mass distribution ; (c) CLF for the M82 B cluster sample corrected individually to a Ðducial age of 50 Myr. All panels : shaded histogramsÈwell-determined source magnitudes ; open histogramsÈlower limits only.
populations. For the old globular cluster systems in, e.g., the Galaxy, M31, M87, and old elliptical galaxies, the CLF shape is well-established : it is roughly Gaussian,5 with the peak or turnover magnitude at M0 ^ [7.4 and a Gaussian FWHM of D3 mag (Harris 1991V ; Whitmore et al. 1995 ; Harris, Harris, & McLaughlin 1998). Harris (1996) has shown that this turnover magnitude depends only weakly on galaxy luminosity and type. The well-studied young star cluster population in the LMC, on the other hand, displays a power-law CLF of the form / (L )dL P LadL , where / (L )dL is the number youngstar clusters with luminosities young of young between L and L ]dL , with [2 [ a [ [1.5 (Elson & Fall 1985 ; a \ [1.5 ^ 0.2 ; Elmegreen & Efremov 1997 ; a º [2). HST observations have provided CLFs for young, compact cluster systems in more distant galaxies. Examples, including our M82 observations, are shown in Figure 15, where we include the CLF of the globular cluster system in our Galaxy for reference. Where available, we have indicated the completeness limits by dashed lines. Although incompleteness e†ects often preclude detection of a turnÈÈÈÈÈÈÈÈÈÈÈÈÈÈÈ 5 Note that Ðtting the CLF shape with a Gaussian distribution function has been chosen only for mathematical convenience ; any physical rationale for a Gaussian distribution is currently lacking (see also Harris et al. 1998).
over in the CLF at the expected magnitude (Whitmore & Schweizer 1995 ; NGC 4038/39 ; Schweizer et al. 1996 ; NGC 3921 ; Miller et al. 1997 ; NGC 7252), in galaxies for which deep HST observations are available (e.g., NGC 1275, Carlson et al. 1998 ; NGC 7252, Whitmore et al. 1 993) there is no strong evidence for an intrinsic turnover. The CLF shapes are consistent with power laws down to the completeness threshold (but see Miller et al. 1997). The striking di†erences between the power-law SSC distributions and the Gaussian distribution of the old Galactic globulars has recently attracted renewed theoretical attention. Globular cluster formation models suggest that the distribution of the initial cluster masses is closely approximated by a power law of the form dN(M)dM P MadM, where [2.0 [ a [ [1.5 (e.g., Harris & Pudritz 1994 ; McLaughlin & Pudritz 1996 ; Elmegreen & Efremov 1997). In fact, Elmegreen & Efremov (1997) and Harris & Pudritz (1994) argue that the initial mass distribution functions for, among others, young and old star clusters are universal, and independent of environment. Ostriker & Gnedin (1997) agreed and argued that the di†erences in shape between the inner and the outer globular cluster luminosity functions in our Galaxy, M31 and M87 are solely due to dynamical cluster evolution and not to intrinsically di†erent initial mass distributions. McLaughlin, Harris, & Hanes (1994) also concluded that any di†erences in the M87 luminosity
788
DE GRIJS, OÏCONNELL, & GALLAGHER
distribution as a function of radius could be accounted for by dynamical evolution of the globular cluster populations. Which processes will a†ect the CLFs such that they transform from a power-law shape to a Gaussian distribution ? It is generally assumed that the processes responsible for the depletion of, preferentially, low-luminosity, lowmass star clusters over time scales of a Hubble time are tidal interactions with the background gravitational Ðeld of the parent galaxy and evaporation of stars through two-body relaxation within clusters (e.g., Fall & Rees 1977, 1985 ; Elmegreen & Efremov 1997 ; Murali & Weinberg 1997a, 1997b, 1997c ; Ostriker & Gnedin 1997 ; Harris et al. 1998 ; and references therein). From the models of Gnedin & Ostriker (1997) and Elmegreen & Efremov (1997) it follows that any initial mass (or luminosity) distribution will shortly be transformed into peaked distributions. We now consider the M82 B CLF in this context. The combined CLF for M82 B1 and B2 is shown in Figure 16a in units of solar luminosity. Although the M82 B CLF exhibits a turnover at L0 ^ 4.92L , or M0 ^ [7.5, V,_ V incompleteness likely a†ectsVthis result. For the proper interpretation of the M82 B CLF, we need to correct the cluster luminosities for the large range in ages found in ° 7. Using the BC96 models, we have corrected the present-day luminosities of our clusters to those at a Ðducial age of 50 Myr, comparable to the ages of most young SSC populations in other galaxies (see Table 6). The results are shown in Figure 16c. The constant-age CLF for the bright clusters in M82 B (M0[50] [ [9.75) follows a power law with a slope of V [1.2. We have plotted the power law shapes for about slopes of a \ [1.2,[1.5, and [2 for reference in Figure 16c. The formal uncertainty in our best-Ðtting power law solution (*a ^ 0.3) is such that an a \ [1.5 shape cannot be ruled out at the 1 p level, while an a \ [2 power law is highly unlikely. The bright cluster, constant-age CLF in M82 is therefore consistent with the power-law shapes of other young star CLFs. The overall constant-age CLF for M82 B is, however, broader and Ñatter than typical of the younger cluster systems seen in Figure 15. It more closely resembles what is expected for a cluster system which has begun to undergo signiÐcant dynamical evolution. It would not be surprising if the depletion of low-mass clusters in M82 was well underway. Region B has a high density and has been subject to the dynamical disturbances associated with the tidal interaction with M81. Figure 15 is, however, subject to strong selection e†ects whose modeling is beyond the scope of this paper. 10.
CLUSTER STRUCTURES
Because of M82Ïs proximity, we can study the structure of its compact clusters better than is possible for other SSC systems. Estimates of star cluster sizes are heavily dependent on the radial brightness distribution assumed (e.g., Holtzman et al. 1996). Several functions have been used to obtain size estimates, the simplest of them being a twodimensional Gaussian, which is characterized by R \ core a R \ FWHM. Even though mathematically convenient, eff Gaussian proÐle may not be the best representation of the radial luminosity proÐles of star clusters, since they may have more extended wings than Gaussian distributions, thus causing an underestimate the true half-light radii (see also Holtzman et al. 1996).
Our cluster sample was deÐned (° 5.4) to have p [ 1.25 G pixels, measured in the V band. Most of the sample falls in the range 1.25 ¹ p [ 5.5 pixels (Fig. 8), or 2.34 ¹ R [ G eff 10 pc, with a wing extending to larger sizes. Keeping in mind that, due to our size selection limit, we are only probing the more extended star clusters, these sizes are consistent with those obtained from HST imaging for other (more distant) young star cluster systems (e.g., OÏConnell et al. 1994 ; Barth et al. 1995 ; Holtzman et al. 1996 ; Schweizer et al. 1996 ; Miller et al. 1997 ; Whitmore et al. 1999) and with the Galactic globular clusters (van den Bergh, Morbey, & Pazder 1991 ; Djorgovski 1993 ; van den Bergh 1995). Given their sizes and ages, which amount to many dynamical crossing times (of typically a few Myr ; see Schweizer et al. 1996) for their estimated masses, the M82 clusters are predominantly gravitationally bound. Alternatively, one can Ðt more complex models that are better representations of the true stellar light distribution in compact clusters. The most general of these is the mathematically convenient function of surface brightness k(r) as a function of radius r, proposed by Elson, Fall, & Freeman (1987) :
C A BD
r 2 ~c@2 k(r) \ k 1 ] . (6) 0 R core Equation (6) reduces to a modiÐed Hubble law for c \ 2, which is a good approximation to the canonical King model for globular clusters (King 1966). Elson et al. (1987) found, for 10 rich star clusters in the LMC, that 2.2 [ c [ 3.2, with a median c \ 2.6. Most of these clusters do not seem to be tidally truncated, although cluster radial proÐles are often modeled as truncated modiÐed Hubble laws, with the truncation occurring at D10È1000 R (e.g., Holtzman core et al. 1996 ; Watson et al. 1996). Due to low signal-to-noise ratios, complicated galactic backgrounds, and the distance to most SSC systems, the Ðtting to determine the core radii of SSCs has proven difficult. Previous studies have only been able to place upper limits on the core radii (Holtzman et al. 1996 ; NGC 3597 : R [ 2 pc ; Carlson et al. 1998 ; NGC 1275 : R [ 0.75 core core pc). We Ðt modiÐed Hubble proÐles (c \ 2) to the radial luminosity distributions within the inner 3 pixels (2.4 pc) of the M82 B cluster sample with p [ 1.25 pixels, using a cusG tomized version of the CURVEFIT subroutine running under IDL. It employs a gradient-expansion algorithm to compute a nonlinear least squares Ðt to a modiÐed Hubble proÐle. We Ðnd core radii of 31 [ R 1 [ 10 pixels, or core 2.4 [ R [7.9 pc, with a smaller, secondary peak at D1.2 core pc. These core radii are similar to those for the Galactic globular clusters (Djorgovski 1993) : SR T D 1 pc, with core,G a total range from 0.03 to 23.4 pc. In Figure 17 we present the V -band light proÐles of the Ðve brightest star cluster candidates in each Ðeld. Their photometric characteristics and the size estimates obtained from Ðts to the innermost eight pixels are summarized in Table 7. These objects are bright and relatively isolated, thus enabling us to follow the light proÐles further out. The modiÐed Hubble proÐle Ðts are generally better than the Gaussian Ðts. The second and fourth columns of Figure 17 show the Ñux ratio of the data points to both the Gaussian and the modiÐed Hubble proÐle approximations. For reasons of clarity we did not include the equivalent ratio for
FIG. 17.ÈLuminosity proÐles (in V ) for the Ðve brightest candidate star clusters in both B1 and B2. Cols. (1) and (3) show the actual data points, superposed with the best-Ðtting Gaussian (short-dashed lines), modiÐed Hubble (c \ 2.0, long-dashed lines), and c \ 2.6 proÐles (solid lines ; Elson et al. 1987). In cols. (2) and (4), the Ñux ratios of data points to model Ðt are presented : the dots represent the Gaussian Ðts, the crosses a modiÐed Hubble proÐle.
TABLE 7 CHARACTERISTICS OF THE BRIGHTEST STAR CLUSTER CANDIDATES R (pc) core
REGION
CLUSTER
No.a
V 0 (mag)
B1 . . . . . .
(1) (2) (3) (4) (5) (1) (2) (3) (4) (5)
28 18 11 7 8 12 41 26 36 40
17.84 ^ 0.01 18.92 ^ 0.02 19.06 ^ 0.03 19.08 ^ 0.03 19.10 ^ 0.02 17.81 ^ 0.01 18.47 ^ 0.02 18.48 ^ 0.01 19.72 ^ 0.01 19.22 ^ 0.01
4.3 4.3 4.3 3.5 5.4 4.2 4.3 5.4 7.9 5.4
1.7 1.7 1.4 1.6 2.0 2.0 1.5 2.0 2.9 2.2
2.1 2.2 1.8 1.8 2.6 2.2 2.0 2.5 3.3 2.6
Mean :
4.9 ^ 1.2
1.9 ^ 0.4
2.3 ^ 0.4
B2 . . . . . .
a See Tables 4 and 5.
FWHM (pc)
c \ 2.0
c \ 2.6
790
DE GRIJS, OÏCONNELL, & GALLAGHER
the c \ 2.6 proÐle in the Ðgure. However, the residuals for the c \ 2.6 proÐles are similar to or slightly better than the c \ 2.0 Ðts. To assess the robustness of our Ðtting procedures, we obtained independent model Ðtting results based on the two-dimensional proÐle Ðtting routines of Matthews et al. (1999) ; which take into account the detailed HST PSFs at the positions of our M82 B clusters. L. D. Matthews kindly provided us with detailed proÐle Ðts for the brightest clusters in each of our Ðelds, and for each of the functionalities assumed in this paper. The di†erence between her results and our own is ¹10%È15%, and does not appear to be systematic. Some of the star clusters in Figure 17 show evidence for asymmetrical structures, elongations or subclustering, which may mean that they have not yet reached dynamical equilibrium. We may be witnessing ongoing merging processes, although we will need spectroscopic follow-up observations to unambiguously determine this. Similar subclustering has been observed in the SSCs in NGC 1569 (OÏConnell et al. 1994 ; De Marchi et al. 1997) and in some of the rich LMC star clusters (e.g., Fischer, Welch, & Mateo 1993). 11.
SUMMARY AND DISCUSSION
We have presented high-resolution HST /WFPC2 and NICMOS imaging of two adjacent Ðelds in the disk 1 kpc northeast of the center of M82, the prototype local starburst galaxy. This region, M82 ““ B,ÏÏ has been suspected to be a site where an intense episode of star formation occurred over 100 Myr ago. Our new observations conÐrm that M82 B is a ““ fossil ÏÏ of an ancient starburst with an amplitude entirely comparable to that now transpiring in the core of M82. It is an analog of the anomalous E]A systems found in distant galaxy clusters. M82 thus presents us with the unique opportunity to observe both active and evolved starburst environments at close range. The main results of our multipassband study are summarized below : 1. The surface brightness of M82 B is well above normal for galactic disks and comparable to the core surface brightnesses in spiral galaxies. Its intrinsic surface brightness at an age of 10 Myr was comparable to that found in the presentday nuclear starburst, indicating an event of comparable amplitude. 2. Because of the bright unresolved background light and the large and highly variable extinction within M82, we have been forced to use specialized methods to identify and photometer sources. We tested selection and photometry methods using artiÐcial sources or real star Ðeld images from HST injected into our observed images. The proximity of M82, however, is a key advantage relative to studies of more distant galaxies systems because we can use source sizes as a criterion to distinguish stars from star clusters. 3. We Ðnd a large, evolved system of SSCs in M82 B. Our cluster candidate samples consist of well-deÐned sources with Gaussian p 1 º 1.25 pixels (0A. 0569, or 1.0 pc), V ¹ 22.5 mag, andG relatively smooth backgrounds. These samples contain 43 and 70 cluster candidates in regions B1 and B2 (nearest the M82 nucleus), respectively. 4. We use a two-color BV I diagram and evolutionary spectral synthesis models to separately estimate the extinction and age of each cluster. The clusters range in absolute
Vol. 121
magnitude from M0 \ [6 to [10, with a peak at [7.5. V The derived age distribution suggests steady, continuing cluster formation at a modest rate at early times ([2 Gyr ago), followed by a concentrated formation episode D600 Myr ago and more recent suppression of cluster formation. The peak episode coincides with independent dynamical estimates for the last tidal encounter with M81, which presumably induced the starburst. 5. Our J- and H-band observations resolve the stellar population in M82Ïs disk for the Ðrst time. Comparing our near-IR color-magnitude diagram to recent Padua isochrones, the detected stars appear to be cool, heliumburning bright giants. Star formation evidently continued in M82 B until about 20È30 Myr ago. However, signiÐcant star formation has not occurred in M82 B in the last 10È15 Myr, during which the nuclear starburst has been highly active. 6. After correcting the cluster luminosity function to a Ðducial age of 50 Myr, we Ðnd that the bright end is characterized by a power-law slope with a \ [1.2 ^ 0.3, similar to that of other young cluster systems in interacting galaxies. There is tentative evidence for broadening of the luminosity function due to dynamical destruction of lower mass clusters. 7. The radial luminosity proÐles of the brightest clusters are more closely approximated by modiÐed Hubble or ““ Elson ÏÏ functions with c \ 2.0 or 2.6 than by Gaussians. Some of the clusters show evidence for asymmetries or subclustering, possibly an indication of mergers. Cluster sizes (2.34 ¹ R [10 pc, or 2.4 [ R [ 7.9 pc) and estimated masses (aeffmedian of 105 M ) core are consistent with values found for young super star _cluster populations in M82Ïs core and other galaxies and with the progenitors of globular clusters. When we combine the age estimates for the evolved cluster sample in M82 B, for the integrated spectrum of M82 B (Marcum & OÏConnell 1996), and for the resolved cool giants in the disk of region B, the following picture for the star formation history in its disk emerges. The last tidal encounter between M82 and M81 about 500 Myr ago had a major impact on what was probably an otherwise normal, quiescent, disk galaxy. It caused a concentrated burst of star formation activity, as evidenced by the peak in the age distribution of the cluster sample in M82 B. Comparison of the cluster ages with the integrated light dating (D100È200 Myr) suggests that Ðeld star formation may have continued at a high rate after cluster formation had begun to decline, but the uncertainties in the methods are too large to be certain. The enhanced cluster formation decreased rapidly within a few hundred megayears of its peak. However, Ðeld star formation continued, probably at a much lower rate, in M82 B until D20 Myr ago. It has evidently been suppressed during the last D10È15 Myr, during which the starburst in the core of M82 has been most active. Evidence for supernova remnants in the parts of region B2 nearest the starburst core (de Grijs et al. 2000) but not in region B1 indicates that disk star formation during the last 50 Myr was more active nearer the nucleus. The current starburst is probably related to late infall of tidally disrupted debris from M82 itself. The evidence for decoupling between cluster and Ðeld star formation is consistent with the view that SSC formation requires special conditions, e.g., large-scale gas Ñows, in
No. 2, 2001
FOSSIL STARBURST IN M82
addition to the presence of dense gas (see Elmegreen & Efremov 1997). A strong tidal interaction could easily produce an o†nuclear starburst at a site like M82 B. However, the M82 B burst could also have been part of a larger scale event encompassing the center of the galaxy as well. Given the high extinction and the dominance by much younger concentrations of stars, it would not be easy to identify older clusters in the starburst core if they exist. All of our observational evidence points to a scenario in which the intermediate-age star cluster population in M82 B is entirely comparable to SSC populations at a younger age, as seen in M82 A and other galaxies. They will likely evolve into Galactic globular cluster analogs over a Hubble time.
791
We thank Noella DÏCruz for helping us to check our optical photometry, Andrew Stephens and Jay Frogel for making their NICMOS calibration coefficients available prior to publication, Allan Sandage for loan of the plate shown in Figure 1, Lynn Matthews for providing an independent check on our source size estimates, Marcio Catelan for useful discussions about the interpretation of the stellar disk light in M82, and Mark Whittle for many insightful and stimulating discussions. This research was supported by NASA grants NAG 5-3428 and NAG 5-6403, and has made use of NASAÏs Astrophysics Data System Abstract Service and of HST archival data at STScI.
REFERENCES Arp, H. C., & Sandage, A. 1985, AJ, 90, 1163 Bahcall, J. N., & Soneira, R. N. 1980, ApJS, 44, 73 Barger, A. J., Aragon-Salamanca, A., Ellis, R. S., Couch, W. J., Smail, I., & Sharples, R. M. 1996, MNRAS, 279, 1 Barth, A. J., Ho, L. C., Filippenko, A., & Sargent, W. L. W. 1995, AJ, 110, 1009 Brouillet, N., Baudry, A., Combes, F., Kaufman, M., & Bash, F. 1991, A&A, 242, 35 Burstein, D., & Heiles, C. 1984, ApJS, 54, 33 Butcher, H., & Oemler, A., Jr. 1978, ApJ, 219, 18 Caldwell, N., & Rose, J. A. 1997, AJ, 113, 492 Caldwell, N., Rose, J. A., Sharples, R. M., Ellis, R. S., & Bower, R. G. 1993, AJ, 106, 473 Carlson, M. N., et al. 1998, AJ, 115, 1778 Chevalier, R. A., & Clegg, A. W. 1985, Nature, 317, 44 Conti, P. S., Leitherer, C., & Vacca, W. D. 1996, ApJ, 461, L87 Cottrell, G. A. 1977, MNRAS, 178, 577 Couch, W. J., & Sharples, R. M. 1987, MNRAS, 229, 423 DÏCruz, N. L., et al. 2000, ApJ, 530, 352 de Grijs, R. 1997, Ph.D. thesis, Univ. Groningen ÈÈÈ. 1998, MNRAS, 299, 595 de Grijs, R., OÏConnell, R. W., Becker, G. D., Chevalier, R. A., & Gallagher, J. S. 2000, AJ, 119, 681 de Jong, R. S. 1996, A&AS, 118, 557 De Marchi, G., Clampin, M., Greggio, L., Leitherer, C., Nota, A., & Tosi, M. 1997, ApJ, 479, L27 Djorgovski, S. G. 1993, in ASP Conf. Ser. 50, Structure and Dynamics of Globular Clusters, ed. S. G. Djorgovski, & G. Meylan (San Francisco : ASP), 373 Doane, J. S., & Mathews, W. G. 1993, ApJ, 419, 573 Dressler, A., & Gunn, J. E. 1990, in ASP Conf. Ser. 10, Evolution of the Universe of Galaxies, ed. R. G. Kron (San Francisco : ASP), 200 Elmegreen, B. G., & Efremov, Y. N. 1997, ApJ, 480, 235 Elson, R. A. W., & Fall, S. M. 1985, PASP, 97, 692 ÈÈÈ. 1988, AJ, 96, 1383 Elson, R. A. W., Fall, S. M., & Freeman, K. C. 1987, ApJ, 323, 54 Fabbiano, G., & Trinchieri, G. 1984, ApJ, 286, 491 Fall, S. M., & Rees, M. J. 1977, MNRAS, 181, 37P ÈÈÈ. 1985, ApJ, 298, 18 Fioc, M., & Rocca-Volmerange, B. 1997, A&A, 326, 950 Fischer, P., Welch, D. L., & Mateo, M. 1993, AJ, 105, 938 Freedman, W., et al. 1994, ApJ, 427, 628 Fritze-von Alvensleben, U., & Gerhard, O. E. 1994, A&A, 285, 775 Gallagher, J. S., & Smith, L. J. 1999, MNRAS, 304, 540 Girardi, L., Bressan, A., Bertelli, G., & Chiosi, C. 2000, A&AS, 141, 371 Gnedin, O. Y., & Ostriker, J. P. 1997, ApJ, 474, 223 Gottesman, S. T., & Weliachew, L. 1977, ApJ, 211, 47 Harris, W. E. 1991, ARA&A, 29, 543 ÈÈÈ. 1996, AJ, 112, 1487 Harris, W. E., Harris, G. L. H., & McLaughlin, D. E. 1998, AJ, 115, 1801 Harris, W. E., & Pudritz, R. E. 1994, ApJ, 429, 177 Ho, L. C. 1997, in Starburst Activity in Galaxies, ed. J. Franco, R. Terlevich, & G. Tenorio-Tagle (Rev. Mexicana Astron. AstroÐs. Ser. Conf. 6) (Mexico D.F. : Inst. Astron., Univ. Nac. Autonoma Mexico), 5 Ho, L. C., & Filippenko, A. V. 1996a, ApJ, 466, L83 ÈÈÈ. 1996b, ApJ, 472, 600 Holtzman, J. A., et al. 1992, AJ, 103, 691 Holtzman, J. A., Burrows, C. J., Casertano, S., Hester, J. J., Trauger, J. T., Watson, A. M., & Worthey, G. 1995, PASP, 107, 1065 Holtzman, J. A., et al. 1996, AJ, 112, 416 Humphreys, R. M., & McElroy, D. B. 1984, ApJ, 284, 565 Hunter, D. A., OÏConnell, R. W., & Gallagher, J. S. 1994, AJ, 108, 84
Hunter, D. A., OÏConnell, R. W., Gallagher, J. S., & Smecker-Hane, T. A. 2000, AJ, 120, 2383 King, I. R. 1966, AJ, 71, 64 Leitherer, C., et al. 1996, PASP, 108, 996 (BC96) Leitherer, C., & Heckman, T. M. 1995, ApJS, 96, 9 Leitherer, C. M., et al. 1999, ApJS, 123, 3 Lynds, C. R., & Sandage, A. R. 1963, ApJ, 137, 1005 Mandushev, G., Spassova, N., Staneva, A. 1991, A&A, 252, 94 Marcum, P., & OÏConnell, R. W. 1996, in ASP Conf. Ser. 98, From Stars to Galaxies : The Impact of Stellar Physics on Galaxy Evolution, ed. C. Leitherer, U. Fritze-von Alvensleben, & J. Huchra (San Francisco : ASP), 419 Matthews, L. D., et al. 1999, AJ, 118, 208 McCarthy, P. J., Heckman, T., & van Breugel, W. 1987, AJ, 92, 246 McLaughlin, D. E., Harris, W. E., & Hanes, D. A. 1994, ApJ, 422, 486 McLaughlin, D. E., & Pudritz, R. E. 1996, ApJ, 457, 578 McLeod, K. K., Rieke, G. H., Rieke, M. J., & Kelly, D. M. 1993, ApJ, 412, 111 Melnick, J., Moles, M., & Terlevich, R. 1985, A&A, 149, L24 Meurer, G. R. 1995, Nature, 375, 742 Meurer, G. R., Freeman, K. C., Dopita, M. A., & Cacciari, C. 1992, AJ, 103, 60 Miller, B. W., Whitmore, B. C., Schweizer, F., & Fall, S. M. 1997, AJ, 114, 2381 Murali, C., & Weinberg, M. D. 1997a, MNRAS, 288, 749 ÈÈÈ. 1997b, MNRAS, 288, 767 ÈÈÈ. 1997c, MNRAS, 291, 717 OÏConnell, R. W., Gallagher, J. S., & Hunter, D. A. 1994, ApJ, 433, 65 OÏConnell, R. W., Gallagher, J. S., Hunter, D. A., & Colley, W. N. 1995, ApJ, 446, L1 OÏConnell, R. W., & Mangano, J. J. 1978, ApJ, 221, 62 (OM) Oegerle, W. R., Hill, J. M., & Hoessel, J. G. 1991, ApJ, 381, L9 Oemler, A. 1992, in Clusters and Superclusters of Galaxies, ed. A. C. Fabian (Dordrecht : Kluwer), 29 Oestreicher, M. O., Schmidt-Kaler, T., & Wargau, W. 1997, MNRAS, 289, 729 Ostriker, J. P., & Gnedin, O. Y. 1997, ApJ, 487, 667 Pryor, C., & Meylan, G. 1993, in ASP Conf. Ser. 50, Structure and Dynamics of Globular Clusters, ed. S. G. Djorgovski, & G. Meylan (San Francisco : ASP), 357 Reid, I. N. 1997, AJ, 114, 161 ÈÈÈ. 1998, AJ, 115, 204 Richer, H. B., Crabtree, D. R., Fabian, A. C., & Lin, D. N. C. 1993, AJ, 105, 877 Rieke, G. H., & Lebofsky, M. J. 1985, ApJ, 288, 618 Rieke, G. H., Lebofsky, M. J., Thompson, R. I., Low, F. J., & Tokunaga, A. T. 1980, ApJ, 238, 24 Rieke, G. H., Loken, K., Rieke, M. J., & Tamblyn, P. 1993, ApJ, 412, 99 Sakai, S., & Madore, B. F. 1999, ApJ, 526, 599 Salasnich, B., Girardi, L., Weiss, A., Chiosi, C. 2000, A&A, 361, 1023 Salpeter, E. E. 1955, ApJ, 121, 161 Satyapal, S., et al. 1995, ApJ, 448, 611 Satyapal, S., Watson, D. M., Pipher, J. L., Forrest, W. J., Greenhouse, M. A., Smith, H. A., Fischer, J., & Woodward, C. E. 1997, ApJ, 483, 148 Schweizer, F., Miller, B. W., Whitmore, B. C., & Fall, S. M. 1996, AJ, 112, 1839 Shopbell, P. L., & Bland-Hawthorn, J. 1998, ApJ, 493, 129 Smith, L. J., & Gallagher, J. S. 2000, in ASP Conf. Ser. 211, Massive Stellar Clusters, ed. A. Lancon & C. Boily (San Francisco : ASP), 90 Stephens, A. W., Frogel, J. A., Ortolani, S., Davies, R., Jablonka, P., Renzini, A., & Rich, R. M. 2000, AJ, 119, 419 Stetson, P. B. 1987, PASP, 99, 191
792
DE GRIJS, OÏCONNELL, & GALLAGHER
Strickland, D. K., Ponman, T. J., & Stevens, I. R. 1997, A&A, 320, 378 Tacconi-Garman, L. E., Sternberg, A., & Eckart, A. 1996, AJ, 112, 918 Telesco, C. M. 1988, ARA&A, 26, 343 VandenBerg, D. A. 1992, ApJ, 391, 685 van den Bergh, S. 1995, Nature, 374, 215 van den Bergh, S., Morbey, C., & Pazder, J. 1991, ApJ, 375, 594 van der Hulst, J. M. 1979, A&A, 75, 97 Vigroux, L., Boulade, O., & Rose, J. A. 1989, AJ, 98, 2044 Watson, A. M., et al. 1996, AJ, 112, 534 Watson, M. G., Stanger, V., & Griffiths, R. E. 1984, ApJ, 286, 144
Whitmore, B. C., & Schweizer, F. 1995, AJ, 109, 960 Whitmore, B. C., Schweizer, F., Leitherer, C., Borne, K., & Robert, C. 1993, AJ, 106, 1354 Whitmore, B. C., Sparks, W. B., Lucas, R. A., Macchetto, F. D., & Biretta, J. A. 1995, ApJ, 454, L73 Whitmore, B. C., Zhang, Q., Leitherer, C., Fall, S. M., Schweizer, F., & Miller, B. W. 1999, AJ, 118, 1551 Yun, M. S. 1992, Ph.D. thesis, Harvard Univ. Yun, M. S., Ho, P. T. P., & Lo, K. Y. 1993, ApJ, 411, L17 ÈÈÈ. 1994, Nature, 372, 530


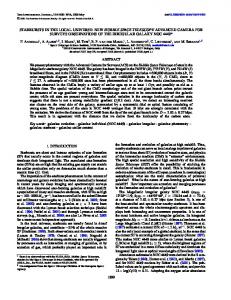

![SYMBOLIC POWERS OF RADICAL IDEALS 1. Introduction. In [1], M](https://m.moam.info/img/260x300/symbolic-powers-of-radical-ideals-1-introduction-i_5c934a90097c47862f8b45bc.jpg)