ROUTINE VIOLENCE IN THE ISLAND OF JAVA, INDONESIA: NEO-MALTHUSIAN AND SOCIAL JUSTICE PERSPECTIVES Mohammad Zulfan Tadjoeddin Lecturer, School of Economics and Finance University of Western Sydney, Australia & Visiting Researcher, Institute of Social Studies, The Netherlands
[email protected] Anis Chowdhury Professor, School of Economics and Finance University of Western Sydney, Australia & Senior Economic Affairs Officer, UN-Department of Economic & Social Affairs, New York
[email protected] Syed Mansoob Murshed Professor, The Birmingham Business School University of Birmingham, UK Professor, Institute of Social Studies, The Hague, The Netherlands & Fellow, Centre for the Study of Civil War, Oslo, Norway
[email protected] October 2010 Abstract This chapter examines the role of population pressure and inequality, and their possible joint effects on routine violence across districts in Java. It looks at violence from the perspectives of neo-Malthusian and social justice. These issues are highly relevant for Java. Inhabited by 128 million people, it is the most populous island on earth and the most densely populated island in Indonesia, making it classically Malthusian. Furthermore, the effects of global climate change (e.g. rising sea level) and environmental degradations are likely to deepen the Malthusian scenario for Java. We employ count data panel data regression technique of 98 districts in Java covering the period 1994-2003. Using population density as the indicator of population pressure, we find empirical evidence of the neo-Malthusian conflict scenario. However, the support is only available for population density indicator. The effect is worse if higher population density coincide with higher population growth. Although the role of vertical inequality in conflict has been largely discounted in empirical cross-country studies, we find empirical support for a violence inducing effect of vertical inequality. This finding is based on the apparent existence of an inverted-U relationship between inequality and income as hypothesized by Kuznets. Our finding on the inequality effect helps in explaining the inverted-U-relationship between income and violence found elsewhere. The effect of income on violence is channelled through inequality. Inequality induced grievances would be more intense and spread quicker in more densely populated localities, pointing to an unsafe mixture of vertical inequality and population pressure. Keywords: Indonesia, Routine Violence, Inequality, Population Pressure
1
1. INTRODUCTION Among the many determinants of violent conflict, the role of population pressure and inequality might be the most disputed ones. The former is due to the discrepancy between individual case studies (usually at a national level) and large cross country studies (Urdal, 2008), while the latter concerns with the differentiation between vertical and horizontal inequalities (Stewart, 2000 and 2008). This chapter seeks to empirically scrutinize these two determinants of violent conflict, and their possible joint effects, in the case of routine-everyday violence in the ethnically rather homogenous and densely populated island of Java, Indonesia. Routine-everyday violence is neither civil war nor ethno-communal violence. It refers to regular group violence that is not episodic in nature. The two most important variants of routine-everyday social violence are vigilante violence and inter-neighbourhood/village/group brawls. Contemporary violent conflicts in Indonesia can be broadly categorized into episodic and routine. The episodic ones consist of secessionist and ethnic violence. This chapter is about the other category: routine violence, which is essentially a residual category of violent conflict. Routine social (or group or collective) violence does not have the explicit political aim of overthrowing the state as in the case of civil war, or the emasculation of a rival group as in the case of ethno-communal violence. It is also not simply crime, although it could have criminal dimensions. The theoretical underpinnings for routine violence are similar to those utilized to explain mass political violence short of internal war in Hibbs (1973). While civil wars seem to be caused by or related to ‘underdevelopment’, specifically the lack of economic growth; routine violence may be a consequence of growth and globalization, when the fruits of progress are inequitably distributed. It tends to occur spontaneously and sporadically without being led by any organized gang. It also does not lead to capture of any one’s possessions. Routine violence is largely confined to the poor and low income people. In general, routine violence can be a manifestation of frustration by the lower socio-economic segment of society rather than greed of those involved. However, what is interesting is that routine violence
2
is more common in the ethnically largely homogenous and densely inhabited island of Java, while the majority of episodic conflicts occurred mainly in the outer islands (outside Java),1 which are ethnically very diverse but sparsely populated. Therefore, it is imperative to consider demographic factors along with socio-economic factors in analysing routine violence. Among the demographic factors, population density and the dominance of youth in the population distribution are likely to play a role in routine violence, which is often referred to as the neo-Malthusian conflict scenario (Homer-Dixon, 1991, 1994, 1999; and Kaplan, 1994). Mere physical proximity in a densely populated area makes it easier to engage in violence, as well as enhances the chances of friction among people. Furthermore, majority of participants in any kind of violence are generally found to be youth, aged between 15 and 24. Urdal (2006, 2008) finds that youth bulges correlate positively with conflict at both cross-country and individual country (India) studies. In other words, youths are an important agent of violence (Huntington, 1996). This is likely to be heightened when their socio-economic achievement is less than their expectations or national average. For example, if there is a large educated unemployed segment in the population, one can expect higher level or frequency of routine violence. Education generates an expectation of a decent job and a better life. When that is not fulfilled, youths suffer from a sense of relative deprivation and their anger or frustration may manifest itself in routine violence, something which does not have an explicit political or criminal motive. The rest of the chapter proceeds as follows. Section 2 reviews of past research on violent conflict Indonesia and sets out the context of the present analysis. Section 3 discusses our framework of analysis of routine violence, linking it to population pressure and inequality. Section 4 explains the model and data issues. Section 5 presents the results, and some conclusions are offered in the last section.
1
Secessionist violent conflicts in Indonesia were confined to the western-most province of Aceh and the eastern-most province of Papua. In addition, Indonesian East Timor could also be added to this category. Major sites for Christian Muslim violence were the provinces of Maluku, North Maluku and Central Sulawesi, while anti Madurese violence took place in West and Central Kalimantan.
3
2. LITERATURE REVIEW AND CONTEXT An early empirical study of routine violence by Tadjoeddin and Murshed (2007) examined the socio economic determinants of routine violence across districts in Java by focusing on the level and growth of income, education level, poverty rate and human development index. They found an inverted-U-shaped relationship between routine violence and levels of development (proxied by income and education). That is, violence initially increases with the increase of income/education and then declines. They also found a violence increasing effect of poverty, and a violence reducing impact of human development. Tadjoeddin and Murshed attributed the initial positive relation between income and violence to the frustration and anger of the less fortunate, and the later negative relationship to the higher opportunity cost of engaging in violence and better law and order. However, this explanation appears less satisfactory in light of the fact that routine violence is not led by any organized gang nor does it lead to grabbing of possessions. In a later study, Murshed, Tadjoeddin and Chowdhury (2009) have found that fiscal decentralization had a violence reducing effect in the case of routine violence. They argue that fiscal decentralization, and the increased size of local government, can alleviate pent-up frustrations with a centralized state, as local government expenditure is seen to satisfy the needs of communities that people identify with more closely. This explanation seems to apply more to the collective mood rather than the individual’s propensity to violent act triggered by one’s sense of deprivation. One way this can be captured is by examining the role of inequality in routine violence. An important dimension in the analysis of violence and conflict is the perceived and actual equitability of distribution of fruits of economic progress among the population. In short, income inequality does matter, and the link between inequality and violent conflict is an age-old concern, although it has been dismissed by prominent analysts more recently. However, its role has not been systematically examined in the context of Indonesia. There are two types of inequality: (a)
4
vertical and (b) horizontal. Vertical inequality refers to inequality in a population and is commonly measured by the Gini coefficient.
Another widely used measure is the decile
dispersion ratio, which presents the ratio of the average consumption or income of the richest 10 per cent of the population divided by the average income of the bottom 10 per cent. It indicates how the bottom decile of the population (in terms of income) fairs in comparison with the top decile. Horizontal inequality refers to inequality between different ethno-social groups or regions. It can be measured simply by the ratio of mean or average incomes of two groups (or regions). It can also be measured by the relative size of different groups’ (or regions’) income shares in the total – Gross National Income (GNI), group Gini coefficients or by a metric akin to the coefficient of variation. Horizontal inequality, thus, shows the relative welfare of different socioeconomic or ethno-religious groups or regions. Horizontal inequality generates a sense of relative group deprivation, while vertical inequality causes a general sense of personal deprivation among the poor and lower middle income people. Cramer (2005) reviews the literature on the link between inequality and violent conflict, and suggests that ‘it is almost a universal assumption that an inequitable distribution of resources and wealth will provoke violent rebellion’ (p.1). However, at the empirical level, there is no consensus about the pattern of the relationship. The range of predictable patterns include positive linear, U-shaped and inverted-U-shaped relationships, and some have even suggested that there is no relationship. Thus, as Cramer (2005) points out some characteristics of inequality, rather than inequality itself, may be more relevant. They may include the process or causes of inequality, and society’s tolerance level (a threshold inequality), determined by socio-political factors. Horizontal inequality between different regions and ethnic groups played a significant role in the separatist and ethnic conflicts in Indonesia (Tadjoeddin, Suharyo and Mishra, 2001 and Tadjoeddin, 2009). Since Java is ethnically very homogenous and routine violence is nothing to do with ethnic groupings, the notion of horizontal inequality seems to be less relevant. While Indonesia, as a country, is ethnically very heterogeneous and some of its areas in the outer islands
5
are ethnically highly polarized; the issue of vertical inequality becomes pertinent for Java due to its ethnic homogeneity. The western part of Java is predominantly ethnic Sundanese, while the central and eastern parts are dominated by ethnic Javanese. The two ethnic groups account for around 85% of Java’s population. Higher levels of ethnic homogeneity are found at district levels, too; for example, ethnic Javanese accounts for more than 95% in more than two-third of districts in the provinces of Central and East Java. However, in an ethnically homogenous society, vertical inequality might be an important factor in aggravating a general sense of frustration manifested in low intensity routine violence. This is especially so in a densely populated area with a relatively low income level, where competition for resources (survival) can be more intense. It may be mentioned here that except for a few districts (such as Jakarta, Surabaya and Kediri) Java is a relatively poor island compared to resource rich outer islands.2 Focusing on demographic/population factors and income inequality in the context of routine violence is a relatively new area of enquiry. In a cross provincial analysis in Indonesia, Østby et al. (2011) have found that in provinces where population growth is high, greater levels of child mortality between religious groups –an indication of horizontal inequality among them— tend to increase the risk of routine violence. This conclusion is based on the significance of the interaction term between population growth and horizontal inequality. However, the variable of horizontal inequality by itself never turned up significant. As horizontal inequality is more appropriate in explaining the context of secessionist and ethnic conflicts, we would argue for the more relevant role of vertical inequality is in the case of routine violence. The issue of population pressure (density) is highly relevant for Java. The island is inhabited by 128 million people (in 2005) making it the most populous island on earth and the most densely
2
See Appendix 1 for detail.
6
populated island in Indonesia (Table 1).3 The effects of global climate change (e.g. rising sea level) and environmental degradations are likely to deepen the Malthusian scenario for Java. Rising sea level, in particular, is a clear future danger for the northern low-land coastal area of the island. The northern part of Java is more developed and more prosperous than the southern part. Therefore, climate change may increase the already high population pressure in the island. On average, youths aged between 15 and 24 account for around 25% of total adult population (aged 15+).4 The figures are more or less similar across provinces, but they are more varied across districts, in which urban districts tend to have higher proportions of youth. While youths have higher educational attainment, the unemployment rate is the highest among this age cohort. This is related to the main characteristics of unemployment in Indonesia generally. That is, unemployment rates are higher among the youth, the educated people and the urban population (Chowdhury, Islam and Tadjoeddin, 2009). The trends in Gini coefficients are more or less similar across regional aggregations (provinces in the island of Java, and Indonesia as a whole, see Table 2). The peak of Gini was in 1996, preceding the Asian financial crisis, declining thereafter, reaching its lowest point in 2000. Thereafter, Gini shows an increasing trend. The magnitudes of Gini coefficients in the provinces of Java are roughly similar with that for Indonesia as a whole; however they vary across provinces. The variations are even wider across districts (see Appendix 1). Furthermore, districts in Java are generally poor relative to the Indonesian average: the per capita regional GDP of 83 districts (85%) out of 98 districts in our sample is lower than the national average (Appendix 1). There is also the possibility of interaction between population/demographic factors and vertical inequality in routine violence. That is, the impact of inequality on violence is likely to be
3
If Java is treated as a single country and small city states are excluded, it will be the second most densely populated area in the world after Bangladesh. 4 This figure is moderate. In 2000, the age groups of 15–24 made up 17% or less of the total adult population in almost all developed countries, while the figures for developing countries were around 35% (Urdal, 2006). However, the variation of the figures across districts in Java is more important than the overall average.
7
higher in the presence of high population density and a large youth bulge. Therefore, it would be an interesting endeavour to analyse how inequality and population variables might interact in aggravating low intensity routine violence in Java.
Table x.1. Population density by main islands (population/km2), 2005 Number of population Java
Density (population/km2)
128,470,536
1,007
Sumatra
46,029,906
96
Kalimantan
12,098,036
21
Sulawesi
15,787,955
82
4,654,081
10
Maluku-Papua Indonesia Bangladesh Source: BPS and World Bank data.
218,868,791
116
144,319,628
1,063
Tabel x.2. Gini coefficient, 1994-2003 1994
1995
1996
1997
1998
1999
2000
2001
2002
West Java
0.36
0.33
0.38
0.33
0.33
0.31
0.31
0.31
0.33
0.32
Central Java
0.31
0.31
0.32
0.30
0.30
0.29
0.30
0.30
0.32
0.29
East Java
0.33
0.35
0.35
0.35
0.34
0.31
0.32
0.32
0.34
0.32
Banten
0.34
0.35
0.35
0.32
0.32
0.29
0.33
0.33
0.33
0.31
Java (4 prov)
0.34
0.34
0.36
0.33
0.33
0.31
0.32
0.32
0.34
0.32
0.34
0.37
0.35
0.34
0.34
0.32
0.32
0.35
0.33
Indonesia 0.35 Source: Calculated from BPS data.
2003
3. VIOLENCE, POPULATION PRESSURE AND INEQUALITY
3.1. Population and Demographic Factors Increased population results in a decline in per-capita resource availability (without technical progress), which in turn creates more competition with the potential to result in conflict (HomerDixon, 1991, 1994, 1999). This belongs to Homer-Dixon’s notion of demand-induced scarcity
8
that is primarily caused by population growth. 5 Supporting this view, in a widely publicized article, Kaplan (1994) predicted a coming world anarchy sparked off by resource scarcity and environmental degradation. Such a view is often referred to as a neo-Malthusian perspective. Although Homer-Dixon’s argument is quite appealing, his approach has been criticized for being anecdotal relying on case studies that nicely coincide with his hypothesis. When a more systematic approach is used: cross-national quantitative studies employing country level measures of population pressure and resource scarcity, de Soysa (2002) and Urdal (2005) found only marginal support for this neo-Malthusian hypothesis of conflict. It has been suggested that the level of analysis may be the cause of the discrepancy between cross-country and case studies. National demographic aggregates tend to disguise local level diversity of population dynamics. While the cross-country studies mostly focus on the high profile armed conflict such as civil war and ethnic violence, the local level population dynamics may be argued to cause local conflicts (Urdal, 2008). As mentioned earlier, the impact of youth bulges on conflict is likely to be greater if there is high unemployment among youth. Densely populated Java is an ideal place to test the Homer-Dixon hypothesis since Java is classically Malthusian. Land is a major fixed factor of production. The conditions of diminishing returns to other agricultural inputs and agricultural labour are at work. However, the classic problem in Indonesia and Java in particular is that, for several reasons the pace of industrialization and development of other non-agricultural sectors has not been rapid enough to absorb labour from agriculture. Therefore, structural transformation of the Indonesian and the Javanese economy was not matched by a similar transformation of employment patterns.
5
In addition to demand-induced scarcity, Homer-Dixon identifies the other two main-sources of resource scarcity: supply-induced scarcity resulting from depletion of natural resources and structural scarcity that applies only to certain groups, in relative term, because they are excluded from equal access to particular resources.
9
Between 1971 and 2003, the contribution of agriculture to the Indonesian economy sharply declined from 53%% to 17%, while the share of labour in the sector fell only from 66% to 46%.6 In addition to population density, the youth cohort –widely termed youth bulge– may also play a role in routine violence. As shown in Table 3, population pyramids of provinces and districts in Java have a higher proportion youth. Unemployment is also high among the youth.
Table x.3. Population pyramid, 2003 Age groups 0-14
15-24
25-34
35-44
45-54
55-64
65+
Total
West Java
29.5
18.4
16.4
15.0
10.4
6.0
4.3
100
Central
27.3
18.3
15.4
14.9
10.7
6.9
6.5
100
East
25.0
16.8
16.7
15.8
11.9
7.6
6.2
100
Banten
33.3
19.1
17.8
14.9
8.6
4.2
2.0
100
java (4)
27.4
17.8
16.3
15.2
10.9
6.8
5.6
100
18.6
16.5
14.4
9.9
5.7
4.3
100
Indonesia 30.6 Source: Calculated from BPS data.
Therefore, the following hypothesis is put forward for the three key indicators of population and demographic factors to explain routine violence, namely population density, youth bulges and population growth.
H1: Districts that experience higher population pressures tend to experience a higher level of routine violence incidence.
Furthermore, we test for possible interaction effects among the three indicators of population pressure and we have the following set of hypotheses.
H2a: The joint effect of population density and population growth on routine violence is positive H2b: The joint effect of population density and youth on routine violence is positive H2c: The joint effect of youth bulges and population growth on routine violence is positive
6
Taken from BPS data (National Income Account and Sakernas – National Labour Force Survey, various years)
10
3.2. Inequality The link between inequality and conflict is an age old concern. Many theorists have suggested that the former breeds the latter, for examples Gurr (1970), Huntington (1968) and Russet (1964). 7 Cramer (2005:1) argues, ‘it is almost a universal assumption that an inequitable distribution of resources and wealth will provoke violent rebellion’. Kanbur (2007:5) states that ‘it seems to be generally accepted that poverty and inequality breed conflict’. In general, inequality creates a sense of injustice that is central to the grievance motive for any kind of violent conflict. Nafziger and Auvinen (2002) find that large income inequality exacerbates the vulnerability of populations to humanitarian emergencies. Muller (1997) argued that ‘a high level of income inequality radicalizes the working class, enhances class polarization, and reduces the tolerance of the bourgeoisie for political participation by the lower classes’ (p. 137). In a crosscountry study, he showed a positive correlation between income inequality and binary variable of stability and instability of democracy between 1960 and 1980. These studies are in support of Alesina and Perotti (1996) who found that income inequality was associated with social discontent and political instability which in turn are correlated with lower investment. However, the two most widely cited cross-country empirical studies on civil war by Fearon and Laitin (2003) and Collier and Hoeffler (2004) have largely dismissed the role of inequality in conflict. From a political science perspective, Fearon and Laitin imply inequality does not matter because of state capacity (suppression power of the state). The Collier and Hoeffler view is more akin to banditry or warlordism; see Murshed and Tadjoeddin (2009) and Murshed (2010) for reviews. That is, to them the root cause of conflict is not social pathology (e.g. inequality), but individual pathology (e.g. greed). They also ignore collective action problem as discussed in 7
Since Aristotle, social philosophers have speculated that economic inequality is a fundamental cause of political violence and revolution. De Tocqueville ([1835] 1961:302) stated the classical hypothesis succinctly: ‘Almost all of the revolutions which have changed the aspect of nations have been made to consolidate or to destroy social inequality. Remove the secondary causes which have produced the great convulsions of the world, and you will almost always find the principle of inequality at the bottom’.
11
Olson (1965), because Fearon and Laitin are blinded by power and neo-classical economists like Collier only see selfish greedy motivation. Since these studies use the Gini index of vertical income inequality that measures inequality between individuals for the entire country, its differentiation with the horizontal inequality that focuses on inequality between groups within country becomes critical. In this regards, Stewart (2000, 2008) argues that it is the latter (horizontal inequality) that matters for conflict. Groups’ horizontal inequalities help in building in-group solidarity and, in turn, solve collective action problem.
Stewart presents several case studies in support of her argument. Latter on, the
horizontal inequality argument has also received empirical supports in a recent cross-country study of civil war (Østby, 2008), as well as in ethnic conflict across districts in Indonesia (Mancini, 2008). Another strand of study relates the role of vertical inequality in conflict to the democratization movement. For example, Acemoglu and Robinson, (2006) believe that the demand for democracy is partly driven by aspirations for redistribution. In most cases, the democratization movement in its early phase has involved violent actions against authoritarian regimes. The violence involves not only the citizens and the security apparatus, but also the beneficiaries of the system (the elites and their private armies) and the general public. Therefore, it would be unwise to totally discount the role of vertical inequality in conflict and solely focus on the horizontal inequality, as the latest developments in the area of research seem to suggest, see for example Stewart (2008) and Østby et al. (2011). Both kinds of inequality create a sense of frustration highly essential in fuelling grievances among the general population and socio-economic/ethno-religious groups. We argue that the opposing findings may be due to different types of conflict one is studying. While the studies that do not find much support for vertical inequality look at the high profile violent conflicts such as civil war and ethnic conflict, or what we term as episodic violence, our study examines low intensity routine violence. In such
12
cases, the general sense of deprivation among the population due to high inequality of income and assets may play a significant role. Routine violence in some sense is a manifestation of frustration and can be seen as a competition among the lower strata of the socio-economic class in the absence of a class war. The work of Tadjoeddin and Murshed (2007) on routine violence in Java can be extended to study the role of vertical income inequality. One of their findings on the structural factor behind routine violence is the general sense of grievance in the population, which arises from a situation where progress in education is not commensurate with improvements in their incomes. Vertical income inequality can be seen as another potential source of general sense of grievance. Therefore, we propose the following hypothesis:
H3: Vertical income inequality would have a positive effect on routine violence
3.3. Joint Effect of Population Pressure and Inequality Then we consider the potential joint effects between vertical inequality variable and the two population/demographic indicators. It is highly possible that grievances resulting from vertical inequality become more intense in the presence of population pressure. In other words, the positive effect of a similar level of inequality on violence is higher in a society with higher population density. This is because inequality induced grievances would be more intense and spread quicker in more densely populated localities. Since youths are the main perpetrators of any kinds of social violence, existing level of inequality potentially adds to their frustration. Therefore, it might be the case that the combination of high inequality and large youth bulge is an undesirable mixture in the case of routine violence. We therefore, propose the following hypothesis with respect to the two indicators of population pressure (population density and youth bulge).
13
H4: The positive effects of vertical inequality are higher in a district (region) population pressure
with higher degrees of
4. DATA AND MODEL 4.1. Data on Routine Violence The data on the dependent variable, the number of incidents of routine social violence across districts in Java are taken from a unique UNSFIR dataset on social violence in Indonesia (UNSFIR/UNDP, 2004).8 Each incident of violence is recorded in a template, which covers the following information: place, date, duration, category, fatalities (killed, injured), property damage (houses, shops, and public buildings). The data can be disaggregated up to the district level; most can be disaggregated up to the sub-district level, and most village names where violence incidents took place can be traced. The dataset is based on daily reports of leading provincial newspapers.9 Although not perfect, this dataset can be regarded as the most comprehensive nation-wide data on social violence available in Indonesia, covering 14 provinces in Indonesia for the period 1990-2003.
10
The UNSFIR/UNDP social violence database has been criticized as an
underestimate by the World Bank, who in turn developed its own database for 12 districts (seven in East Java province and five in East Nusatenggara province), for the period 2001-2003, based on district or sub-provincial newspapers (see Barron and Sharpe, 2008). The practical application of the World Bank approach of using district newspapers on a wider scale is highly questionable, given the fact that district newspapers are not evenly available across regions in Indonesia. Another data set was gathered by Bridget Welsh of Johns Hopkins University-JHU (Welsh, 8
For detail explanations on the dataset, see Varshney, Tadjoeddin and Panggabean (2008). Jakarta and Yogyakarta are excluded, but the remaining provinces cover 90% of Java’s population. 9 It should be pointed out that all conflict data, including the highly regarded PRIO-Uppsala data set on conflict, is collected from a variety of anecdotal sources comprising the media, human rights groups and the Red Cross. At the country level, as another example, a database on Hindu-Muslim riots in India 195095, based on THE TIMES of India, was put together by Steven Wilkinson and Ashutosh Varshney, see Wilkinson (2004) and Varshney (2002). 10 The fourteen provinces are Riau, Jakarta, Banten, West Java, Central Java, East Java, Central Kalimantan, West Kalimantan, South Sulawesi, Central Sulawesi, East Nusatenggara, West Nusatenggara, Maluku, and North Maluku. It is estimated that the fourteen provinces account for 96.4% of total deaths in non-separatist violence in Indonesia (see Varshney, Tadjoeddin and Panggabean, 2008).
14
2008). Welsh collected data on all vigilante violence in four provinces (West Java, Bengkulu, Bali and South Kalimantan) from all available provincial and district newspapers supplemented by data from police offices at the district level. Both alternatives give higher figures, but their data are limited to a few regions: Welsh (2008) for four provinces and only for vigilantism (19952004); Barron and Sharpe (2008) only cover 12 districts (2001-2003). The last dataset available is conflict data at the village level, collected by BPS-Statistic Indonesia (Badan Pusat StatistikCentral Statistical Agency) through the long standing PODES-village potential survey for all 69,000 villages in Indonesia for the year 2002, based on information provided by village heads. This is the first attempt made by BPS to collect conflict data; where the definition of conflict is somewhat ambiguous and the data are available only for one year (Barron, Kaiser and Pradhan, 2009).11 The four datasets, UNSFIR/UNDP, World Bank, JHU and BPS-Statistic Indonesia have different approaches to violence –in terms of definition and methodology.12 Due to the fact that routine violence is not episodic, all incidents of non ethno-communal violence in the UNSFIR database are categorized as routine violence. This database does not include data on separatist violence which exclusively refers to violence in Aceh and Papua where separatist movements were/are in place. Ethnic in the UNSFIR database is broadly defined as in Horowitz (1985), who argues that all conflicts that are based on ascriptive (birth based) group identities –race, language, religion, tribe, or caste — can be called ethnic. Can ethno-communal violence be routine in nature? This is possible, as in the case of Hindu-Muslim violence in India, and may be argued to be a feature of everyday life in particular Indian localities (Brass, 2003). However, based on the fourteen years of data available in Indonesia, ethno-communal violence is more appropriately described as episodic, since these incidents are concentrated in particular places and times, and do not occur with an empirical regularity to warrant description as part of everyday life of the society. In empirical terms, however, a group brawl may have an ethno11
Similar data were also gathered in the subsequent PODES survey in 2005. In fact, the Indonesia country office of the World Bank is expanding and updating the UNSFIR database (Barron et al., 2009).
12
15
communal dimension. The UNSFIR database carefully considers which incidents belong to the ethno-communal category. An incident of violence (brawls, riots, or vigilantism for example) is coded ethno-communal, if ethno-communal symbols were present in the incident –information that is unlikely to be missed in the newspaper report of the event. Furthermore, all available detailed case studies or specialized reports on social violence were consulted in constructing the dataset.
4.2. Other Data Data on population numbers and population density are derived from population census (conducted every 10 years) and inter-census population surveys (conducted between two censuses). Data on the size of young age cohort relative to adult population (youth bulges) and the Gini coefficient of income are calculated from the yearly National Socio-economic Surveys (Susenas). Data on per capita regional gross domestic product are taken from the regional income accounts. All other data are from the BPS-Statistic Indonesia.
4.3. Estimation Strategy The unit of analysis is the district-year in the form of a panel dataset of 98 districts in Java over the period 1994-2003. The dependent variable we seek to explain is the number of routine violent incidents across districts in Java. This variable is in the form of count data that may take on any non-negative integer value, including zero. Therefore, the dependent variable is discrete, and cannot be treated as a continuous random variable. The most basic model for estimating count data is the Poisson regression model for rare events.13 However, in most cases, Poisson suffers from the over-dispersion problem; therefore, negative binomial is a much better alternative. Then, we decide to stick to the fixed effects variant
13
For more details on count data regression, one may consult Cameron and Trivedi (1998). Count data regressions are common in certain types of empirical research such as criminology.
16
of negative binomial since fixed effects help in controlling for time-invariant district characteristics (unobserved heterogeneity) that correlate with the independent variable. Unobserved heterogeneity is particularly acute when modelling social phenomenon such as social violence. One has to admit that a lot of factors play roles in determining violence intensity and only a few of them can be included in the model. Factors such as local culture, institutions, policing, and so on are left out simply due to data unavailability or difficulties in finding a sensible proxy for inclusion in the model. Moreover, such factors barely change within a relatively short time period, a decade in our case. The use of fixed effects model should help in addressing this issue, and it has been noted in recent cross country studies – see for examples Acemoglu et al. (2008), and Papaioannou and Siourounis (2008). Our main explanatory variables are vertical income inequality measured by the Gini coefficient of income and the three measures of population pressure: population density, youth bulges and population growth. In addition, we consider the interaction terms between inequality and the three measures of population pressure. Following the study on routine violence by Tadjoeddin and Murshed (2007) and a later work by Murshed, Tadjoeddin and Chowdhury (2009), we include the following control variables: number of population, growth of per capita RGDP, level of per capita RGDP and its squared term.
5. RESULTS AND DISCUSSION 5.1. The Role of Population Pressure The effects of population pressure on routine violence (H1) are tested in Models 1-3 of Table 4 for each of the three indicators of population pressure, namely population density, youth bulges and population growth respectively. We use the standard model of routine violence introduced by Tadjoeddin and Murshed (2007) as the point of departure and we add the three indicators to it. We only find empirical support for the violence inducing effect of population density (Model 1).
17
In the case of population growth and youth bulges, the coefficients are insignificant; although they have expected signs (Models 2 and 3). The results do not change when we put together the three indicators of population pressure (Model 4). The significance of population density is quite logical as physical proximity increases the probability of friction. Youth bulges may become a statistically significant variable in the presence of unfulfilled expectations, such as lack of job opportunities. On the interaction terms among the three indicators of population pressure, we find empirical evidence only for the joint effect between population density and population growth (Model 6). It shows that the violence inducing effect of population density is higher in districts with higher population growth (H2a). In fact, once we include the interaction term, the variable of population density looses its statistical significance indicating the more dominant role of the interaction term. This corroborates with the findings of Urdal’s (2005) cross-country study that focuses on the higher profile internal armed conflict with the threshold of 25 battle related deaths. The above finding confirm Urdal’s (2008) claim that the level of analysis may be the source of discrepancy between cross-country studies and much of case studies regarding the conflict inducing effects of population pressure. While previous cross-country studies have only found moderate support for the idea that population pressure may lead to violent conflict,14 this study finds statistically significant evidence for the case of violence inducing effect of population density, and significant positive joint effect of population density and population growth on routine violence across districts in Java. Urdal’s (2008) study across Indian states finds similar effects of population density in the case of armed conflict and of population density-growth interaction term in the case of violent political events. National demographic aggregates, as in the case of cross-country exercise, may not capture the diversity of local population dynamics (within-country variations) very well, and such local processes may be argued to cause local, low-intensity conflicts, as in the case of routine violence. 14
See among others de Soysa (2002), Hauge and Ellingsen (1998), Theisen (2008) and Urdal (2005).
18
In a cross country study, Indonesia is only a unit of observation that lumps together the densely populated Java and the sparsely inhabited outer islands. Arguably, our study accounts for demographic diversity much better since it studies densely populated Java in a disaggregated fashion.
19
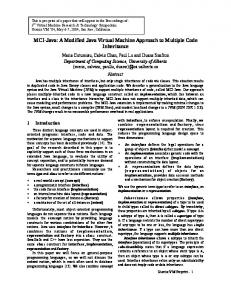
Table x.4. Routine violence and population pressure (Fixed effects negative binomial regression) 1 Pop density (000/km2)
0.069
2
3
4
**
0.087
(0.032) Youth bulges (15-24)
**
5
6
7
0.087
0.031
0.081 (0.038)
(0.038)
(0.142)
(0.042)
0.015
-0.013
-0.013
0.002
0.002
(0.023)
(0.026)
(0.033)
(0.026)
(0.032)
Pop growth (%)
0.032
0.076
0.076
-0.076
0.323
(0.052)
(0.060)
(0.061)
(0.079)
(0.317)
Density*Youth
**
0.000 (0.006)
Pop Density*Growth
0.052
***
(0.015) Youth*Pop growth
-0.010 (0.013)
Pop (million)
0.357
***
(0.108) Growth
-0.034
0.191 (0.108)
Income2
Obs Wald
2
(p-value)
***
(0.107) ***
(0.005) Income (IDR million)
0.379
-0.035
0.247 (0.106)
***
(0.106) ***
(0.005) *
0.387
-0.034
0.247 (0.105)
***
(0.109) ***
(0.005) ***
0.353
-0.032 (0.005)
**
***
0.353
***
0.334
(0.109)
***
(0.110)
-0.032
-0.034
(0.005)
(0.005)
0.154
0.154
0.198
(0.110)
(0.111)
(0.112)
***
0.337
***
(0.110) ***
-0.032
***
(0.005) *
0.158 (0.111)
-0.015
-0.016
-0.016
-0.013
-0.013
-0.014
-0.013
(0.011)
(0.011)
(0.011)
(0.010)
(0.010)
(0.010)
(0.010)
980
980
980
980
980
980
980
0.000
0.000
0.000
0.000
0.000
0.000
0.000
Note: Standard errors are in parentheses, ***, ** and * indicate 1%, 5% and 10% levels of significance respectively and each regression has a constant term.
20
5.2. The Role of Vertical Inequality We cannot place the Gini coefficient of inequality and income together as independent variables at the same time in the routine violence regression because a systematic relationship might exist between the two (the Kuznets, 1955 hypothesis). We formulate a two-stage regression process to anticipate the validity of Kuznets hypothesis on the relationship between inequality and income. The first regression is a Kuznets equation postulating an inverted-U-shaped between Gini and income; and the second one investigates the role of Gini in routine violence. We use the predicted value of Gini from the Kuznets regression to predict violence in the second stage regression. Such a system of two-stage regression tests the link between inequality and violence, and at the same time serves to check the presence the so-called Kuznets curve.
First stage: Kuznets equation
GINI it = φ0 + φ1 INCit + φ2 INCit2 + ε it
Second stage: Routine violence equation
VIOLENCE = δ 0 + δ 1 predictedGINI it + δ 2GROWTH it + POPit + ε it
Using the predicted value of Gini obtained from the Kuznets equation, we find a positive effect of inequality on routine violence, which confirms our hypothesis (Table 5, Panel B). Furthermore, we find empirical evidence supporting the Kuznets curve in Java (Table 5, Panel A). These findings hold when we employ 2SLS regression as a robustness test (Table 6) 15 . Another robustness check is done by removing an outlier district of Kota Kediri which has a
15
The use of 2SLS regression is appropriate since both equations in our simultaneous equation system are over-identified.
21
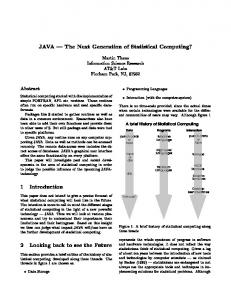
relatively very high average income.16 By doing so, the Kuznets relationship behaves according to expectations, the predicted Gini retains its significance in the random effects negative binomial estimation,17 and the 2SLS estimation also performs well.18 The result on the violence inducing effect of inequality helps to explain the Tadjoeddin and Murshed’s (2007) finding regarding the inverted-U-shaped relationship between violence and income better. That is, it seems that at an initial stage, the violence inducing effect of rising income is driven by accompanying rise in inequality as predicted by the Kuznets’ hypothesis. In other words, income effect on violence is channelled through inequality. At a higher average income level, violence starts to decline since inequality also declines. Therefore, inequality effects work at the upswing as well as at the downswing parts of the inverted-U-shaped curve of violence and income (see Figure 1). The results also imply that inequality is not tolerated beyond a certain point as hypothesized by Hirschman (1973).19 Tadjoeddin and Murshed (2007: 691) intuitively explain their finding as follows, ‘an increase in prosperity may encourage predatory behaviour in the form of private violence (akin to our concept of routine violence) by the less fortunate. Once growth progresses further, violence has to decline to sustain the security of investment, and the state has to perform regulatory functions.’
16
The extremely high per capita GDP in the district is because the city of Kediri is the home of Gudang Garam, the world’s biggest clove (kretek) cigarette maker and Indonesia’s largest cigarette producer, employing more than 40,000 workers (http://investing.businessweek.com/research/stocks/snapshot/snapshot.asp?ticker=GGRM:IJ, accessed on 21 September 2010). 17 In fact, RENB is preferable than FENB according to the Hausman test. 18 Detailed results are available from the author. 19 Hirschman (1973) explained the notion of tolerance for economic inequality through the workability of a ‘tunnel effect’. The tunnel illustration is originated from Hirschman’s explanatory analogy with traffic in a two-lane tunnel traffic jam. The traffic jam is legally confined to one lane but initially stirred into hope by movement in the second lane; eventually some drivers will illegally cross into that lane, if it seems that the traffic jam appears to be clearing there. In this illustration, the ‘tolerance’ limit is the maximum duration of how long drivers in the first lane are patient enough before they start to illegally cross the lane. Hirschman argued for the existence of a social mechanism that could contain relative deprivation or envy due to the rise in inequality. As development proceeded, some people’s fortunes improved while others were left behind, and thus inequality typically increased. But the expectations of those left behind might be raised rather than plagued by anger. Greater inequality can flag social and economic change that could be interpreted as a signal of hope even for those not immediately benefiting from development.
22
The findings of this study shed additional insights into the mechanism, namely inequality. The violence inducing effect of inequality can be interpreted as a grievance arising out of an inequitable income distribution. The relationship between routine violence and inequality, on its own, is positive; violence and growth are negatively related; population pressure and violence are positively related Our findings are similar to André and Platteau (1998) in Rwanda. Distributional conflicts over a relatively short range of inequality may combine with other causes to induce violence or its spread. For example, André and Platteau (1998) argue that although inequality nationally was not the prime source of the paroxysm of violence in Rwanda in 1994, the increasing local level intensity of distributional tension contributed to the speed with which political violence spread through Rwandan society. Like us, they also find evidence of demographic pressure adding to intensity of local social conflict and disputes. Figure x.1. Violence, income and inequality Gini Violence
Violence
0.334
IDR 13 mil
Income
A: Kuznets (1955)
IDR 11 mil
Income
B: Tadjoeddin & Murshed (2007)
Gini C: This study
Table x.5. Gini, income and violence: Two-stage regression Panel A. First stage – pooled OLS Gini Income 0.0094 *** (0.0013) Income-squared -0.0004 *** (0.0001) Obs. R-squared
980 0.054
23
Panel B. Second stage - Fixed effects NB Violence Gini-predicted value 24.266 ** (9.681) Growth -0.035 *** (0.005) Pop (mil) 0.388 *** (0.106) Obs.
980 2
Wald (p-value) 0.000 Note: Standard errors are in parentheses, ***, ** and * indicate 1%, 5% and 10% levels of significance respectively and each regression has a constant term. Table x.6. Gini, income and violence: 2SLS regression Violence Gini Growth Pop (mil)
Gini Income Income-squared
46.4997 (13.7545) -0.0752 (0.0149) 1.8642 (0.1390)
0.0013 (7.5300) -0.0004 (0.0001)
*** *** ***
*** ***
Obs. 980 Note: Standard errors are in parentheses, ***, ** and * indicate 1%, 5% and 10% levels of significance respectively and each regression has a constant term.
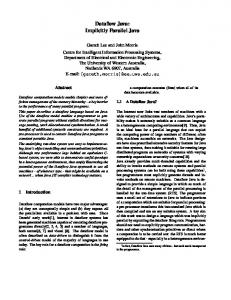
5.3. Interaction Effects: Inequality and Population Pressure The test results for hypotheses on the joint effects of inequality and the three measures of population pressure (H4) are presented in Table 7. We interact the three indicators of population pressure and the predicted value of Gini from Table 1. Support for our hypotheses is found in the case of positive joint effects between inequality and population density (Model 2, Table 7). This means that violence inducing risk of higher inequality is aggravated if it coincides with a greater population density.
24
Table x.7. Joint effects of inequality and population pressure
Gini-predicted value Growth Pop (mil) Gini-predicted*pop. growth
1 22.937 (9.957) -0.034 (0.005) 0.390 (0.106) 0.095 (0.175)
** *** ***
Gini-predicted*pop. density
2 16.1926 (10.5498) -0.0337 (0.0048) 0.3587 (0.1078)
0.0002 (0.0001)
Gini-predicted*youth
Obs.
*** ***
3 21.728 (10.545) -0.035 (0.005) 0.381 (0.107)
** *** ***
** 0.051 (0.081)
980
980
980
2
Wald (p-value) 0.000 0.000 0.000 Note: Standard errors are in parentheses, ***, ** and * indicate 1%, 5% and 10% levels of significance respectively and each regression has a constant term.
6. CONCLUSION This chapter has examined the role of population pressure and vertical inequality, and their possible joint effects on routine violence across districts in Java. It looks at violence from the perspectives of neo-Malthusian theory and social justice. These issues are highly relevant for densely populated Java. Furthermore, the effects of global climate change (e.g. rising sea level) and environmental degradation are likely to deepen the Malthusian scenario for Java. Unlike the country as a whole, the island is ethnically relatively homogenous. We employ count data panel data regression technique of 98 districts in Java during 1994-2003 period. Using population density as the indicator of population pressure, we have found empirical evidence of the neo-Malthusian conflict scenario. The effect gets worse if higher population density coincide with higher population growth. Although the role of vertical inequality in conflict has been largely discounted in empirical cross-country studies, we find empirical evidence for a violence inducing effect of vertical
25
inequality. This finding is based on the empirical validity of Kuznets hypothesis of an inverted-U relationship between inequality and income. Our finding on the inequality effect helps in explaining the inverted-U-relationship between income and violence by Tadjoeddin and Murshed (2007). The effect of income on violence is channelled through inequality. The violence inducing risk of higher inequality is aggravated if it coincides with a higher population density. Inequality induced grievances would be more intense and spread quicker in more densely populated localities. In sum, this finding points to the extremely unsafe mixture of vertical inequality and population pressure, making strategies of growth with redistribution imperative.
26
7. BIBLIOGRAPHY
Acemoglu, Daron; et al., 2008: "Income and Democracy", in: American Economic Review 98 (3):808-42. André, Catherine; Platteau, Jean-Philippe, 1998: "Land Relations under Unbearable Stress: Rwanda Caught in the Malthusian Trap", in: Journal of Economic Behaviour and Organisation 34:1-47. Barron, Patrick; Varsney, Ashutosh; Palmer, Blair; Jaffrey, Sana, 2009: “Understanding Violent Conflict in Indonesia: A Mix Method Approach”, in: Social Development Papers 117. (World Bank: Washington, DC). Barron, Patrick; Sharpe, Joanne, 2008: "Local Conflict in Post-Suharto Indonesia: Understanding Variations in Violence Levels and Forms Through Local Newspapers", in: Journal of East Asian Studies 8 (3):395-424. Barron, Patrick; Kaiser, Kai; Pradhan, Menno, 2009: "Understanding Variations in Local Conflict: Evidence and Implications from Indonesia", in: World Development 37 (3):698-713. Brass, Paul, 2003: The Production of Hindu-Muslim Violence in Contemporary India (Seattle: University of Washington Press).
Chowdhury, Anis; Islam, Iyanatul; Tadjoeddin, Mohammad Zulfan, 2009: "Indonesia’s Employment Challenges: Growth, Structural Change & Labour Market Rigidity", in: European Journal of East Asian Studies 8 (1):31-59. Collier, Paul; Hoeffler, Anke, 2004: "Greed and Grievance in Civil War", in: Oxford Economic Papers 56 (4):563-95. Cramer, Christopher, 2005. "Inequality and Conflict: A Review of an Age-Old Concern", in: Identities, Conflict and Cohesion Programme Paper 11 (Geneva: UNRISD). de Soysa, Indra, 2002: "Ecoviolence: Shrinking Pie or Honey Pot?", in: Global Environmental Politics 2 (4):1-36. Fearon, James D.; Laitin, David D., 2003: "Ethnicity, Insurgency, and Civil War", in: American Political Science Review 97 (1):75-90. Gurr, Ted Robert, 1970: Why Men Rebel (Princeton, N.J.: Princeton University Press). Hauge, Wenche; Ellingsen, Tanja, 1998: "Beyond Environmental Scarcity: Causal Pathways to Conflict", in: Journal of Peace Research 35 (3):299-317. Hibbs, Douglas A., 1973: Mass Political Violence: A Cross-National Causal Analysis. (London: Wiley). Hirschman, Albert O., 1973: "The Changing Tolerance for Income Inequality in the Course of Economic Development", in: World Development 1 (12):29-36. Homer-Dixon, Thomas F., 1991: "On the Threshold: Environmental Changes as Causes of Acute Conflict", in: International Security 16:76-116.
27
Homer-Dixon, Thomas F., 1994: "Environmental scarcities and violent conflict: Evidence from cases", in: International Security 19:5-40. Homer-Dixon, Thomas F., 1999: Environment, Scarcity, and Violence (Princeton, NJ: Princeton University Press). Horowitz, Donald, 1985: Ethnic Groups in Conflict (Berkeley: University of California Press). Huntington, Samuel P., 1996: The Clash of Civilisations and the Remaking of World Order (New York: Simon & Schuster). Huntington, Samuel P. 1968. Political Order in Changing Societies (New Haven and London: Yale University Press). Kanbur, Ravi, 2007: "Poverty, Inequality and Conflict", in: AEM Working Paper 200701: Cornell. Kaplan, Robert D., 1994: "The Coming Anarchy", in: Atlantic Monthly 273 (2):44-76. Kuznets, Simon, 1955: "Economic Growth and Income Inequality", in: American Economic Review 45 (1):1-28. Mancini, Luca, 2008. "Horizontal Inequality and Communal Violence: Evidence from Indonesian Districts", in: Stewart, Frances (Ed), Horizontal Inequalities and Conflict: Understanding Group Violence in Multiethnic Societies (London: Palgrave Macmillan). Muller, Edward N., 1997: "Economic Determinants of Democracy", in Midlarsky, M. I., Inequality, Democracy and Economic Development (Cambridge: Cambridge University Press). Murshed, Syed Mansoob; Tadjoeddin, Mohammad Zulfan, 2009: "Revisiting the Greed and Grievance Explanation for Violent Internal Conflict", in: Journal of International Development 21 (1):87-111. Murshed, Syed Mansoob; Tadjoeddin, Mohammad Zulfan; Chowdhury, Anis, 2009: "Is Fiscal Decentralisation Conflict Abating? Routine Violence and District Level Government in Java, Indonesia", in: Oxford Development Studies 37 (4):397– 421. Nafziger, E. Wayne; Auvinen, Juha, 2002: "Economic Development, Inequality, War and State Violence", in: World Development 30 (2):153-63. Olson, Mancur, 1965: The Logic of Collective Action (Cambridge MA: Harvard University Press). Østby, Gudrun; et al., 2011; "Population Pressure, Horizontal Inequality and Political Violence: A Disaggregated Study of Indonesian Provinces, 1990–2003", in: Journal of Development Studies 47(3): forthcoming. Østby, Gudrun, 2008: "Horizontal Inequalities, Political Environment and Civil Conflict: Evidence from 55 Developing Countries", in: Stewart, Frances (Ed), Horizontal Inequalities and Conflict: Understanding Group Violence in Multiethnic Societies (London: Palgrave Macmillan).
28
Papaioannou, Elias; Siourounis, Gregorios, 2008: "Democratisation and Growth", in: The Economic Journal 118:1520-51. Russett, Bruce M., 1964: "Inequality and Insurgency: The Relation of Land Tenure to Politics", in: World Politics 16:442-54. Stewart, Frances (Ed), 2008: Horizontal Inequalities and Conflict: Understanding Group Violence in Multiethnic Societies (London: Palgrave Macmillan). Stewart, Frances, 2000: "Crisis Prevention: Tackling Horizontal Inequalities", in: Oxford Development Studies 28 (3):245 - 62. Tadjoeddin, Mohammad Zulfan, 2007: "A Future Resource Curse in Indonesia: The Political Economy of Natural Resource, Conflict and Development", in: CRISE Working Paper 35. Queen Elizabeth House, University of Oxford. Tadjoeddin, Mohammad Zulfan, 2009: “Grievance, Greed and Cooperation: Localised Ethnic Strife during Indonesian Transition”, Paper for the 5th Australasian Development Economic Workshop (ADEW), University of Melbourne, 4-5 July. Tadjoeddin, Mohammad Zulfan; Murshed, Syed Mansoob, 2007: "Socio-Economic Determinants of Everyday Violence in Indonesia: An Empirical Investigation of Javanese Districts, 1994-2003", in: Journal of Peace Research 44 (6):689-709. Tadjoeddin, Mohammad Zulfan; Suharyo Widjajanti, I. Suharyo; Mishra, Satish, 2001: “Regional Disparity and Vertical Conflicts in Indonesia”, in: Journal of the Asia Pacific Economy 6 (3): 283-304. Theisen, Ole Magnus, 2008: "Blood and Soil? Resource Scarcity and Internal Armed Conflict Revisited", in: Journal of Peace Research 45 (6): 801-818. Urdal, Henrik, 2005: "People vs. Malthus: Population Pressure, Environmental Degradation, and Armed Conflict Revisited", in: Journal of Peace Research 42 (4):417-34. Urdal, Henrik, 2006: "A Clash of Generations? Youth Bulges and Political Violence", in: International Studies Quarterly 50:607-29. Urdal, Henrik, 2008: "Population, Resources and Political Violence: A Sub-national Study of India 1956-2002", in: Journal of Conflict Resolution 52 (4):590-617. Varshney, Ashutosh; Tadjoeddin, Mohammad Zulfan; Panggabean, Rizal, 2008: "Creating Datasets in Information-Poor Environments: Patterns of Collective Violence in Indonesia (1990-2003)", in: Journal of East Asian Studies 8 (3):361–94. Varshney, Ashutosh, 2002: Ethnic Conflict and Civic Life: Hindus and Muslims in India (New Haven, US, and London, UK: Yale University Press). Welsh, Bridget, 2008: "Local and National: “Keroyokan” Mobbing in Indonesia", in: Journal of East Asian Studies 8 (3):473-504. Wilkinson, Steven, 2004: Votes and Violence: Electoral Competition and Ethnic Riots in India (Cambridge, U.K.: Cambridge University Press).
29
Appendix x.1. Gini and PC RGDP by district in Java West Java
Gini 2003
PCRGDP 2005 (Indonesia=100)
01. Bogor 02. Sukabumi 03. Cianjur 04. Bandung 05. Garut 06. Tasik Malaya 07. Ciamis 08. Kuningan 09. Cirebon 10. Majalengka 11. Sumedang 12. Indramayu 13. Subang 14. Purwakarta 15. Karawang 16. Bekasi 71. Kota Bogor 72. Kota Sukabumi 73. Kota Bandung 74. Kota Cirebon 75. Kota Bekasi
0.279 0.260 0.258 0.260 0.274 0.302 0.313 0.246 0.249 0.269 0.296 0.311 0.240 0.241 0.242 0.231 0.341 0.227 0.287 0.322 0.343
66 42 41 68 50 43 48 34 37 35 58 136 51 83 101 217 43 65 119 174 76
Central Java 01. Cilacap 02. Banyumas 03. Purbalingga 04. Banjarnegara
0.273 0.326 0.281 0.258
294 30 28 35
05. Kebumen 06. Purworejo
0.288 0.264
23 38
Central Java (Cont’)
Gini 2003
07. Wonosobo 08. Magelang 09. Boyolali 10. Klaten 11. Sukoharjo 12. Wonogiri 13. Karanganyar 14. Sragen 15. Grobogan 16. Blora 17. Rembang 18. Pati 19. Kudus 20. Jepara 21. Demak 22. Semarang 23. Temanggung 24. Kendal 25. Batang 26. Pekalongan 27. Pemalang 28. Tegal 29. Brebes 71. Kota Magelang 72. Kota Surakarta 73. Kota Salatiga 74. Kota Semarang 75. Kota Pekalongan 76. Kota Tegal
0.294 0.268 0.283 0.331 0.259 0.265 0.297 0.314 0.295 0.242 0.240 0.244 0.234 0.278 0.290 0.268 0.260 0.286 0.269 0.269 0.274 0.261 0.250 0.299 0.286 0.283 0.303
24 32 40 46 54 28 56 32 21 24 34 37 207 38 26 58 32 52 36 38 27 22 33 81 87 59 128
0.233 0.235
70 48
PCRGDP 2005 (Indonesia=100)
Source: Calculated from BPS data
30
Appendix x.1. Gini and PC RGDP by district in Java (cont’) East Java 01. Pacitan 02. Ponorogo 03. Trenggalek 04. Tulungagung 05. Blitar 06. Kediri 07. Malang
Gini 2003 0.274 0.309 0.317 0.314 0.290 0.292 0.301
PCRGDP 2005 (Indonesia=100) 26 34 26 69 49 39 55
08. Lumajang 09. Jember 10. Banyuwangi 11. Bondowoso 12. Situbondo 13. Probolinggo 14. Pasuruan 15. Sidoarjo 16. Mojokerto 17. Jombang 18. Nganjuk 19. Madiun 20. Magetan 21. Ngawi 22. Bojonegoro 23. Tuban 24. Lamongan 25. Gresik
0.296 0.252 0.281 0.272 0.288 0.287 0.272 0.273 0.280 0.266 0.275 0.293 0.330 0.278 0.250 0.275 0.239 0.284
52 43 57 29 54 59 43 148 58 48 44 42 49 35 47 51 35 123
East Java (Cont') 26. Bangkalan 27. Sampang 28. Pamekasan 29. Sumenep 71. Kota Kediri 72. Kota Blitar 73. Kota Malang 74. Kota Probolinggo 75. Kota Pasuruan 76. Kota Mojokerto 77. Kota Madiun 78. Kota Surabaya 79. Kota Batu
Banten 01. Pandeglang 02. Lebak 03. Tangerang 04. Serang 71. Kota Tangerang
Gini 2003 0.290 0.266 0.242 0.281 0.254 0.295 0.319
PCRGDP 2005 (Indonesia=100) 37 26 26 49 899 51 143
0.245 0.244 0.258 0.269 0.358 -
86 61 101 66 274 64
0.251 0.249 0.363 0.270 0.263
36 33 58 91 163
Source: Calculated from BPS data
Appendix x.2. Summary statistics, routine violence Variable Violence (incidents) Growth of income (%) Income (Rp. million) Population (million) Pop. Growth (%) Pop. Density (/km2) Gini Youth (%)
Obs
Mean 980 980 980 980 980 980 980 980
2.0 3.6 1.7 1.1 1.1 2,283.3 0.3 20.3
Std. Dev. 3.0 6.4 2.4 0.7 1.4 3,251.7 0.0 2.7
Min 0 -30.6 0.5 0.1 -0.6 332 0.2 13.3
Max 21 64.9 26.1 5.2 10.7 22,182 0.5 30.6
31
Appendix x.3. Matrix of correlations, routine violence Violence Violence Growth of income Income Population Pop. Growth Pop. Density Gini Youth
Growth
Income
Pop
Pop. growth
Pop. density
Gini
1 0.136 -0.171 0.130 0.122
1 0.074 -0.006 0.444
1 0.207 0.5811
1 0.239
Youth
1 -0.168 0.006 0.458 0.087 -0.016 -0.035 0.118
1 0.072 -0.023 0.143 0.061 0.105 0.144
1 -0.071 0.056 0.235 0.123 0.270
1
32