SOLAR RESOURCE DATABASES VS ARITHMETIC MEANS – RESULTS OF A BENCHMARKING EFFORT FOCUSING ON GERMANY Matthias Egler e4r – engineers for renewables GmbH, Poststr. 11/12, 10178 Berlin / Germany Phone: +49 30 4372 5105-8, e-mail:
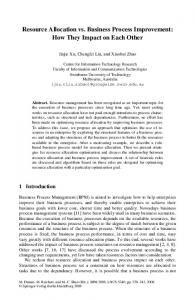
[email protected] INTRODUCTION To establish the solar resource of a given location as accurately as possible, continuous evaluation of available databases and approaches against reference data is expedient. For locations in Germany, reliable ground-measured Global Horizontal Irradiation (GHI) data are available through the Climate Data Center (CDC) [1] of Germany’s national weather service Deutscher Wetterdienst (DWD). In terms of approaches, market practice is to either use or select a single database or to determine an arithmetic or weighted mean including several different datasets. REFERENCE DATA In this work, initial temporal resolution of the selected DWD data product is hourly values, which includes records of 56 weather stations. Considering a reference period of 2007 to 2016 and a minimum data availability of monthly values of 50% during this time reduces the number to a total of 24 reference locations, which are displayed in Figure 1.
Figure 1: Spatial distribution of the reference locations (green dots) over Germany
1
SOLAR RESOURCE DATABASES VS ARITHMETIC MEANS – RESULTS OF A BENCHMARKING EFFORT FOCUSING ON GERMANY Matthias Egler e4r – engineers for renewables GmbH, Poststr. 11/12, 10178 Berlin / Germany Phone: +49 30 4372 5105-8, e-mail:
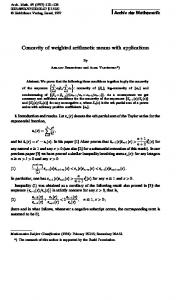
[email protected] The data availability has been established starting with a review of the hourly time series taken from CDC. Months lacking more than 5 % of the daytime data points were rejected. Otherwise, monthly sums were made including an adjustment for reduced data availability, if necessary. Finally, the available monthly data were taken to establish monthly means and resulting annual sum, if the overall count provides more than 50% of the theoretical number of months for the reference period 2007 to 2016. In addition, variability of annual values is established using the resulting complete years. DATABASES AND ARITHMETIC MEANS The databases included in the benchmarking are PVGIS-CMSAF [2], PVGIS-SARAH [2], CAMS-RAD [3] and NASA POWER 1/2° x 1/2° [4]. The periods covered vary, but in each case data matching the reference period is available. In case of PVGIS-CMSAF, PVGISSARAH and CAMS-RAD time series of hourly values have been retrieved. NASA POWER 1/2° x 1/2° is available in daily resolution only. Four different arithmetic means were considered, tilted as follows and with the following databases included: • Mean – PVGIS (PVGIS-CMSAF and PVGIS-SARAH) • Mean – HighRe (PVGIS-CMSAF, PVGIS-SARAH and CAMS-RAD) • Mean – All (PVGIS-CMSAF, PVGIS-SARAH, CAMS-RAD and NASA POWER 1/2° x 1/2°) • Mean – PVGIS-NASA (PVGIS-CMSAF, PVGIS-SARAH and NASA POWER 1/2° x 1/2°) APPROACH AND RESULTS Root Mean Square Error (RMSE) is considered main indicator and metric with regards to general performance and accuracy. Overall relative RMSE has been determined using the bias between the annual long-term values or GHI variability provided by the databases or arithmetic means against the corresponding reference value at each location. In addition, global minimum and maximum deviation, Mean Bias Error (MBE) and Mean Absolute Error (MAD) were calculated and taken into consideration. Of note, to ensure like-to-like comparison, the long-term values of each database and arithmetic mean are matching the available months in the reference dataset. Figure 2 presents results regarding long-term annual GHI values.
Figure 2: Global absolute maximum deviation (dashed lines) and relative RMSE (bars) for each single database and various arithmetic means with regards to long-term annual values.
2
SOLAR RESOURCE DATABASES VS ARITHMETIC MEANS – RESULTS OF A BENCHMARKING EFFORT FOCUSING ON GERMANY Matthias Egler e4r – engineers for renewables GmbH, Poststr. 11/12, 10178 Berlin / Germany Phone: +49 30 4372 5105-8, e-mail:
[email protected] All, but one arithmetic mean features smaller relative RMSE than the four different databases. Same is true with regards to absolute maximum deviation. In relation to monthly long-term data, very similar pattern can be observed, however with slightly elevated numbers due to the smaller temporal granularity. The main performance indicator in this case is the overall average of each location’s RMSE determined using the monthly biases. Finally, with regards to inter-annual GHI variability the performance has been assessed using RMSE, overall negative and positive deviation as well as regression coefficient R². Figure 3 displays the findings in relation to annual GHI variations.
Figure 3: Relative RMSE as well as negative and positive deviation of each single database and arithmetic mean with regards to annual GHI variability. Similarly to the findings regarding long-term GHI values, the databases and arithmetic means show a widely similar performance. However, the arithmetic mean consisting of PVGIS-CMSAF, PVGIS-SARAH and CAMS-RAD seem to be the most sensible combination to establish the year-on-year variability of the global horizontal solar resource, as it features both a small relative RMSE and the most uniform deviations. [1] [2] [3] [4]
Climate Data Center of Deutscher Wetterdienst: http://www.dwd.de/DE/klimaumwelt/cdc/cdc_node.html European Commission Joint Research Institute, Photovoltaic Geographical Information System (PVGIS): http://re.jrc.ec.europa.eu/pvg_tools/en/tools.html Copernicus Atmosphere Monitoring Service (CAMS) radiation (RAD) service: http://www.soda-pro.com/en_GB/web-services/radiation/cams-radiation-service NASA Prediction of Worldwide Energy Resource (POWER), Higher Resolution Daily Time Series by Location: https://power.larc.nasa.gov/cgi-bin/hirestimeser.cgi
3