Validity of Inter-Laboratory Drugs Testing: Comparison on inter-laboratory urinalysis results against ten illicit drugs
Natalie Lu* Substance Abuse and Mental health Administration Department of Health and Human Services 1 Choke Cherry Road Rockville, MD 20857 Bruce Taylor Police Executive Research Forum Washington, DC 20531
Version: December 10, 2006
Disclaimer: The points of view in the paper are of the author and do not necessarily represent the official position or policies of the U. S. Department of Health and Human Services, U.S. Department of Justice or Police Executive Research Forum. *For correspondence: Natalie T. Lu, Substance Abuse and Mental health Administration, Department of Health and Human Services, 1 Choke Cherry Road, Rockville, MD 20857; 240-276-1582;
[email protected]. Abbreviations: ADAM, Arrestee Drug Abuse Monitoring; DRI, Diagnosis Reagent Inc.; EMIT, enzymes multiplied immunoassay testing; GC-MS, gas chromatography-mass spectrometry; NIJ, National Institute of Justice; PCI, PharmChem Laborotories, Incoprated; PCP, phencyclidine; STL, Scientific Testing Laboratory.
1
Validity of Inter-Laboratory Drugs Testing: Comparison on inter-laboratory urinalysis results against ten illicit drugs
Abstract
Drug testing through urinalysis provides a relatively inexpensive method for detecting illicit drug use. Since there are many drug testing laboratories on the market using different screening assays, the validity of the drug testing results from different laboratories is always a concern. The purpose of this paper is to examine how urinalysis results may change when two independent laboratories test the same drugs using different assays and whether the changes are within acceptable ranges. A total of 2,237 urine samples were collected from eleven major cities in the United States in 2003 through the Arrestee Drug Abuse Monitoring (ADAM) program. Samples were shipped to a central laboratory (PharmChem Laborotories, Incoprated – PCI, Lab 1) and split there. Half of the samples were sent to another independent laboratory (Scientific Testing Laboratory – STL, Lab 2) for double testing against the same nine drugs with the same cutoff levels: amphetamine, barbiturates, benzodiazepines, marijuana, cocaine, methadone, opiate, phencyclidine, and propoxyphene. All amphetamine positives were confirmed by Gas chromatography-mass spectrometry (GC-MS) to test for methamphetamine as the 10th drug. The first laboratory used an immunoassay DRI (Diagnosis Reagent Inc.) EMIT (Enzyme Multiplied Immunoassay Testing), while the second laboratory first used Roche Abuscreen Online assays to test for positives and all positives were re-screened by Syva’s EMIT. Results are combined, analyzed and presented in this paper. The study results revealed very high concordance rate between our two test laboratories. One concern that emerged was for the marijuana test, a relatively lower concordance rate of 97.9 percent was obtained, with the second laboratory finding fewer marijuana positive specimens. Several possible factors may account for this phenomenon. First, the time gap between the two laboratory tests may have reduced the marijuana concentration in the urine specimens due to the hydrophobic property of the drug. Second, the storage and handling procedures may have affected the marijuana concentrations during the shipment of the specimens to the second laboratory. Third, it is also possible that lab effects contributed to the differences in the results between the two labs. A controlled study to further investigate and control for the sources of these differences is warranted.
2
Introduction Epidemiological surveys or self-reports are frequently used by criminal justice researchers and criminal justice agencies to explore the relationship between drugs and crime (Wish, E. and Gropper, B. 1990), the connection between consumption of illicit drugs and a variety of social and health problems, to estimate prevalence of drug abuse, and to monitor emerging drugs over time. Prior research suggests that participants generally underreport their drug use activities and use levels (Lu, Taylor, and Riley, 2001; Magura, and Kang. 1997; Magura, and Kang, 1996; Fendrich, and Xu. 1994; Zanis, McLellan, and Randall.1994; Wish, E.D., Johnson, B., Strug, D., Chedekel, M., and Lipton, D.S. 1983). Especially among high-risk groups, such as an arrestee population, research indicates that over half of all arrestees who test positive for certain drugs denied their drug use (Lu, Taylor, and Riley. 2001; Mieczkoski, T., Barzelay, D., Gropper, B., Wish, E. 1991). Thus, the accuracy of self-reports of illicit drug use is relatively low. Additionally, when self-reports are used as a sole source for drug estimation, more concerns are raised due to various factors such as interviewer bias, reporting error, and participants’ fear or unwillingness to admit drug use (Mieczkowski, Mumm, and Connick. In press; ADAM annual report, 1987-1998; Hser, Maglione, and Boyle, 1999; Mieczkowski, and Newel. 1994). Accurate assessments of drug use are important, as the gathered information is or will be used by researchers, practitioners, public health officials, and policy makers. To improve the accuracy of self-reports, drug testing was introduced as a validation method to confirm self-reports of drug use. For most drugs of abuse, urinalysis (UA) can provide accurate independent scientific 3
verification of various drug uses for the past 2-3 days. For marijuana, urinalysis can sometimes provide accurate scientific verification for the past one week to one month.
The Arrestee Drug Abuse Monitoring (ADAM) program of the National Institute of Justice (NIJ), United States Department of Justice (DOJ), was an epidemiological system that estimated the prevalence of drug use among a high-risk group of adult male and adult female arrestees on a quarterly basis. The estimation was generated based on the results of screening results for a panel of nine drugs using an inexpensive and relatively accurate screening assays such as EMIT or similar methods (Dextraze , Griffiths, Camara, Audette, and Rosner, 1989; Fenton, Schaffer, Chen, and Bermes, 1980; Frederick, Green, and Fowler, 1985; Jones, Adamd, Martel, and Rousseau, 1985; Romberg and Past, 1994; Verebey, Mule, and Alrazi, 1986; Walia, and Cook, 1991; Weaver, Gan, Allen, Baugh, Liao, Liu, Langner, 1991; Willson, Kogan, Pierson, and Newman, 1983). Confirmation by Gas Chromatography-Mass Spectrometry (GC-MS) was performed only when it was important to distinguish between two or more drugs of interest to the public. For example, the amphetamine screening assay detects both amphetamines and methamphetamines, as they belong to the same drug class and share very similar chemical structures. Therefore, GC-MS was performed on all urine specimens screening positive for amphetamines to verify the existence of methamphetamine. As is the nature of government programs, government regulations require all contracts to be openly solicited periodically. Consequently the ADAM program had 4
several different drug testing laboratories in the past decade. As the program’s goal was to estimate drug use across the nation for research purposes, many of the required procedures and documentation implemented in the drug testing industry were inapplicable to the ADAM program (Riley, Lu, Meeker, Lo, Fortner, and Taylor, 2001). For example, drug testing for pre-employment screening or court-based testing requires substantial documentation and review of issues such as chain-of-custody procedures to record the transaction of samples between collection and transportation (Vogl and Bush, 1997). In workplace and correctional programs, specimens that screen positive are either screened again or sent directly to confirmation. Results are then typically reviewed by a medical review officer (MRO) who can determine whether factors such as prescription medicines, diet and so forth affected the results. In other settings, specimens must generally be tested in a timely manner so that degradation and decay do not become issues. In addition, each step in the process, from collection to mailing and testing is documented so that the chain of custody is unbroken. Because workplace and correctional drug testing typically goes through many layers of review and confirmation, they are presumably less vulnerable to marginal differences in laboratory practices than epidemiological and/or research programs (Riley, Lu, and Taylor, 2000). In contrast, few of these conditions apply to epidemiological and/or research testing. For the epidemiological or research purpose, confirmation testing is done relatively rarely to reduce the cost and MROs do not routinely review and confirm positive results. Epidemiological testing is therefore dependent on the screening method and thus potentially more vulnerable to marginal differences in testing methods 5
and changes in operating procedures (Armbruster, Schwarzhoff, Pierce, and Hubster, 1994; Fraser and Meatherall, 1996; Kintz, Machart, Jamey, and Mangin, 1995). To shed some light on the drug testing issues relevant to epidemiological/research programs, staff at NIJ undertook a research exercise during the last change in laboratory service providers. One goal of the project was to examine whether drug test results differ substantially from laboratory to laboratory if testing is conducted using methods and handling procedures that prevail in an epidemiological/research setting, rather than workplace or correctional setting. Factors that might plausibly influence testing results include subtle changes in test methods, including differences in the antibodies used to bind to the drug metabolites and in the reagents used to identify the bound antibodies. A second goal of the project was to assess whether the time of testing and testing labs were influencing drug test results. This suspected impact, while not specific to any given pair of laboratory contractors, was brought to light as a function of awarding a drug-testing laboratory contract for the ADAM program. Under the old data collection methods for ADAM program, which coincided with the testing conducted by ADAM’s previous laboratory contract holder (Lab 1 in this paper), specimens were not shipped for analysis until the end of the data collection period (end of a 2-week period). In contrast, under the new contract, specimens were required to be sent for testing on a daily or every other day basis. Researchers (Barrett DA, Dyssegaard AL, Shaw PN. 1992; von Euler M, Villen T, Svensson JO, and Stahle L., 2003), for example, discovered that small changes in the pH of urine samples can destroy metabolites such as 6-monoacetylmorphine (6-MAM) 6
that are used to confirm heroin use, and that pH is in turn affected by temperature and other storage conditions. Hence, one goal of the project was to determine if there were differences in test results that could be attributed to the elapsed time from collection to testing. The third goal of the project was to explore whether age, race/ethnicity, and location have any association with the discordant rates for drug testing results. Our last goal was to examine the concordance rates by three key variables that are often associated with higher drug use rates: age, race/ethnicity and location (Lu and Taylor, 2005). That is, we explore whether there are differences in discordant rates across any of the major subgroups that are likely to be explored by researchers interested in studying drug use patterns. Methods Study Design The urine samples were collected in the last quarter of 2003, as part of the regular data collection process of the Arrestee Drug Abuse Monitoring (ADAM) program, operated by the National Institute of Justice (NIJ).1 ADAM was an ongoing, voluntary and anonymous data collection program of interviewing and urinalysis testing of detained arrestees. The program consisted of 35 sites across the United States. For this study, eleven ADAM sites were selected in 2003 based on their geographic locations and sample sizes as summarized on Table 1: Albuquerque, Birmingham, Boston, Denver, Houston, Las Vegas, Los Angeles, Miami, New York, Philadelphia, and Tampa2.
1
The ADAM Program ceased operations and was closed in 2004. 2 Tampa was never an official ADAM data collection site; it ran as an NIJ beta-testing site for the development of instrumentation and drug testing technologies.
7
Site Name ALBUQUERQUE BIRMINGHAM BOSTON DENVER HOUSTON LAS VEGAS LOS ANGELES MIAMI NEW YORK PHILADELPHIA TAMPA Totals Percentage
Gender
Table 1. Summary of the data collection sites, adult male sample numbers and the adult male final samples.
AM AM AM AM AM AM AM AM AM AM AM
Samples collected from sites 165 172 96 183 85 245 244 284 209 197 357 2237 100.00
Sample Samples have in Lab 1 UA in Lab 1 165 164 172 169 96 95 183 182 85 84 245 243 244 238 284 280 209 208 197 195 357 356 2237 2214 100.00 98.97
Specimens Samples Final Received Missing Cases by Lab 2 165 171 96 183 77 245 166 202 209 196 357 2067 92.40
1
8 78 82 1 170 7.68
164 168 95 182 76 243 161 198 209 194 357 2047 91.51
This research project involved double testing a total of 2,237 specimens collected from these eleven ADAM sites. Respondents represented arrestees from all crime categories, including property crimes, drug crimes and violent crimes. The data collection sites were selected on the basis of expected diversity of drug prevalence rates and geographic locations in the United States (U.S.). Birmingham and Miami have historically had relatively high cocaine positive rates, while Philadelphia and New York have historically demonstrated relatively high opiate positive rates. Albuquerque, Denver, Las Vegas and Los Angeles have methamphetamine positive rates of at least 10 percent. To ensure that an adequate number of amphetamine positives and methamphetamine confirmations were obtained, over 2,000 urine specimens were 8
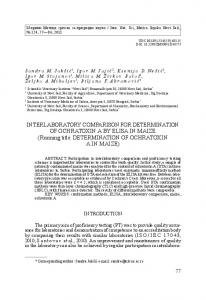
subjected to double testing. In most of the ADAM sites, we only had access to male facilities. In the remaining ADAM sites, even when we had access to female facilities, the number of females who agreed to the interview and urine collection was relative low. Due to the low number of urine samples collected, the sites sometimes decided to delay the shipment of the urine samples to our central laboratory until a large number of urine samples were collected. To reduce the effects of sample decay on our testing results, we decided to only use male samples for this study. Most of the sites contributed about 200 cases for this research, analyzed by both of our study laboratories, with Houston presenting the fewest specimens (n= 76) and Tampa presenting the largest number of specimens (n= 357). Figure 1 summarizes the number of specimens that were selected for double testing and the attrition that occurred post-selection. Of the 2,237 specimens collected, over 90 percent were tested in both laboratories (n= 2,047). The specimens collected for this study were taken only from adult males (AM)3. The specimens were collected under the field conditions that prevailed at that time and were sent first to the incumbent laboratory that held the testing contract. This was the incumbent laboratory’s last quarter of responsibility for testing specimens.
3 We included only males in our sample, for the other demographic groups of juveniles and women used a self-selected sampling method. The ADAM program did a very good job representing the adult male arrestee population for each of its participating counties, through traditional random sampling methods. The juvenile and female population of arrestees used a less rigorous sampling approach. To avoid any potential introduction of bias into our study we used only the adult male population urine specimens for our study.
9
Figure 1. Flowchart for adult male sample selection and attrition for validity study 2,237 specimens collected
Shipped
2,237 received at the Lab 1 (100 percent)
Split & send half to Lab 2 170 cases damaged during shipment (7.7 percent)
2,237 tested in the Lab 1 (100 percent)
2,067 tested by Lab 2 (92.6 percent)
Merge 2 UA data
2,047 specimens
Drug Testing Once the specimens were received at the incumbent laboratory (Lab 1), they were split into two parts. One part of the specimen was retained at the laboratory while the other part was shipped immediately to the second laboratory (Lab 2). All urine 10
specimens were screened for the following nine drugs: amphetamine, barbiturates, benzodiazepines, marijuana, cocaine, methadone, opiate, phencyclidine, and propoxyphene (see Table 2 for detailed cutoff levels for each of these nine drugs). All amphetamine positives were confirmed by gas chromatography-mass spectrometry (GC-MS). Table 2. Drugs in the screening panel with the corresponding cutoff levels DRUGS
CUTOFF LEVELS (ng/ml)
Amphetamines
1000
Barbiturates
300
Benzodiazepines
300
Cannabinoid
50
Cocaine
300
Methadone
300
Opiates
300
Phencyclidine
25
Propoxyphene
300
At the incumbent laboratory, screening was conducted using enzymeimmunoassay testing with EMIT II kits and reagents obtained from Syva-Behring Corp. Specimens that screened positive were stored at -700C and specimens that screened negative were stored at 40C. At the second laboratory, specimens were tested against the same nine drugs with the same cutoff level for each drug. The second laboratory first used Roche Abuscreen Online assays to screen for positives of any drugs of abuse and all positives were confirmed by Syva’s EMIT. Syva’s EMIT kits were developed based on a similar 11
theory as that of DRI EMIT II, but they are not identical. Both laboratories followed the procedures and cut-off levels according to the Guidelines for Federal Workplace Drug Testing Programs (Rubenstein, Schneider, and Ullman, 1972). The average time interval between the first and second testing was approximately one and half months. Specimen collection procedures Urine specimens were obtained from booked arrestees with the assurance that the information would be kept confidential and would not be used to influence the outcome of their arrest. An informed consent statement was read to all the participants that requested their voluntary participation in the study. To obtain participation, interviewers approached selected arrestees, read an informed consent statement and, assuming the respondent agreed to participate, administered an approximately 30 minute questionnaire. At the conclusion of the interview, the arrestee was escorted to a bathroom where a urine specimen was requested and provided. The collection of the specimen was not observed. During the study period, specimens were collected over an approximate two-week period. Specimens were then shipped as a group to the laboratory for analysis at the end of the data collection period or every other day. In some cases several weeks elapsed between specimen collection and testing. Refrigeration was not provided for specimens during data collection. Data collection teams stored the specimens in locations that they determined to be convenient and safe. Results and Discussions Main Comparisons Between the Two Laboratories 12
More than 98.8 percent of the specimens had the same testing results between laboratories. Out of 2,047 specimens that were double tested, 2,019 tested the same in both laboratories for all ten drugs (9 screening drugs plus methamphetamine). Table 3 shows the aggregate concordance rates for the 10 tested drugs. The two laboratories had the highest concordance rate in testing for propoxyphene (17 positive cases) at 100 percent, meaning that both laboratories detected the same positive and negative cases in all instances. Concordance for the other nine drugs was also high at over 98 percent, except for marijuana (94.7 percent). _________________________________________________________ SEE TABLE 3 IN APPENDIX 1 _________________________________________________________ As shown in Table 3, the overall specificity rate (the percentage of true negatives) was very high in this study (98.6 percent on average across all 10 drugs), with only one drug dipping below 98 percent (marijuana at 91.4 percent). The sensitivity rate (the percentage of concordant positives) was generally fairly high, with the exception of the results for barbiturates (40 percent) where the overall positive for barbiturates was low with only two positive specimens for barbiturates in Lab 2 and five positives in Lab 1. In view of total positive results among the 2,047 specimens against the ten drugs, Lab 1 had a total of 2,310 positive tests for one of the ten tested drugs, with Lab 2 having 2,103 positive tests (see Table 3). Here, the numbers of positive tests (2,310 for Lab 1 and 2,103 for Lab 2) are higher than that of the total specimen number of 2,047 as one specimen can be tested positive for multiple drugs. In most of 13
the discordant cases (n=244), Lab 1 had a positive test on a specimen while Lab 2 having a negative test for the same specimen. For a small number of cases (n=37), the opposite occurred (i.e., Lab 1 had a negative test while Lab 2 having a positive test). A total of 281 discordant cases (244 + 37) were identified at the end of double testing. In total, we had 2,047 individual drug test results to compare across the two laboratories (i.e., 2,047 specimens were tested for 10 drugs) with only 281 of these results were not identical. The largest source of discrepant cases were found for marijuana (109 specimens were tested positive at the first laboratory for marijuana but negative at the second). The balance of discrepant cases were scattered mainly among amphetamines/methamphetamines (n=59), benzodiazepines (n=33), cocaine (n=28), and opiates (n=36). The discordant results tended to go in one direction (that is, one lab tends to always detect a particular drug and another fails to detect that drug) and cluster by drug, suggesting that there are procedural or operational issues in effect. In 109 of the 110 instances where the laboratories failed to agree on marijuana test results, it was because the first laboratory detected marijuana and the second did not. Table 3 shows that the sensitivity found in the study (the percentage of specimens found positive at lab 1 that were also found positive at lab 2) for marijuana was 87.8 percent. Among the arrested population, marijuana has approximately a one-third prevalence rate, resulting in an approximate 4 percentage point difference in marijuana prevalence between the two laboratories (33 percent to 29 percent). 14
In the case of the marijuana-positive specimens, there was directionality: the first laboratory detected and the second failed to detect. Many factors could have accounted for this discrepancy. Two possible factors are time effects and lab effects. Time effects refer to a situation in which the drug was present in the samples in sufficient concentration to be detected by the first laboratory. However, by the time that the sample was tested at the second laboratory (more than a month later) the drug concentration had decreased. Lab effects refer to a situation in which the second lab was unable to detect the drugs as efficiently as the first one (e.g., differences in machinery and/or screening assays).4 Previous studies (Armbruster, Schwarzhoff, Hubster, and Liserio, 1993; Paul, McKinley, Walsh, Jamir, and Past, 1993) have demonstrated that 11-nor-∆9tetrahydrocannabinol-9-carboxylic acid (THC) is subject to adhering to non-aqueous surfaces. THC, the compound that is used to determine whether marijuana has been consumed, is hydrophobic. That is, THC does not dissolve well in water (urine) and may therefore migrate to non-aqueous surfaces such as the sides of bottles in a process called adherence. If this occurs, the concentration of the drug in the urine specimen will be reduced, perhaps below positive cut-off levels. Freezing has been demonstrated to increase adherence losses (Paul, McKinley, Walsh, Jamir, and Past,
4 However, another possibility is that the Lab 1 results may be based on a looser calibration of the instrumentation that led to a misidentification of more below cut-off assay results as positive. That is; in some cases the problem may not be with Lab 2 but entirely with Lab 1. To determine if this were true one would need to submit laboratory prepared samples to both labs to gauge their accuracy in setting the cutoff levels in their detection instruments.
15
1993). The specimens used in this project were not frozen, but the impact of refrigeration is not clear. A review of the literature suggests that for marijuana, time and adherence are major concerns for detecting the correct concentration of marijuana in urine. It is possible that adherence may have occurred between testing at the first laboratory and the second, resulting in a lower marijuana detection rate at the second lab. However, our study design cannot distinguish time effects from lab effects. We cannot rule out the possibility that lab effects are responsible for the discrepancy in the results. The next sets of tables (4, 5 and 6) examine the concordance rates by three key variables that are often associated with higher drug use rates: age, race/ethnicity and location (Lu and Taylor, 2005). We examine differences across these three key variables to assess the practical implications of the results. That is, we want to examine if there are differences in discordant rates across any of the major subgroups that are likely to be explored by researchers interested in studying drug use patterns. This is a concern, for the ADAM sample size can get fairly small when looking at rates of drug use within certain subgroups. For example, researchers interested in comparing drug use rates across different age groups need to be aware of any differences that might exist due to the change in laboratories from one period of time to the next. Comparisons Between the Two Laboratories by Age of Arrestee Providing the Specimen Overall we found a fair amount of variability in drug use rates based on age (see Table 4), with the youngest group (