The construction of a completely transferable spectral library is an almost impossible task. Even if all spectrophotometers measured 'perfect' spectra, there is still ...
An interlaboratory trial to study the transferability of a spectral library for the identification of solvents using near-infrared spectroscopy Weng Li Yoon,* Roger D. Jee and Anthony C. Moffat Centre for Pharmaceutical Analysis, The School of Pharmacy, University of London, 29-39 Brunswick Square, London, UK WC1N 1AX Received 19th July 2000, Accepted 10th August 2000 First published as an Advance Article on the web 4th September 2000
An interlaboratory trial was performed to assess the transferability of a near-infrared spectral library for the identification of 15 common solvents. Ten laboratories, recruited from the pharmaceutical industry and academia, participated. Instruments were of both diffraction grating and Fourier transform types using a wide range of sampling accessories which included fibre optic probes fitted with transflectance caps and direct transmission modules. One hundred and seventy three solvent spectra were returned to the organising centre, of which 139 were internal and 34 external to the spectral library. Second-derivative spectra of the solvents over the wavelength range 1136–2000 nm were compared against a master reference library using correlation in wavelength space with the critical value of r set to > 0.97 for a positive identification. To compare spectra to the master library, purpose-written software was needed to circumvent problems of incompatibility between the software of different instrument manufacturers. Spectra originally recorded in wavenumber were first converted to equally spaced data points in wavelength using cubic spline interpolation. In the majority of cases high correlations (r > 0.99) were obtained for solvents included in the library and identified correctly. When r @ 0.97 the causes were traced to incorrect labelling, sample contamination or the use of an uncalibrated instrument. Apart from industrial methylated spirits 74 OP, all solvents external to the library were correctly identified as unknowns.
Introduction In a recent paper, a near-infrared (NIR) spectral library and procedure for the identification of 15 common solvents were demonstrated to be transferable between different instruments.1 Second-derivative absorbance spectra over the wavelength range 1136–2000 nm gave the optimum conditions for distinguishing between the solvents using correlation in wavelength space as the identification algorithm. It has long been recognised that a collaborative trial is an important part in validating the robustness of any analytical procedure owing to the multitude of factors which can affect measurements when made in different laboratories and with different operators.2 Here are reported the results of an interlaboratory trial to test the robustness of the method and spectral library when used in different laboratories. The construction of a completely transferable spectral library is an almost impossible task. Even if all spectrophotometers measured ‘perfect’ spectra, there is still the problem of how to store the data, number of data points, wavelength or wavenumber scale, number of significant figures, file format, etc. For a library to be useful it must be accessible to the user. Proprietary software packages used for controlling instruments and analysing data tend to have their own unique file formats. Facilities for exporting/importing spectral data in a variety of formats are usually provided, but finding one that is common to all software packages proved to be difficult. Similarly, no universally accepted method of comparing spectra for identification purposes exists. The software used by the three most common NIR instrument manufacturers i.e., FOSS NIRSystems, (Silver Spring, MD, USA) Buhler (Uzwil, Switzerland) and Bran + Luebbe (Norderstedt, Germany), have no one common file format between them. FOSS NIRSystems store data in what are called da files (DOS file extension .da, which are binary coded files). Their NSAS software3 provides options for exporting/importing data in Data Interchange DOI: 10.1039/b005845i
Format (.dif) and JCAMP-DX (.jcm). The more recent FOSS software, Vision,4 provides at present only an ASCII format exporting facility. NIRCAL from Buhler5 provides NIRCAL spectral file (.nsf), Grams (.spc) and JCAMP-DX (.jdx or .dx), while the SESAME software from Bran + Luebbe6 provides IDAS (.dat), JCAMP-DX (.dx or .jdx), SpectraCalc (.spc), Unscrambler Ver. 2 (ASCII) and Data Interchange Format (.dif). Although the JCAMP-DX file format is common to most of the software packages, a further problem was encountered: the various manufacturers use different allowed JCAMP-DX formats and also some actual deviations from the published JCAMP guidelines,7 a problem also reported by other workers.8 Even attempting to transfer a library of spectra from one instrument to another of the same manufacturer, but fitted with different sampling accessories, caused problems. With the FOSS IQ2 software, a library created on a system fitted with a Rapid Content Analyser could not easily be transferred to one using a fibre optic probe as the shorter wavelength range caused the noise test to fail. All these issues presented problems when designing the interlaboratory trial which ideally was to be open to participants using a range of instruments and software. For these reasons it was decided to use an in-house written compter program for data analysis. The program, named IDENT, was designed to read JCAMP-DX and Vision ASCII files, so allowing data from any of the three common NIR instruments manufacturers to be read. The JCAMP-DX file reader was written to be tolerant of the known differences from the published JCAMP guidelines. IDENT compares a sample spectrum against a library of reference spectra using correlation in wavelength space and the matches with correlation values, r, above a predetermined critical value displayed. An option to allow matched spectra to be visually inspected is also provided. Before spectra are compared, they may be converted to first, second etc., derivative, using either a simple moving average difference algorithm or a Savitzky–Golay filter. The spectral range over Analyst, 2000, 125, 1817–1822
This journal is © The Royal Society of Chemistry 2000
1817
which the correlation coefficient is to be calculated can also be specified.
Organisation of the interlaboratory trial A trial was organised in which participants were asked to record NIR spectra of pure solvents from a source of their own choice and then return the recorded spectra to the organising centre (Centre for Pharmaceutical Analysis, The School of Pharmacy, University of London). Participants were encouraged to measure as many different solvents as possible, including solvents not represented within the library, so that the robustness of the procedure could be assessed. The spectra were compared against the master library at the Centre using IDENT. Subsequent to the data analysis, but before the results were revealed to the participants, they were sent the spectral reference library and a copy of the program with an instruction manual and asked to analyse their own data and return the results to the Centre. Participants were recruited by open invitation at the FOSS NIRSystems Pharmaceutical User Group Meeting held at Eli Lilly, Windlesham, UK 7–8th October 1998, along with invitations to known NIR spectroscopists in industry and academic institutions in Europe. Each participant was given a copy of the protocol and assigned a code for naming computer data files.
Protocol The following outlines the design of the experimental trial.
Instrumentation NIR instruments were to be dispersive or Fourier transform (FT) types and spectra measured by transflectance or transmission using sample cuvettes, sample cup and reflector or probes fitted with a transflectance adaptor. Before each measurement session, instruments were to be checked according to the instrument manufacturers’ instructions. Participants were requested to submit the results of these checks with their spectra.
Solvent samples Samples of solvents were to be provided by the participants from a source of their own choice provided they met all the following requirements: laboratory grade or better; purity > 99%; within expiry date; not opened for more than 1 year before the measurement.
Measurement of spectra Spectra were to be measured according to the standard operating procedure described in the manual for the instrument used. When using a fibre optic probe the distance between the probe tip and reflector was to be set to 1mm using a gauge (2mm optical pathlength). For measurements using a sample cup, a reflector giving a 2 3 0.5mm optical pathlength was to be used. All spectra were to be measured with respect to air as reference and recorded over a minimum range of 1100–2100 nm (4762–9091 cm21). A single spectrum for each solvent was requested. 1818
Analyst, 2000, 125, 1817–1822
Data export and collection Each solvent spectrum was to be saved as a separate file using a specified coded name. Data files were to be converted to JCAMP-DX or Vision ASCII format and sent to the organising centre either on a 3.5 in PC formatted high density (1.44 Mb) disk, or alternatively sent over the Internet to the Centre.
Results and discussion Participants The protocol was sent to 12 laboratories of which participants from 10 laboratories responded. Seven of the participants were from industrial analytical laboratories, one from an academic laboratory, one from a warehouse environment and one from an instrument manufacturer. The laboratories were numbered 1–10. Laboratory 2 scanned the solvents with two different instrumental accessories and these, two sets of results were labelled 2a and 2b.
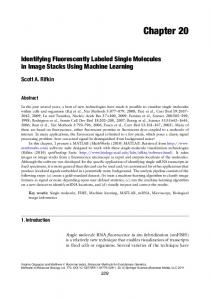
Instrumentation Table 1 lists the instrumentation used by the participants in the trial. Nine laboratories used FOSS NIRSystems instrumentation and one a Bran + Luebbe FT NIR Infraprover spectrophotometer. All except one (laboratory 9) of the FOSS NIRSystems used standard accessories. Laboratory 9 used a Liquid Cuvette Module which had been modified to take 0.8 ml GC vials (P/N: 0.8CPV; external dimensions 40 3 7 mm; Chromacol Ltd., Welwyn Garden City, Hertfordshire, UK). Fig. 1 shows a schematic diagram of the module. Radiation from the source passes through the sample and after reflection from the ceramic block falls on to the detectors. This modified module had a sample pathlength of approximately 5 mm and therefore did not strictly meet the requirements of the protocol. Laboratory 2b used a Petri dish rather than a FOSS sampling cup to contain the solvent. Note that, all instruments used by the participants were different from those used in setting up the library and establishing the optimum conditions for distinguishing between and identifying the solvents.1
Table 1 Instrumentation used by participants Laboratory number Spectrophotometer 1
FOSS NIRSystems 5000
2a 2b
FOSS NIRSystems 6500 FOSS NIRSystems 6500
3
FOSS NIRSystems 5000
4
FOSS NIRSystems 5000
5 6 7
FOSS NIRSystems 5000 FOSS NIRSystems 6500 FOSS NIRSystems 6500
8
FOSS NIRSystems 6500
9
FOSS NIRSystems 5000
10
Bran + Luebbe FT-NIR Infraprover II
Sampling accessory Direct content analyser with liquid sampling kit Smartprobe Direct content analyser with liquid sampling kit (Petri dish instead of FOSS sampling cup) Direct content analyser with liquid sampling kit Direct content analyser with liquid sampling kit Optiprobe Interactance immersion probe Direct content analyser with liquid sampling kit Transmission liquid module (1 mm pathlength) Direct content analyser fitted with a modified liquid cuvette module Diffuse reflectance fibre optic probe with transflectance cap
Instrument daily tests
Solvent spectra
The results of instrument checks were returned by all laboratories except laboratory 8. The daily test for the FOSS instruments include a noise test, bandwidth and wavelength accuracy and precision test. The root mean square noise test values ranged from 0.006 to 0.02 milli-absorbance (specification: Rapid Content Analyser/Direct Content Analyser < 0.02, probe < 0.08), while the bandwith ranged from 9.3 to 10.36 nm (specification 9–11 nm). Wavelength precision (standard deviation based on 10 spectra each of 32 scans) varied from 0.001 to 0.008 nm (specification < 0.01). The wavelength deviations were in the range 0–0.16 nm (specification ±0.3 nm). The daily test results for the Bran + Luebbe instrument are more difficult to interpret as they are of a more empirical nature; however, tests for instrument temperature, wavenumber accuracy, etc., were all well within the specified limits. In fact, it is not possible to measure spectra on this instrument unless the test passes.
One hundred and seventy three spectra were returned to the Centre, of which 139 were internal and 34 were external to the library. The names of the solvents measured by each of the participating laboratories are listed in Tables 2 and Table 3. The solvents originated from 12 different suppliers: Fisher Scientific UK (Loughborough, Leicestershire, UK), Romil Ltd (Cambridge, UK), Rathburns Chemicals Ltd. (Walkerburn, Peebleshire, UK), Chromacol Ltd (Hertfordshire, UK), Hayman Ltd (Witham, Essex, UK), Fluka Chemicals (Gillingham, Dorset, UK), BDH Merck Ltd (Lutterworth, Hertfordshire, UK), Pancreac (Montcada, Spain), Carlo Erba (Rodano, Italy), Prolabo (Paris, France), Sigma Aldrich Company Ltd. (Gillingham, Dorset, UK) and Promochem (Wesel, Germany). Data analysis Returned spectra were compared, using correlation in wavelength space, against the master library of the 15 solvents which had been recorded using a FOSS NIRSystems 6500 scanning spectrophotometer fitted with an Interactance Immersion Probe. The same optimum pre-treatments found in the earlier work1 were used: second-derivative spectra (nine data-point block size) and wavelength range 1136–2000 nm. The dot product correlation coefficient, r, is given by
   xi yi
r=
2
xi
(1)
yi
2
where xi and yi are the ordinate values of the two spectra being compared at wavelength i, the summations being performed
Fig. 1 Schematic diagram of the modified FOSS liquid cuvette module.
Table 2 Correlation coefficients for library solvent spectra submitted by participants versus spectral reference library. r > 0.999 indicates less than 1, but greater than 0.999. r > 0.97 indicates spectrum correctly identified Laboratory number Solvent
1
Acetone (A) > 0.999 Acetonitrile 0.998 (AN) Butan-1-ol > 0.999 (B1OL) Butan-2-ol > 0.999 (B2OL) Chlorofrom 0.997 (CH) Dichlorome0.997 thane (DCM) Dimethyl 0.997 formamide (DMF) Ethanol —a (absolute) (E) Ethanol 96% 0.999 (E96) Ethyl acetate 0.998 (EA) Methanol (M) 0.999
2a 0.998 0.999
2b 0.999 0.999
3
4
5
6
7
8
(0.955) 0.982 —a —a
0.999 > 0.999
> 0.999 0.999
—a 0.997
0.996 0.994
(0.968) —a
> 0.999
> 0.999
> 0.999
> 0.999
—a
0.995
(0.766)
—a
—a
> 0.999
(0.904 —a P1OL) 0.997 —a
0.991
—a
—a
—a
0.987
—a
—a
—a
(0.965)
—a
—a
—a
(0.778 —a DCM)
—a
—a
—a
—a
—a
0.999
0.998
0.998
0.997
0.997
0.999
0.999
0.999
> 0.999
0.997
0.998
> 0.999
> 0.999
0.998
0.994
0.996
0.998
0.999
—a
0.997
0.998
0.997
—a
0.999
> 0.999
0.991
0.999
0.996
0.996
0.999
> 0.999
> 0.999
0.999
0.998
(0.999 E)
10e
> 0.999 > 0.999
> 0.999
(0.998 E)
10d
0.999 0.998
—a
—a
10c
0.998 0.999
—a
—a
9b
—a
0.997
0.998
0.998
0.998
0.999
0.997
0.999
—a
0.999
0.999
> 0.999
> 0.999
> 0.999
> 0.999
0.999
0.997
0.992
0.995
0.992 0.996 —a
—a
—a
—a
0.995
—a
—a
—a
(0.642 E96) —a
—a
—a
(0.966)
0.978
0.980
Propan-1-ol > 0.999 0.999 0.999 > 0.999 > 0.999 > 0.999 > 0.999 > 0.999 —a 0.998 —a —a (P1OL) Propan-2-ol 0.999 0.998 0.999 0.999 > 0.999 > 0.999 > 0.999 0.999 0.997 0.996 (0.706 0.976 0.994 (P2OL) E96) Tetrahydrofuran 0.999 0.999 0.999 > 0.999 > 0.999 > 0.999 > 0.999 0.999 0.995 0.975 —a —a —a (THF) Toluene (TOL) 0.999 0.999 0.999 0.999 > 0.999 > 0.999 > 0.999 > 0.999 0.999 0.990 —a —a —a a No spectrum measured. () indicates r below critical value or an incorrect match with highest matching solvent indicated. b Non-standard module. c FT instrument, all spectra except ethanol and acetone regarded as ‘outliers’. d Follow-up spectra. e Follow-up spectra wavenumber shifted by 7 cm21
Analyst, 2000, 125, 1817–1822
1819
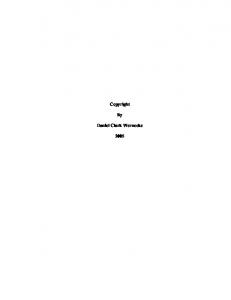
(Fig. 2). The participant was requested to re-measure the sample, but, the original batch of butan-2-ol was no longer available. A new batch was measured and the spectrum correctly identified (r = 0.999). Sample spectra measured using the modified Liquid Cuvette Module, in laboratory 9 gave r values on the low side, two samples being recorded as ‘unknown’ (dichloromethane, r = 0.965 and methanol, r = 0.966). In all cases, however, the highest match solvent was correct. As previously noted, the modified Cuvette Module did not meet the requirements of the protocol, the optical pathlength being too long. As found in earlier work,1 spectra of strongly absorbing solvents will be distorted when such long pathlengths are used. This is in full accord with the trend in r values given in Table 2, the r values for the strongly absorbing solvents dichoromethane, chloroform, methanol and tetrahydrofuran being lower than those for the more weakly absorbing solvents such as acetone and acetonitrile. All the spectra from laboratory 10 except for the sample of absolute ethanol were classified as ‘unknowns’. From visual inspection of the spectra, it was evident that apart from the ethanol and acetone spectra there was a problem in the measurement procedure and it was not just a matter of low r values. Spectra were broad and similar to one another, suggesting sample contamination and/or inadequate cleaning of the measuring probe. Although laboratory 10 used an FT instrument with the original data in wavenumbers, this was not considered to be the underlying reason for the discrepancy observed. Direct comparison of the spectra with an FT spectral reference library (setup 7 in ref. 1) with data in wavenumbers gave no better results, with r values remaining low (e.g., butan1-ol, dichloromethane, methanol and propan-2-ol gave r = 0.584, 0.733, 0.793 and 0.844, respectively). Laboratory 10 was requested to return a new set of spectra, although these also initially gave disappointing results. Close inspection, however, revealed that these follow-up spectra were of high quality, but
over the selected wavelength range. An r value of 1 represents a perfect match; however, in practice, r is always less than 1 because of noise. The program IDENT was used to perform the data analysis. Cubic spline interpolation was used to convert spectra measured in wavenumbers to equally spaced data-points in terms of wavelength. Where necessary, wavenumber vs. transmittance spectra were first converted into absorbance spectra and then absorbance values at 2 nm intervals over the range 1100–2498 nm to give 700 calculated values; any out of range values were set to zero. Cubic spline interpolation was performed using an in-house written computer program based on the functions spline and splint.9 This program was also used to correct spectra for any shift in the wavenumber scale. Recognition of internal solvents For a positive identification, the threshold value for the dot product correlation coefficient was set to > 0.97, the optimum value deduced in previous work.1 Table 2 summarises the correlation coefficients for solvents internal to the reference library. Sample spectra with r @ 0.97 and shown in parentheses were initially recorded by the program IDENT as ‘unknown’. Samples with r > 0.97 shown in parentheses were wrongly identified. Two spectra labelled ‘ethanol 96%’ from laboratories 2a and 2b were identified as absolute ethanol (r = 0.998 and 0.999, respectively). Checking with the participant revealed that the sample was in fact absolute ethanol and that the computer files had been mislabelled. The butan-2-ol sample spectrum returned by laboratory 7 was classified as ‘unknown’. Best match solvents were propan-1-ol (r = 0.904) followed by butan-2-ol (r = 0.884). Visual inspection of the spectrum suggested either the presence of an unknown impurity or an error during the measurement process,
Table 3 Correlation coefficients for solvent spectra external to library versus spectral reference library
Solvent Cyclohexane Diethyl ether Dimethyl sulfoxide 1,4-Dioxan 2-Ethoxyethanol Ethylmethyl ketone Glycerol n-Heptane n-Hexadecane Hexane Hexene IMS 74 OP 2-Methylpentane Octane Petroleum spirit Tetrachloroethylene
Highest matching solvent
Laboratory number 1
2a
2b
3
4
5
6
7
8
9a
10b
Butan-1-ol Acetonitrile Acetone Acetone
0.64
—
—
—
—
—
—
0.641
—
—
0.766
0.701 —
— 0.821
— 0.816
— —
— —
— —
— —
0.699 —
— —
0.676 —
Butan-1-ol 0.781 Tetrahydrofuran — Acetone —
— — —
— — —
— 0.736 —
— — —
— — —
— — —
0.781 — 0.824
— — —
Ethanol 96% Butan-1-ol Methanol Butan-1-ol Butan-1-ol Butan-1-ol Butan-1-ol Propan-1-ol Ethanol absolute Propan-1-ol Butan-1-ol Propan-1-ol Ethanol 96% Butan-1-ol Butan-1-ol Ethanol 96%
—
—
—
—
—
—
—
—
—
10d
— —
0.527 — —
0.644 — —
0.747 — —
— — —
— — —
— — —
—
0.444 0.288
— — — —
0.852 — 0.902 —
0.869 — 0.908 —
— — — —
— — — —
— — — —
— — — —
0.865 — 0.906 —
— — 0.902 —
— 0.767 0.917 —
0.484 — 0.579 0.532
0.756 — 0.931 0.696
— —
0.994 —
0.993 —
— —
— —
— —
— —
— —
— —
— —
— 0.681
—
0.293 0.831 — 0.943 0.643 —
0.854 0.857 —
—
—
—
—
—
—
—
—
—
0.520
— —
— —
— —
— —
— —
— —
— —
— —
— —
— —
0.750 0.573
Butan-1-ol Propan-1-ol Triethylamine Propan-2-ol 0.815 — — — Xylene Toluene — — — — a Non-standard module. b FT instrument, spectra considered ‘outliers’.
1820
10c
Analyst, 2000, 125, 1817–1822
0.694 0.922
0.781 0.937
0.514 0.507 — — — — — — — — — — — — — 0.891 — — — — c Follow-up spectra. d Follow-up spectra wavenumber shifted by 7cm21.
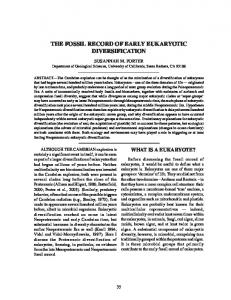
suffered from a small wavenumber shift Fig. 3. Cubic spline interpolation was used to shift the spectra in wavenumbers before conversion to wavelength. Plotting wavenumber shift vs. the correlation coefficient indicated that a shift of 7 cm21 gave the optimum results, the exact value varying slightly (±0.5 cm21) with different solvents. The correlation coefficients improved dramatically and the three solvents in the library were correctly identified (Table 2). The low value for acetone was accounted for by the presence of a trace of water (peak at ~ 1920 nm) in the sample Fig. 3. The two good spectra in the original set also gave much better correlations after correction for a wavenumber shift of 7 cm21 (r = 0.997 and 0.993 for the acetone and ethanol respectively). Using an FT spectral reference library in wavenumbers also gave good correlations with the corrected spectra. A shift of 7 cm21 is greater than the manufacturer’s claim of not more than 2 cm21 between any two instruments and further investigation by the participants revealed that the instrument had not in fact been calibrated. The Bran + Luebbe Suitability Test is an empirical one which looks for changes in the instrument compared with when it was originally aligned. In this case the reference file had been recorded on the uncalibrated instrument and hence passed its Suitability Tests on subsequent occasions. No problems of this type were encountered with the two FT instruments used in the previous study.1 After the corrections for the problem spectra from laboratories 2a, 2b, 7 and 10, it is seen that all laboratories meeting the requirements of the protocol (laboratories 1–8 and 10) gave spectra that were correctly identified. Values for r were all very high and apart from the acetone contaminated with water
(r = 0.982, laboratory 10), the lowest was 0.994 (dichloromethane, laboratory 8), but still significantly above the pre-set threshold of > 0.97 required for identification. Solvents external to the reference library Thirty-four spectra covering 18 solvents not included in the reference library were returned by the participants (Table 3. Apart from IMS 74 OP (industrial methylated spirits), all solvent spectra were correctly identified as ‘unknown’ (i.e. r @ 0.97). Hexane from laboratory 9 gave the closest match to any solvent in the library with r = of 0.917 (hexane–butan-1-ol pair), but still well below the pre-set threshold. IMS 74 OP was identified as absolute ethanol and presents an interesting challenge. IMS grade 74 OP consists of 95% ethanol, 4% methanol and 1% water. The difference in spectra between it and absolute ethanol is minimal, but visible (see Fig. 4). The water absorption at ~ 1940 nm is clearly observable. Differentiation between these two solvents would require the use of a more sensitive algorithm such as the Polar Qualification System or the Maximum Distance method as noted in the earlier work1 and is not feasible using correlation in wavelength space. Software validation The spectral reference library and program IDENT were sent to the participants so that they could analyse their own data. Only four participants responded, but, they were all able to correctly identify their spectra.
Conclusion
Fig. 2 Standard normal variate normalised spectrum of butan-2-ol from laboratory 7 (dotted line) and reference library spectrum (solid line).
Fig. 3 Standard normal variate normalised spectrum of acetone from laboratory 10 (dotted line) and reference library spectrum (solid line). The peak at ~ 1920 nm is due to water impurity.
NIR spectra of common solvents measured on different instruments and by different operators were correctly identified when compared with a master reference library. Solvents included in the library were identified with an effective 100% success rate even though a wide range of different sampling accessories were used by the participants. This has clearly demonstrated the robustness of the spectral library and method. A range of common solvents not included in the library were correctly excluded apart for Industrial Methylated Spirit 74 OP which was incorrectly identified as absolute ethanol. As in the previous study,1 the importance of visually inspecting spectra and not simply relying on the r value cannot be too strongly stressed. Visual inspection of spectra allowed a number of
Fig. 4 Second-derivative standard normal variate normalised spectra of absolute ethanol (solid line) and Industrial Methylated Spirit 74 OP (dotted line). Water peak at ~ 1940 nm.
Analyst, 2000, 125, 1817–1822
1821
human errors and an incorrectly calibrated instrument to be quickly detected. Although the interlaboratory trial has demonstrated that the transferability of an NIR spectral library is possible, even between instruments of different types, there are still a number of problems to be solved before it can be easily achieved. The formats used for storing spectral data and their compatibility with different software packages remain the main obstacles despite it being more than a decade since the publication of the JCAMP-DX file format.7 In this study, it could only be resolved by writing in-house software. The trial clearly indicated the importance of checking that instruments are correctly calibrated. Running the manufacturer’s daily suitability tests is a minimum requirement and should be supplemented by running independent test samples, e.g., dysprosium, erbium and holmium oxides, to check the wavelength calibration.10
Pharmacia and Upjohn Manufacturing (Crawley, UK), SmithKline Beecham (Worthing, UK), Wyeth Manufacturing (Havant, UK), Unitat Qu´ımica Anal´ıtica (Barcelona, Spain) and Zeneca Pharmaceuticals (Macclesfield, UK) for kindly volunteering their time and expenses for providing and measuring the solvents. Weng Li Yoon is grateful to SmithKline Beecham Pharmaceuticals for the funding of a research studentship.
References 1 2 3 4 5 6 7 8
Acknowledgements The authors thank the participants from Abott Laboratories (Queenborough, UK), Boots Contract Manufacturing (Nottingham, UK), Bran + Luebbe (Northants, UK), Glaxo Wellcome (Ware, UK), Lilly Research Centre Ltd (Windlesham, UK),
1822
Analyst, 2000, 125, 1817–1822
9 10
W. L. Yoon, R. D. Jee, A. C. Moffat, P. D. Blackler, K. Yeung and D. C. Lee, Analyst, 1999, 124, 1197. J. C. Miller and J. N. Miller, Statistics for Analytical Chemistry, Ellis Horwood, Chichester, 3rd edn., 1993. NSAS Version 3.52, FOSS NIRSystems, Silver Spring, MD, 1993. Vision Version 2.11, FOSS NIRSystems, Silver Spring, MD, 1998. NIRCAL Version 3.8, Buhler, Uzwil, 1998. SESAME Version 3, Bran + Luebbe, Norderstedt, 1994. R. S. McDonald and P. A. Wilks, Appl. Spectrosc., 1988, 42, 151. P. S. McIntyre and S. Reade, in Computer Methods in UV, Visible and IR Spectroscopy, ed. W. O. George and H. A. Willis, Royal Society of Chemistry, Cambridge, 1990, ch. 11. W. H. Press, S. A. Teukolsky, W. T. Vetterling and B. P. Flannery, Numerical Recipes in C, Cambridge University Press, Cambridge, 2nd edn., 1992. V. R. Weidner, P. Y. Barnes and K. L. Eckerie, J. Res. Natl. Bur. Stand., 1986, 91, 243.