This article has been accepted for publication in a future issue of this journal, but has not been fully edited. Content may change prior to final publication. Citation information: DOI 10.1109/TCBB.2015.2480084, IEEE/ACM Transactions on Computational Biology and Bioinformatics IEEE/ACM TRANSACTIONS ON COMPUTATIONAL BIOLOGY AND BIOINFORMATICS
ℓ2 multiple kernel fuzzy SVM-based data fusion for improving peptide identification Ling Jian, Zhonghang Xia, Xinnan Niu, Xijun Liang, Parimal Samir, and Andrew J. Link Abstract—SEQUEST is a database-searching engine, which calculates correlation score between observed spectrum and theoretical spectrum deduced from protein sequences stored in a flat text file, despite it is not a relational and object-oriental repository. Nevertheless the SEQUEST score functions fail to discriminate between true and false PSMs accurately. Some approaches, such as PeptideProphet and Percolator have been proposed to address the task of distinguishing true and false PSMs. However, most of these methods employ time-consuming learning algorithms to validate peptide assignments [1]. In this paper, we propose a fast algorithm for validating peptide identification by incorporating heterogeneous information from SEQUEST scores and peptide digested knowledge. To automate the peptide identification process and incorporate additional information, we employ ℓ2 multiple kernel learning (MKL) to implement the current peptide identification task. Results on experimental datasets indicate that compared with state-of-the-art methods, i.e., PeptideProphet and Percolator, our data fusing strategy has comparable performance but reduces the running time significantly. Index Terms—fuzzy SVM, mass spectrometry, multiple kernel learning, peptide-spectrum matches, peptide identification
—————————— ——————————
1 INTRODUCTION
E
have been proposed, the validated PSMs reported by these algorithms show significant differences [8]. For instance, SVM-based algorithms show that some true PSMs are very close to the decision hyperplane and hinge with decoy PSMs [9], and thus they are difficult to be distinguished from false PSMs. It has been shown that merging different data sources can improve the accuracy of peptide identification [10], [11], [12], [13]. For example, the number of tryptic termini (NTT) of peptides assigned to spectra is valuable information and employed in PeptideProphet [4]. However, using protein information, such as “sibling peptides”, has been recoginized improper by researchers [14], [15]. Because that feature may exclude the decoy proteins and cause the target-decoy approach to give biased results. Although additional scoring and database attributes improved validation of PSMs, data representation for integrating the additional information remains challenges. MKL is an efficient way to combine multiple data sources and has been shown its effectiveness in genomic data fusion [16], visual object detection [17] and face recognition [18]. In this work, we propose a data fusion method based on ℓ2 MKL fuzzy SVM (MFS) to integrate multiple data sources for accurate PSM validation. During the course of kernel design, we used SEQUEST searching scores and NTT as attributes. ℓ2 MKL model was used to learn the optimal kernel coefficients. In addition, as decoy PSMs are artificially generated, the corresponding labels are known ———————————————— certainly. On the other hand, a large number of target • L. Jian and X. Liang are with College of Science, China University of PePSMs are false, and thus the labels are not trustworthy troleum, Qingdao, 266580, China. E-mail:
[email protected],
[email protected]. either. Hence, these two types of samples should be treat• Z. Xia is with the Department of Computer Science, Western Kentucky ed in different confidence. During training process, the University, Bowling Green, KY 42101. E-mail:
[email protected]. • X. Niu and A.J. Link are with Department of Pathology, Microbiology and fuzzy SVM model assigns a weight to each PSM as its fuzzy membership to reflect its corresponding confident Immunology, Vanderbilt University, Nashville, TN 37240. E-mail: {xinnan.niu, andrew.link}@vanderbilt.edu. level. Experimental studies show that under FDR equals
fficient mass spectrometry-based (MS) strategies for peptide identification and quantification are prerequisites for performing advanced proteomics studies [2]. Database search engines, such as SEQUEST and MASCOT, have been widely used to automatically match peptide spectra generated from LC/MS/MS experiments to theoretical fragmentation spectra derived from target databases. However, a large number of these peptide scoring matches are false and need to be distinguished from true hits [3]. A number of machine learning approaches have been developed to validate the target PSMs using different scoring functions. PeptideProphet employs the expectation maximization (EM) method to compute conditional probabilities of true PSMs for observed peptide sequences based on the assumption that the true and false PSM data are drawn from a mixture of Gaussian and Gamma distributions [4]. The discrimination scores between true and false PSMs are derived from those conditional probabilities, and all PSMs with scores above a threshold are reported as true PSMs. Choi and Nesvizhskii improve the performance of PeptideProphet using semi-supervised learning [5]. In an alternative approach, Percolator searches against target and decoy databases separately and uses q-values to evaluate the quality of PSMs [6], [7]. Progresses on different post-database searching algorithms have been extensively discussed in [8]. Although a variety of peptide identification algorithms
• P. Samir is with Department of Biochemistry, Vanderbilt University, Nashville, TN 37240. E-mail:
[email protected]. 1545-5963 (c) 2015 IEEE. Personal use is permitted, but republication/redistribution requires IEEE permission. See xxxx-xxxx/0x/$xx.00 © 200x IEEE Published by the IEEE Computer Society http://www.ieee.org/publications_standards/publications/rights/index.html for more information.
This article has been accepted for publication in a future issue of this journal, but has not been fully edited. Content may change prior to final publication. Citation information: DOI 10.1109/TCBB.2015.2480084, IEEE/ACM Transactions on Computational Biology and Bioinformatics 2
IEEE TRANSACTIONS ON JOURNAL NAME, MANUSCRIPT ID
0.05, the MFS method can identify at least 18% more target PSMs than single kernel fuzzy SVM using four different training datasets.
1 2
p
l
∑ µ f (α ) − ∑α ≥ θ , i
(11)
0 ≤ α i ≤ siC , i = 1,, l ,
(12)
i i =i 1 =i 1
2 METHODS
l
∑
(13) yiα i = 0, 2.1 ℓ2 MKL of Fuzzy SVM i =1 Different with traditional SVM approaches, which rely on l trustworthy labels of training data [19], the MFS = model where fi (α ) = α jα k y j yk k i (x j , x k ), i 1,, p. needs to cope with a large number of incorrect training j , k =1 labels. To deal with those untrustworthy labels, Lin and Wang proposed to introduce fuzzy membership during 2.2 Kernel Design SVM learning [20]. The effectiveness of fuzzy SVM on Several types of data sources are contained in SEQUEST peptide identification has been shown by Liang et al. [9]. searching results: SEQUEST searching scores, tryptic terGiven l PSMs xi ∈ R n , i = 1,, l with class label yi ∈ {−1,1} mini data, etc. Table 1 summarizes the features used by MFS. and the corresponding fuzzy degree si ∈ [0,1] . The kernelTABLE 1 SUMMARY OF FEATURES USED BY MFS FOR SEQUEST based fuzzy SVM learn model [20] can be written as SEARCH RESULTS l 1 T (1) siξi w w+C min Feature Description
∑
w ,b,ξ
s.t.
∑
2
i =1
yi (w Φ (ξi ) + b) ≥ 1 − ξi , i = 1,, l , T
Xcorr
(2)
(3) ξi ≥ 0, i = 1,, l , where Φ (x) is the mapping from input space to the feature space and C is a regularization parameter, balancing between margin and error. By solving the dual problem of Eqs.(1-3), one has fuzzy kernel-based classifier
∆Cn Sprank Ions Mass enzN/C
the first coss-correlation value from the SEQUEST search the difference correlation value between the first hit and the second hit the preliminary score preformed by SEQUSET the fraction of matched ions the observed monoisotopic mass of the identified peptide a Boolean value indicating if the peptide has a tryptic N/Cterminus
We defined two individual kernels and combined them into a comprehensive kernel with the MKL technique. (4) = f (x) ∑ α i yi k (xi , x) + b, First, we employed Gaussian kernel to exploit the i =1 pairwise similarity between two PSMs based on the SEwhere α i , i = 1,, l are non-negative Lagrange multipliers and k (xi , x j ) is the kernel function. The performance of a QUEST search scores. Here, we used five attributes, i.e., kernel-based classifier closely depends on the design of Xcorr, ∆Cn, Sprank, Ions, and Mass. To avoid attributes the kernel matrix which defines pairwise similarity of with larger values dominating ones with smaller values, data points. A good design can capture the most im- we normalized each of the original SEQUEST scores by portant information hidden in the dataset. MKL provides using the equation x_nor = x_raw − (mean of x_raw)/(std of a general solution to combine multiple single kernels [21], x_raw), where x_nor is the normalized SEQUEST score, [22], [23], [24]. However, the conventional solution for a x_raw is the original SEQUEST score, and std of x_raw is MKL model usually degenerates and a single kernel domthe standard deviation of the original SEQUEST score. Let inates all others. Solutions for non-sparse kernel coefficients were described in [23] and [24] by using ℓ2-norm σ be the number of attributes characterizing the PSM. MKL algorithms and showed good performance in the Then, the first individual kernel is defined by 2 area of bioinformatics [25]. The problem of ℓ2-norm MKL xi − x j for fuzzy SVM can be formulated as follows kij1 exp(− ). = (14) σ p The second kernel was defined to utilize proteolytic inµi k i ) min ω ( (5) m formation for validating the PSMs. Usually only a very i =1 s.t. µ 2 = 1, (6) small number of fully-canonical PSMs are assigned to decoy peptides in the database search process [26] and (7) the NTT distributions among true and false peptide asµi ≥ 0, i = 1,, p, where ω (k ) denotes the optimal value of the dual prob- signments are sufficiently distinct. Hence, the NTT of lem Eqs.(1-3). To tackle the computational complexity, peptide is valuable information in peptide identification Sonnenburg et al. reformulated the problem as a semi- [4]. Taking into account the NTT information, the second infinite programming (SIP) [24]. The SIP formulation of kernel can be defined as 2 MFS can be written as (15) kij2 = exp(− ni − n j ). (8) max θ Here, ni stands for the NTT of peptide associated with the s.t. µ 2 ≤ 1, (9) ith PSM. (10) µi ≥ 0, i = 1,, p, l
∑
1545-5963 (c) 2015 IEEE. Personal use is permitted, but republication/redistribution requires IEEE permission. See http://www.ieee.org/publications_standards/publications/rights/index.html for more information.
This article has been accepted for publication in a future issue of this journal, but has not been fully edited. Content may change prior to final publication. Citation information: DOI 10.1109/TCBB.2015.2480084, IEEE/ACM Transactions on Computational Biology and Bioinformatics AUTHOR ET AL.: TITLE
3
2.3 Fuzzy Membership Design As true PSMs are usually close to each other, we employed density measurement of target PSMs to construct the fuzzy membership for alleviating the impact of noise. For a given training dataset train = {(xi , yi )}il =1 , denote l + +
target PSMs by train = {(xi+ ,1)}li = 1 and l − decoy PSMs by +
l− − − = train {( xi , −1)}i = 1 , respectively. The fuzzy membership
3 RESULTS AND DISCUSSIONS 3.1 Datasets and Parameter Setting The LC-MS/MS datasets used in this study were described in a previous publication [26]. In fuzzy SVM, the regularization parameter C is set as 1. In the one-class SVM, we use the default setting for the kernel width σ and ν , i.e., set σ as the dimension of input variable and ν as 0.5 [28].
of decoy PSMs are set as 1 as they are trustworthy. Afterwards the fuzzy membership of target PSMs are normalized to [0 1] by d (xi+ ) − min d (x +j ) 1≤ j ≤l + + ·w(xi+ ) si = (16) + max d (x j ) − min d (x +j ) + +
3.2 Results on Training Set The RAW files generated from the different LC/MS/MS experiments were converted to mzXML format using the program ReadW. The MS/MS spectra were extracted from the mzXML file using the program MzXML2Search [29]. Using SEQUEST, the datasets were searched against ei1≤ j ≤l 1≤ j ≤l ther S. cerevisiae (SGD-2010) or human Uniprot + where w(xi ) pre-determined parameters by users, and (uni280910) databases containing target and decoy protein sequences. All decoy protein sequences were created the density support function d (x) was obtained by solving by reversing the target protein sequences. In this study, one-class SVM [27] according to the distribution of Target/Decoy, we random l selected the training set of 2500 PSMs from each dataset. 1 T 1 (17) w w+ ξi − ρ min Details about the training sets are shown in Table 2 and w , ρ ,ξ 2 nl i =1 Table 3. TABLE 2 (18) s.t. w T Φ (xi ) ≥ ρ − xi , i = 1,, l , SUMMARY OF LC/MS/MS DATASETS AND SEQUEST SEARCH (19) ξi ≥ 0, i = 1,, l. RESULTS The pseudocode for the MFS method is summarized as Sample Mass Spectrometer MiPS Decoy/Total(%) follows. θ
∑
Algorithm: ℓ2-MFS algorithm
PBMC θ PBMC -train
Orbitrap XL Orbitrap XL
OFF OFF
35.12 35.60
PBMC -test
Orbitrap XL
OFF
35.12
θ
Input: + , − ,train ,train , w, γ Output: +
PBMC
Orbitrap Velos
ON
30.89
PBMC-train PBMC-test
Orbitrap Velos Orbitrap Velos
ON ON
30.72 30.88
of positive samples
Tal08 Tal08-train Tal08-test
Orbitrap XL Orbitrap XL Orbitrap XL
ON ON ON
39.30 39.44 39.36
2: Compute the fuzzy membership of positive samples xi+
Gcn4 Gcn4-train Gcn4-test
LCQ LCQ LCQ
N/A N/A N/A
54.99 55.08 55.08
+
−
− 1: Train one-class SVM decision function d (x) on train ;
Compute density support
d (xi+ )
+ xi+ ∈ .tra in .
via Eq.(16). 3: Calculate the initial kernel matrix k1, k 2 via Eqs.(14-15). 4: Learn kernel coefficients µµ 1, 2 over train via Eqs.(8-13); Solve
Eqs.(1-3)
with
comprehensive
kernel
k = µµ 1k + 2 k ; 1
2
Compute the final decision function Eq.(4) 5: Calculate the decision value f (xi ) of samples xi ∈ ; Sort f (xi− ) in descending order; Let f (xγ− ) be the γ − th largest decision value in negative samples; Remove xi+ from + if f (xi+ ) < f (xγ− ) ; Update + .
TABLE 3 SUMMARY OF UNFILTERED, CATEGORIZED PSMS Sample
Full θ PBMC 28561 θ PBMC -train 610 θ PBMC -test 599 PBMC 110404 PBMC-train 917 PBMC-test 963 Tal08 14893 Tal08-train 547 Tal08-test 537 Gcn4 1453 Gcn4-train 471 Gcn4-test 537
Target Half 17490 349 390 35915 286 276 6809 235 239 1210 232 239
Non 30344 651 633 62446 529 489 20520 732 740 4040 681 740
Full 948 21 16 2520 22 23 419 17 14 106 21 21
Decoy Half 10033 201 194 24682 196 190 5877 226 202 1465 244 187
Non 30375 668 668 65912 550 559 21042 743 783 6618 851 776
Full denotes fully tryptic, Half denotes half tryptic, and Non denotes non tryptic
1545-5963 (c) 2015 IEEE. Personal use is permitted, but republication/redistribution requires IEEE permission. See http://www.ieee.org/publications_standards/publications/rights/index.html for more information.
This article has been accepted for publication in a future issue of this journal, but has not been fully edited. Content may change prior to final publication. Citation information: DOI 10.1109/TCBB.2015.2480084, IEEE/ACM Transactions on Computational Biology and Bioinformatics 4
IEEE TRANSACTIONS ON JOURNAL NAME, MANUSCRIPT ID
3.2.1 Fuzzy SVM vs. SVM We tested the performance of fuzzy SVM by comparing it with standard SVM over prepared data. As
− train
is trusty data, we used it to deter-
mine the density estimator with one-class SVM Eqs.(1719), and computed the fuzzy membership Eq.(16) of posi+ tive samples train . State-of-the-art software libsvm is
selected to solve the one-class SVM model [28]. The Gaussian kernel defined in Eq.(14) is selected to express the samples similarity in feature space, i.e., k ( xi , x j ) = Φ (xi )T Φ (x j ) . Consequently, the fuzzy SVM are
trained on dataset train . The classification accuracy of − are improved significantfuzzy SVM on the dataset train
ly from 54.38% to 88.65%, from 55.08% to 85.55%, from 66.53% to 86.11%, and from 86.56% to 95.13% on PBMCθtrain, PBMC-train, Tal08-train and Gcn4-train, respectively. 3.2.2 Single kernel fuzzy SVM vs. Multiple kernel fuzzy SVM The first single kernel matrix k 1 was defined by the pairwise similarity of PSMs which are represented by SEQUEST search scores. The SVM corresponding to k 1 was obtained by solving Eqs.(1-3). In MKL fuzzy SVM, the kernel combination coefficients of k 1 and k 2 were
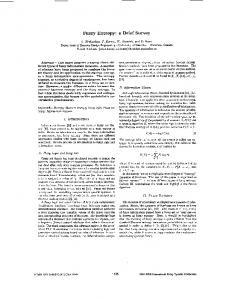
Fig. 1. Ranking results on training datasets: x-coordinate stand for the rank index of samples computed by Eq.(4) and y-coordinate stand for the initial index of samples, circle stand for target points, snow stand for decoy points, green stand for full digested PSMs, blue stand for half digested, red stand for none digested and the vertical line corresponding to FDR equals 0.05.
learned by solving Eqs.(8-13). The optimal kernel coefficients are [0.7505 0.6609], [0.7604 0.6494], [0.7469 0.6649], and [0.7238 0.6900] on four training datasets, i.e., PBMCθtrain, PBMC-train, Tal08-train and Gcn4-train. Comparison experiments on the above mentioned datasets were conducted. The corresponding results are given in Fig. 1 from the first row to the fourth row. The left column of Fig.1 shows the results of single kernel and the right column shows the results of multiple kernels. Under FDR equals 0.05, multiple kernels can identify 29%, 18%, 71%, and 27% more target PSMs than single kernel on PBMCθtrain, PBMC-train, Tal08-train, and Gcn4-train, respectively. This group of experiments demonstrates that multiple kernel can significantly improve the confidence level’s distribution of PSMs.
3.3 Performance of ℓ2-MFS on Test Datasets To validate the generalization ability, we also evaluated the performance of the MFS on the test datasets. For each
experiment, according to the distribution of Target/Decoy, 2500 PSMs were random drawn from original datasets for testing. The decision function learned in training process is directly used to calculate the decision values of the test data. Details of results are summarized in Fig 2. Note that the distribution of different type points in Fig 2 is closely consistent with the right column of Fig 1. It shows that the performance of MFS is consistent on training and test sets. Moreover, three frequently used criteria in machine learning, i.e., true positive rate (TPR, sensitivity), ture negative rate (TNR), and accuracy (Acc) are listed in Table 4. Highly similar performance in training/test/whole datasets shows that the proposed MFS algorithm can effectively avoid overfitting issue. Hence, the trained model learned in training set can fit the whole dataset.
1545-5963 (c) 2015 IEEE. Personal use is permitted, but republication/redistribution requires IEEE permission. See http://www.ieee.org/publications_standards/publications/rights/index.html for more information.
This article has been accepted for publication in a future issue of this journal, but has not been fully edited. Content may change prior to final publication. Citation information: DOI 10.1109/TCBB.2015.2480084, IEEE/ACM Transactions on Computational Biology and Bioinformatics AUTHOR ET AL.: TITLE
5
TABLE 4 GENERALIZATION ABILIBYT OF MFS METHOD Sample
PBMCθ PBMC TPR(%) TNR(%) Acc(%) TPR(%) TNR(%) Acc(%)
Tal08 TPR(%) TNR(%) Acc(%) TPR(%)
Gcn4 TNR(%) Acc(%)
train
54.60
87.19
66.20
66.80
79.56
70.72
38.77
97.57
61.96
22.62
98.98
64.68
54.25
88.04
66.12
68.98
77.59
71.64
38.06
97.56
61.48
21.46
98.84
64.08
53.59
86.78
66.25
66.42
77.42
69.82
37.51
97.62
61.13
22.47
98.83
64.46
test
Fig. 2. Ranking results of MFS on test sets.
3.4 Evaluating the Performance on the Whole Dataset Finally, we compared the performance of ℓ2-MFS with that of the PeptideProphet and Percolator. For fair comparison our algorithm to PeptideProphet and Percolator, the validation of the PSMs was performed by testing a range of probability filters (p values) provided by PeptidepProphet until the desired FDR (i.e., 0.05) was reached. Likewise, a range of q values were chosen by Percolator until the desired FDR was reached. In the current experiment, the parameters are set as p ≥ 0.25 for PeptideProphet and q ≤ 0.017 for Percolator on dataset PBMCθ, p ≥ 0.15 and q ≤ 0.015 on PBMC, p ≥ 0.4 and q ≤ 0.026 on Tal08, p ≥ 0.25 and q ≤ 0.024 on Gcn4. It should be noted that the MKL process is time-consuming, besides storage of the non-sparse kernel matrices is memory cost. So it is difficult for MFS to deal with large scale problem directly. Fortunately, the experiment in Section 3.3 shows that the kernel coefficients and decision function learned in training set can fit the whole dataset. In this section, we use the kernel coefficients and decision function learned in training set to process the whole data set. It takes ~172s to learn the kernel coefficients on training set and ~31s to process the whole PBMCθ dataset, ~188s to learn the kernel coefficients and ~81s to process the whole PBMC dataset, ~232s to learn the kernel coefficients and ~17s to process the whole Tal08 dataset, and ~141s to learn the kernel coefficients and ~4s to process
the whole Gcn4 dataset. Once the decision function is learned in training set, the evaluating process on the whole data set is highly effective. Compared with PeptideProphet and Percolator, the running time can be significantly reduced from hour to minute to process data set with capacity of 100 thousands. The experiments are run on a machine configured with 4 G RAM and core i32130 3.4 GHz processor. It should be point out that as the number of half digested PSMs validated by MFS is less than PeptideProphet and Percolator, the total number of validated PSMs under FDR equals 0.05 is less than wellknown methods. Table 6 lists detailed validated PSMs according to their digestion pattern: fully-canonical, halfcanonical, and non-canonical PSMs. Compared with PeptideProphet, MFS can identify more full digested PSMs on three datasets out of four datasets. Compared with Percolator, MFS can identify more full digested PSMs on two datasets out of four datasets. Hence, the proposed method’s performance is comparable with the wellknown methods. Fig. 3 shows the overlap of the identified target PSMs by the three methods on datasets PBMCθ, PBMC, Tal08 and Gcn4. On all the datasets, the target PSMs output by MFS have large overlap with PeptideProphet and Percolator. On PBMCθ, PeptideProphet shared 91.3% target PSMs with MFS; Percolator shared 86.3% target PSMs with MFS. On PBMC, these percentages are 93.3% and 88.0%. On Tal08, these percentages are 94.0% and 91.4%.
1545-5963 (c) 2015 IEEE. Personal use is permitted, but republication/redistribution requires IEEE permission. See http://www.ieee.org/publications_standards/publications/rights/index.html for more information.
This article has been accepted for publication in a future issue of this journal, but has not been fully edited. Content may change prior to final publication. Citation information: DOI 10.1109/TCBB.2015.2480084, IEEE/ACM Transactions on Computational Biology and Bioinformatics 6
IEEE TRANSACTIONS ON JOURNAL NAME, MANUSCRIPT ID
On Gcn4, the percentages are 91.2% and 87.9%, respectively. The results indicate that the majority of target
PSMs validated by PeptideProphet and Percolator were also validated by the proposed MFS.
TABLE 5 SUMMARY OF PSMS VALIDATED BY DIFFERENT APPROACHES PBMCθ Target Decoy PeptideProphet 35673 869 Percolator 36096 866 MFS 33399 868 Approach
PBMC Target Decoy 120961 2947 122568 3133 115948 3165
Tal08 Target Decoy 15638 387 14371 354 14937 382
Gcn4 Target Decoy 1443 38 1394 35 1350 36
TABLE 6 DISTRIBUTION OF VALIDATED PSMS Approach PeptideProphet Percolator MFS
Full
PBMCθ Half Non
Full
27622 28729 27926
7649 7046 5448
107730 111990 109747
402 321 25
PBMC Half 13001 10453 5728
Non
Tal08 Full Half
Non Full
230 125 473
14539 13855 14721
11 0 2
1088 516 214
1375 1342 1345
Gcn4 Half Non 68 51 5
1 1 0
tional Institutes of Health under Grant No. GM064779. Ling Jian and Xijun Liang were supported by National Natural Science Foundation of China under Grant No. 11326203 and No. 61403419, Natural Science Foundation of Shandong Province under Grant No. ZR2013FQ034 and ZR2014AP0004, and Fundamental Research Funds for the Central Universities. Data for the project has been funded in part with Federal funds from the National Institutes of Allergy and Infectious Disease, National Institute of Health, Department of Health and Human Service under Contact No. 272200800007C and the Vanderbilt Clinical and Translational Science Award under Grant No. NIH RR024975.
REFERENCES [1]
Fig. 3. Overlap of identified target PSMs by PeptideProphet, Percolator and MFS.
4
[2]
CONCLUSION
In this study, we propose a fast post-database search algorithm ℓ2-MFS that can integrate SEQUEST scores and NTT information for validating peptide identification. The main contribution of our approach are: introduce fuzzy membership to effectively suppress the influence of noise; design kernel matrices to represent different kinds of heterogeneous information in unified mathematical format; employ ℓ2-norm MKL algorithm to realize the optimal data fusion of the multiple information sources. The MFS algorithm has been assessed by comparing it with the performance of PeptideProphet and Percolator on four data samples, and the validated PSMs demonstrate MFS algorithm provides us with a new way to validate PSMs.
ACKNOWLEDGMENT Andrew J. Link and Xinnan Niu were supported by Na-
[3]
[4]
[5]
[6]
[7]
F. X. Wu, P. Gagné, A. Droit, G. G. Porier, “RT‐PSM, a Real‐time Program for Peptide‐spectrum Matching with Statistical Significance, ” Rapid Communications in Mass Spectrometry, vol. 20, no.8, pp. 1199-1208, 2006. F. X. Wu, P. Gagné, A. Droit, G. G. Porier, “Quality Assessment of Peptide Tandem Mass Spectra,” BMC Bioinformatics, vol. 9, no. 6, pp. 1-10, 2008. J. Elias and S. Gygi, “Target-decoy Search Strategy for Increased Confidence in Large-scale Protein Identifications by Mass Spectrometry,”Nature Methods, vol. 4, no. 3, pp. 207-214, 2007. A. Keller, A. Nesvizhskii, E. Kolker, and R. Aebersold, “Empirical Statistical Model to Estimate the Accuracy of Peptide Identifications Made by MS/MS and Database Search,” Analytical Chemistry, vol. 74, no. 20, pp. 5383-5392, 2002. H. Choi and A. I. Nesvizhskii, “Semisupervised Model-based Validation of Peptide Identifications in Mass Spectrometrybased Proteomics,” J. Proteome Res., vol. 7 no. 1, pp. 254–265, 2007. L. Käll, J. Canterbury, J. Weston, W. Noble, and M. MacCoss, “Semi-supervised Learning for Peptide Identification from Shotgun Proteomics Data Sets,” Nature Methods, vol. 4, no. 11, pp. 923-925, 2007. P. Yang, J. Ma, P. Wang, et al., "Improving X! Tandem on Peptide Identification from Mass Spectrometry by Self-boosted
1545-5963 (c) 2015 IEEE. Personal use is permitted, but republication/redistribution requires IEEE permission. See http://www.ieee.org/publications_standards/publications/rights/index.html for more information.
This article has been accepted for publication in a future issue of this journal, but has not been fully edited. Content may change prior to final publication. Citation information: DOI 10.1109/TCBB.2015.2480084, IEEE/ACM Transactions on Computational Biology and Bioinformatics
[8]
[9]
[10]
[11]
[12]
[13]
[14]
[15]
[16]
[17]
[18]
[19]
[20] [21]
[22]
[23]
[24]
Percolator,” IEEE/ACM Trans. Comput. Biology. Bi., vol. 9, no. 5, [25] S. Yu, T. Falck, A. Daemen, L. C. Tranchevent, J. A. Suykens, B. pp. 1273-1280, 2012. De Moor, and Y. Moreau, “L2-norm Multiple Kernel Learning and its Application to Biomedical Data Fusion,” BMC BioinforA. I. Nesvizhskii, “A Survey of Computational Methods and matics, vol. 11, no. 1, pp. 309, 2010. Error Rate Estimation Procedures for Peptide and Protein Identification in Shotgun Proteomics,” J. Proteomics, vol. 73, no. [26] L. Jian, X. Niu, Z. Xia, P. Samir, C. Sumanasekera, Z. Mu, J. L. Jennings, K. L. Hoek, T. Allos, L. M. Howard, et al., “A Novel 11, pp. 2092–2123, 2010. X. Liang, Z. Xia, X. Niu, A. J. Link, L. Pang, F. Wu, and H. Algorithm for Validating Peptide Identification from a ShotZhang, “Peptide Identification based on Fuzzy Classification gun Proteomics Search Engine,” J. Proteome Res., vol. 12, no. 3, and Clustering,” Proteome Sci., vol. 11, no. 1, p. S10, 2013. pp. 1108–1119, 2013. K. A. Resing, K. Meyer-Arendt, A. M. Mendoza, L. D. Aveline- [27] B. Schölkopf, J. C. Platt, J. Shawe-Taylor, et al., “Estimating the Wolf, K. R. Jonscher, K. G. Pierce, W. M. Old, H. T. Cheung, S. Support of a High-dimensional Distribution,” Neural. Comput., Russell, J. L. Wattawa, et al., “Improving Reproducibility and vol. 13, no. 7, pp. 1443-1471, 2001. Sensitivity in Identifying Human Proteins by Shotgun Prote- [28] C. Chang and C. Lin, “LIBSVM : a Library for Support Vector omics,” Anal. Chem., vol. 76, no. 13, pp. 3556–3568, 2004. Machines,” ACM Transactions on Intelligent Systems and TechT. S. Price, M. B. Lucitt, W. Wu, D. J. Austin, A. Pizarro, A. K. nology, vol. 2, no. 27, pp. 1-27, 2011. Software available at Yocum, I. A. Blair, G. A. FitzGerald, and T. Grosser, “Ebp, a http://www.csie.ntu.edu.tw/~cjlin/libsvm. Program for Protein Identification Using Multiple Tandem [29] E. W. Deutsch, L. Mendoza, D. Shteynberg, T. Farrah, H. Lam, Mass Spectrometry Datasets,” Mol. Cell. Proteomics., vol. 6, no. N. Tasman, Z. Sun, E. Nilsson, B. Pratt, B. Prazen, et al.,“A 3, pp. 527–536, 2007. Guided Tour of the Trans-proteomic Pipeline,” Proteomics, vol. J. Shi, B. Chen, and F. Wu, “Improve Accuracy of Peptide Iden10, no. 6 ,pp. 1150–1159, 2010. tification with Consistency between Peptides,” In Bioinformatics and Biomedicine (BIBM), IEEE International Conference on, pp. 191–196, 2011. C. Yang, Z. He, C. Yang, W. Yu, “Peptide Reranking with Protein-Peptide Correspondence and Precursor Peak Intensity Information,” IEEE/ACM Trans. Comput. Biology. Bi., vol. 9, no. 4, pp. 1212-1219, 2012. L. J. Everett, C. Bierl, S. R. Master, “Unbiased Statistical Analysis for Multi-stage Proteomic Search Strategies,” Journal of Proteome Research, vol. 10, no. 4, pp. 2123-2127, 2011. J. Zhang, L. Xin, B. Shan, et al., “PEAKS DB: De Novo Sequencing Assisted Database Search for Sensitive and Accurate Peptide Identification,” Molecular & Cellular Proteomics, vol. 11, no. 4, doi: 10.1074/mcp.M111.010587, 2012. G. R. Lanckriet, T. De Bie, N. Cristianini, M. I. Jordan, and W. S. Noble, “A Statistical Framework for Genomic Data Fusion,” Bioinformatics, vol. 20, no. 16, pp. 2626–2635, 2004. C. Sun and K.-M. Lam, “Multiple-kernel, Multiple-instance Similarity Features for Efficient Visual Object Detection,” IEEE Trans. Image. Process., vol. 22, no. 8, pp. 3050–3061, 2013. Z. Wang and X. Sun, “Multiple Kernel Local Fisher Discriminant Analysis for Face Recognition,”Signal. Process., vol. 93, no. 6, pp. 1496–1509, 2013. B. Schölkopf, and A. Smola, Learning with Kernels: Support Vector Machines, Regularization, Optimization, and Beyond. Cambridge: MIT Press, pp. 227-248, 2002. C. Lin and S. Wang, “Fuzzy Support Vector Machines”, IEEE Trans. Neural. Network., vol. 13, no. 2, pp. 464–471, 2002. G. R. Lanckriet, Cristianini, P. Bartlett, L. E. Ghaoui, and M. J. Jordan, “Learning the Kernel Matrix with Semidefinite Programming,”J. Mach. Learn. Res., vol. 5, pp. 27–72, 2004. F. R. Bach, G. R. Lanckriet, and M. I. Jordan, “Multiple Kernel Learning, ConicDuality, and the SMO Algorithm,”In Proc. 21th ICLM, pp. 6., 2004. M. Kloft, U. Brefeld, P. Laskov, and S. Sonnenburg, “Nonsparse Multiple Kernel Learning,”In NIPS Workshop on Kernel Learning: Automatic Selection of Optimal Kernels, 2008. S. Sonnenburg, G. Rätsch, C. Schäfer, and B. Schölkopf, “Large Scale Multiple Kernel Learning,” J. Mach. Learn. Res., vol. 7, pp. 1531–1565, 2006. 1545-5963 (c) 2015 IEEE. Personal use is permitted, but republication/redistribution requires IEEE permission. See http://www.ieee.org/publications_standards/publications/rights/index.html for more information.