H. L. FERNANDEZ-CANQUE, M. C. ABDULRIDA AND J. ALLISON. University of Sheffield ..... 9 K.D. MacKenzie, P. G. LeComber and W. E. Spear, Philos. Mag.
Thin Solid Films, 110 (1983) 241-250 PREPARATION AND CHARACTERIZATION
241
C O M P A R A T I V E M E T H O D S FOR T H E D E T E R M I N A T I O N O F T H E GAP STATE DENSITY IN M A G N E T R O N - S P U T T E R E D H Y D R O G E N A T E D A M O R P H O U S SILICON H. L. FERNANDEZ-CANQUE, M. C. ABDULRIDA AND J. ALLISON University of Sheffield, Department of Electronic and Electrical Engineering, Sheffield S1 3JD (Gt. Britain) (Received May 5, 1983; accepted August 3, 1983)
A comparative study of three methods for determining the density of states
N(E) in material with the same structure and chemical composition is presented. The three techniques are measurements of the field effect, the Schottky capacitance and conductance as a function of voltage and the Schottky capacitance and conductance versus frequency at zero bias. The difference between the N(E) deduced from a field effect measurement and those deduced from the other methods is found to be due to the technique itself and not to a difference in material properties. This difference can be greater than a decade. We also report here, for the first time, changes in the midgap density of states of hydrogenated amorphous silicon (a-Si:H) produced by r.f. magnetron sputtering with variation in the hydrogen pressure from 0.2 to 2.0 mTorr and for substrate temperatures between 170 and 260 °C. There is a sharp decrease in the density of states followed by a rise as the hydrogen pressure is increased. Magnetron-sputtered a-Si:H is shown to be a good quality material because of its low N(E) and its performance in devices.
l. INTRODUCTION The distribution of the localized states in the mobility gap of an amorphous semiconductor has a determining influence on the electronic and optical properties of the material. The measurement of the number of states N(E) per unit volume in unit energy interval is therefore an important step towards the detailed understanding of these properties. The measurement of N(E) as a function of the preparation conditions, doping and the conditions after preparation (annealing, exposure to light etc.) is essential for unravelling the origin of the remaining localized states. Hydrogen has been identified as the agent mainly responsible for the remarkable properties of hydrogenated amorphous silicon (a-Si:H). It has been demonstrated that the deliberate incorporation of hydrogen eliminates states associated with dangling bonds from the mobility gap 1. The exact manner in which the hydrogen modifies the a-Si: H is not yet understood. In the reactive magnetron sputtering of a-Si:H the hydrogen content can be 0040-6090/83/$3.00
© ElsevierSequoia/Printedin The Netherlands
242
H. L, FERNANDEZ-CANQUE, M. C. ABDULRIDA, J. ALLISON
varied simply by adjusting the partial pressure PH of hydrogen. If no other deposition parameters are changed the effect of the incorporation of different amounts of hydrogen can be studied independently. We report in this paper the quantitative effect on the density of states near the midgap of changes in PH and the substrate temperature T~ for an undoped material prepared by r.f. magnetron sputtering. Such a material shows good properties for photovoltaic applications 2 and for use in other devices, particularly thin film transistors 3. The value of N(E) in a-Si:H has been obtained from measurements of the field effect4,5, the capacitance 6 s and the space-charge-limited current 9 and from deep level transient spectroscopy 1o, 1~. Information about N(E) can also be obtained from photoemission spectroscopy 12, IR quenching and enhancement ~3, thermal quenching x4 of the photoconductivity, photo-induced absorption ~5, electron tunnelling 16 and the photoconductivity ~v. An order of magnitude difference in N(E) has been obtained using different techniques but it is not always clear whether this difference is due to the material itself or to the method of measurement. This is somewhat aggravated by the critical nature of the preparation conditions and problems of reproducibility. We have partially eliminated the ambiguity by applying three measurement methods, namely measurements of the capacitance and conductance as a function of voltage at low frequency, measurements of the capacitance and conductance as a function of frequency at zero bias voltage and field effect measurements, in materials that have exactly the same structure and chemical composition and are obtained by preparing different devices in the same deposition run. 2.
EXPERIMENTAL DETAILS
The materials investigated were produced in a Nordiko 2000 r.f. sputtering system with a magnetron target and a target-to-substrates spacing of 9 cm; for further details see ref. 2. The substrates, Corning 7059 glass for capacitance measurements and c-Si/SiO/(0.2/am) (where c-Si is crystalline silicon) for field effect measurements, were clamped to a heater platen. The flow of high purity argon and hydrogen (purity, 99.999~o after purification) was controlled by electronic mass flow controllers (Vacuum General type 80-1) with total pressure feedback from a Baratron gauge. For all depositions, the r.f. power was kept at 100 W, the argon partial pressure was kept at 5.0 mTorr and the hydrogen partial pressure and substrate temperature were varied from 0.2 to 2.0 mTorr and from 170 to 260°C respectively. The a-Si:H films approximately 1 lam thick were deposited at a rate of 60 A rain 1 For the capacitance measurements an N i - C r layer was first deposited onto the Corning 7059 glass. The two types of substrate were then introduced into the r.f. sputtering system and an unhydrogenated a-Si layer (500 A) was deposited to ensure an ohmic contact between the a-Si:H is and the N i - C r layer; the c-Si/SiO2 substrate was covered with a shutter meanwhile. After removal of the shutter a-Si: H was deposited for the Schottky barrier and field effect devices. The active material was therefore deposited simultaneously for both types of device, which implies at least that the material has the same chemical composition. Top contacts of platinum
GAP STATE DENSITY IN MAGNETRON-SPUTTERED
a-Si:H
243
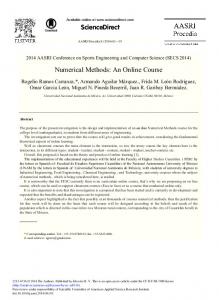
were immediately evaporated onto the a-Si:H film to form the final structure of the Schottky devices. For the field effect measurements, the a-Si:H was etched using standard photolithography to form a matrix of electrically isolated 1 mm squares. Source and drain electrodes were produced by evaporation and delineation of aluminium with a channel length and width of 20 lam and 300 lam respectively. The single-crystal silicon substrate of resistivity about 0.001 f~ cm eventually formed the gate electrode of the devices. Figure 1 shows a schematic diagram of the structures used for the field effect and capacitance measurements. Pt Top Contact AI Top Contacts
L=20~Im,W=300~tm/ I I a-Si:H I ~ V//H/}I//H///H////HHJ'~//ZZ~Id Single Crystal
SiO2A gate ~ ' e l e c t rode
back tact
Si
(a)
(b)
Fig. 1. Cross sectionof(a) a fieldeffectdeviceand (b) a Schottkydevice. The field effect measurements were carried out in the dark and in a vacuum of better than 2 x 10- 5 Torr at room temperature. The source-drain current Isa was measured using a Keithley type 602 electrometer at a fixed time, typically 1 min, after the application of a gate voltage V~, the source-drain voltage V~d being kept constant at 10 V. All devices with a leakage current higher than 10-11 A at 60 V on the gate electrode were rejected at this stage. The activation energy was obtained, using a coplanar electrode configuration, from a plot ofln a versus 1/T and was used to normalize the energy scale to the conduction band for the density of states distribution. Measurements of the capacitance and the conductance were made using the in-phase and quadrature current components obtained from a Brookdeal Ortholoc-SC 9505 dual analyser, which has a frequency range from 0.2 Hz to 100 kHz. The modulation voltage used was 20 mV r.m.s. During the measurements the Schottky barrier samples were kept either under vacuum or in a dry nitrogen environment. 3.
RESULTS AND DISCUSSION
The density of states in the mobility gap of a-Si: H can be determined from the change in conductance with the applied field. The induced space charge density p relates to the introduced charge per unit area AN~ which occupies the shifted localized states across the Fermi level Er: eAN~ p = --v 2,
(1)
where e, v and 2, are the electron charge, the integer step number and the width of the space charge layer respectively. The "zero-temperature statistics" used to consider only changes in occupancy near E F in each step are valid since the material under investigation is intrinsic rather than doped 19. The solution of Poisson's equation for
244
H. L. FERNANDEZ-CANQUE, M. C. ABDULRIDA, J. ALLISON
the accumulation layer can be written as the integral equation 2°
kr
Goo- 1 = Us 1/2 exp(UjI(U~lJ2) - U~
(2)
where G~, Go, d, Av, I(U~ 1/2) and Us are the sheet conductance at step v, the sheet conductance in the flat-band position, the specimen thickness, a constant at step v, Dawson's integral and a dimensionless variable respectively. At any position E c -- E,.(x) U,,(x)
-
kT
and at the surface Ec - E~ Usv --
kT
By using the expressions of Spear and LeComber 2° N(E) can be calculated from
vAN N,.(E)- AEv2,.
1 ~, 1 AE, ~o NiAEi
(3)
A computer program was used to compare the measured value (left-hand side of eqn. (2)) and the calculated value (right-hand side of eqn. (2)) by systematically iterating Usv until the best fit was obtained. The best fit means here that the difference between the measured and calculated values was less than 2~o. The energy width AE~ was obtained from kT(AUsv ) where AUs~ = U s , - Us(, 1t. The analysis used to determine the density of states N(EF) near EF, derived from field effect data, represents an upper limit since field effect results may also include the effect of surface states. Also the error of + 30% in the assumed flat-band position will alter N(EF) by less than a factor of 2. The transfer characteristics, i.e. the sheet conductance G = LI~d/WV~a as a function of the surface field F~ = eiVg/Git, for several samples o f a - S i : H are shown in Fig. 2, where ~, G~ and t are the dielectric constant of the insulator, the dielectric constant of the a-Si:H and the thickness of the insulator respectively. For the samples fabricated with Pn in the range 0.2-1.0 m T o r r at ~ = 230 °C, an n-type response is observed. When PH is varied, the field effect response changes the O N - O F F sheet conductance ratio from 10 at Pn = 0.2 m T o r r to more than 10 a at Pn = 0.6 m T o r r for the same surface field F s of about 2 x 10⁵ V cm 1. The determination of N(E) by means of a Schottky diode capacitance-voltage measurement makes use of the numerical solution of the expression 7.2 ~.22
N(Evs)=l{c(~lG,2+ff'c(ql)dO~}
(4)
where qz is the band bending at any point within the depletion region, 65 is the band bending at the surface and e is the dielectric constant. The major argument for the validity of the assumptions implicit in the use of this expression 8 is that the diffusion theory might be applicable to these devices. The capacitance to be considered is the depletion capacitance Ca, which does not correspond to the measured capacitance Cm. It is necessary to deduce Ca from the measured capacitance C~ and conductance Gin, especially when the material under
GAP STATE DENSITY IN MAGNETRON-SPUTTERED a-Si:H
245
consideration has large variations in its conductivity. We have deduced Cd from the equivalent circuit shown in Fig. 3. Using the expressions used by Snell et al. 23 for Cb, G b and Gd, the values of Cd(V) can be deduced. The variation in the depletion width W with voltage V can be obtained from the variation Cm(V) using the same analysis as Tiedje et al. 24, where the Schottky structure is divided into three regions. The
106
"7 A
I
I
l
I
I
I
I
I
t
lti 7 -
ld 9 ® t.i c
~1 -lO
*.10
"o e-
-11
81o
.... J[ .I'
~16 TM o
1613
1(~
c~
:_J;/ L
J
k ~"
I
[
L
A
i
I
-2.0 -1.0 0 1.0 2.0 3.0 4.0 5-0 6.0 Surface Field (loSv/cm)
t _ _
I
II
Cd
Cb
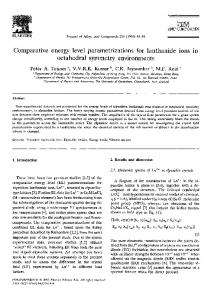
Fig. 2. Sheet conductance as a function of surface field at room temperature for various values of P, (argon pressure, 5.0 mTorr; substrate temperature, 230 °C): IS],0.2 mTorr; e, 0.4 mTorr; m, 0.5 mTorr; A, 0.6 mTorr; A, 1.0 mTorr. Fig. 3. Equivalent circuit of the complete Schottky barrier device: Gb and Cb are the conductance and capacitance in the bulk; Ga and Ca are the conductance and capacitance in the depletion region; the resistances of the contacts are neglected. region near the barrier metal-semiconductor interface is treated as a trap-free dielectric capacitor; the region near the back contact can be treated as a conductor; the intermediate region is controlled by the density of localized states and their communication with the conduction band. The application of an external bias would normally shift the intermediate region at the expense of the capacitive or conductive regions. Consequently the variation in the equivalent capacitance with bias would imply changes in the depletion width. In order to obtain accurate values for Cd(V) we measured changes in Cm and Gm with the voltage, frequency and temperature which enabled us to obtain a reliable general behaviour for Cd 22 and, in particular, values at a low frequency (0.2 Hz) necessary for calculating N(E) from eqn. (4). Accordingly, Fig. 4 shows the measured Cm(V) and GIn(V) characteristics of the Schottky diodes at 0.2 Hz for P, values in the range 0.2-2.0 mTorr. The calculation of N(EF) from the capacitance-conductance variation with
246
H. L. FERNANDEZ-CANQUE, M. C. ABDULRIDA, J. ALLISON
frequency at zero bias makes use of the expression N(Ev) - eLoZ
(5)
where Lo is the Debye length associated with states at the Fermi level s. L o is obtained by a fitting procedure to Cm(Og)and Gm(og). We used a low frequency range to obtain L o and o9o from
(6) and
60oe G(o9o) -
2/{ln(eVbi/k T)} 2
Lo 1 + {2/ln(eVb~/kT)+ 1} 2
(7)
where Vb~is the built-in potential and ogo is the m a x i m u m frequency at which states in the depletion region can c o m m u n i c a t e with the conduction band 8. The starting values ofo9o and L o for the fitting procedure were chosen as the highest co limit of the low frequency range and the average L o for different values of o9 respectively. These o9o and L o values were iterated systematically until, when a best fit was obtained, the difference between the measured and calculated values was always less than 15%. Figure 5 shows the N(E) curve obtained from the field effect and C(V) and G(V) results for a well-characterized material; a point calculated from C(og) and G(og) m e a s u r e m e n t s is also included. A surprisingly sharp increase in N(E) from the 102
10 \.
,,.. f"
i
,j" w/I T
E u c
1()6
u
51
e-
I
1¢
-1,0
(a)
I
-0.6
1
I
I
I
-0-2 0 0-2 Applied Voltage
I
I
0.6 (V)
I
1.0 (b)
-014
' -012 ' () ' 0!2 Applied Voltage (V)
0.4
Fig. 4. (a) Measured conductance and (b) measured capacitance of the whole metal/a-Si: H device as a function of the applied voltage for various values of Pit (measurements were carried out in the dark at room temperature and a frequency of 0.2 Hi: T, - 230 "C): e, 0.2 mTorr; m 0.5 mTorr; A, 0.6 mTorr; [Z, 1.0 mTorr; A, 2.0 mTorr.
GAP STATE DENSITY IN MAGNETRON-SPUTTERED a-Si:H
247
midgap to the conduction band is found by the two methods. N(E) obtained from the field effect is consistently greater than N(E) calculated from capacitanceconductance measurements for the same material. This implies that the reported difference in N(E) is due to the methods used rather than a difference in the properties of the material. We checked our technique using data published by other workers for the three methods and there is no significant discrepancy. The difference found here is more than a decade considering the error bars. The field effect technique is sensitive to the density of defects near the film-substrate interface which might be higher than the average density of bulk defects; the measurement is also sensitive to surface states. These effects will lead to overestimation of the bulk value of N(E). In contrast, capacitance-conductance measurements are strongly dependent on a knowledge of the equivalent circuit parameters. Parameters which are not known a priori, the neglect of Cb and Gb in the low frequency range or of Gd in the high frequency range and the exclusion of contact resistance effects in the C(co) and G(co) method s all lead to underestimation of Cd and coo and therefore underestimation of N(E). All these factors might account partly for the difference between the results obtained using the capacitance-conductance and field effect methods. We tried to reduce these effects by considering the bulk parameters in the C(V) and G(V) measurements and the fact that there is a strong field effect response for magnetron-sputtered material, as seen in Fig. 2, which would imply that the states considered are representative of the bulk states. The estimated error in the various techniques is within a factor of 3 for a wellcharacterized sample. For films with a high density of states in the gap, the error in calculating N(EF) is increased because of the increasing influence of the bulk capacitance, bulk resistance and contact resistance in deducing the depletion capacitance, as the rectification properties of the Schottky diode worsen. Also, the uncertainty in the value of the built-in potential is larger. All these factors will affect the accuracy of estimation of N(EF) when capacitance-conductance methods are used. We studied the influence of variations in PH and T~ at an argon pressure of 5.0 mTorr on the density of states N(EF) near the Fermi level using the three different methods described above. Figure 6 shows the variation in N(Er) with Pn for material deposited at 170°C. It can be seen that N(Er) exhibits a minimum of 8 x 10¹⁶ eV-1 cm-3 at Pn ~ 0.6 mTorr. Also when Pn is increased from 0.6 to 2.0 mTorr, N(EF) increases by nearly one order of magnitude above the minimum. As the deposition temperature increases, N(EF) becomes more sensitive to PH as can be seen in Fig. 7 which gives results for T~ = 230 °C. There is a similarity in the general shape of the two N(EF) versus Pn curves, but different values of N(EF) are also apparent for the various deposition temperatures. Whereas N(EF) at 170 °C reaches a minimum of 8 x 10¹⁶ eV -1 cm -3 at 0.6 mTorr, N(EF) for the 230°C material decreases by about one order of magnitude below that value. Once again N(EF) rises when Pn rises above 0.6 mTorr and it becomes about 1019 e V - 1 cm-3 at 2.0 mTorr, higher than N(EF) at 170 °C for the same PH. Figure 8 shows N(EF) as a function of the substrate temperature at a constant PH of 0.5 mTorr. As can be seen, N(EF) is not very sensitive to variations in the substrate temperature compared with variations in the hydrogen pressure. The minimum N(EF) can be seen from the figure to occur around 230 °C.
248
H. L. FERNANDEZ-CANQUE, M. C. ABDULRIDA, J. ALLISON
2O
20
I
I
18 Z
o, 17
i
I
T
I
i
I 0.4
I 0-8
I 1.2
I 1.6
• 2.0
I
~
'E 19 u "7 >
I
19 a
z
1~
.,J
1(_
16
15 1.2
± 1.0
I __ 0.8
Ec-E
.J 0.6
(eV)
1,s 0.4
Hydrogen
Pressure
(roTor r)
Fig. 5. The density of states distribution in a-Si:H produced by r.f. magnetron sputtering at Pn = 0,6 mTorr, T~- 230~C and an argon pressure of 5.0 mTorr: curve a, calculated from field effect measurements; curve b, calculated from C(V) and G(V) measurements; O , obtained from C(~o}and G(~o) measurements at zero bias. Fig. 6. N(EF) as a function of P. for material deposited at ~ = 170 C: "k, calculated from field effect measurements; "A', calculated from C(V) and G(V) measurements; O , calculated from C(c~) and G(o)) measurements.
It is generally accepted that the deposition parameters have a strong effect on the hydrogen incorporation in and consequently the quality of a-Si:H films. The magnetron target used to deposit the material in this study plays an important role in minimizing the density of states, together with variations of PH and ~. So, it is not surprising to find that N(Ev) decreases with increasing Pn up to a certain value, typically 0.6 m T o r r at both substrate temperatures. This can be assumed to be due to the incorporation of an increasing amount of hydrogen into the a-Si network structure, the decrease in N(Ev) resulting from the passivation of a larger number of dangling bonds. The cause of the increase in N(Ev) at PH higher than 0.6 m T o r r is still not very clear and needs further investigation. Possible explanations for the increase in N(Ev) are as follows: firstly, new defect states are created by the hydrogen; secondly, at higher Pn the incorporation of impurities such as O2, carbon and N 2 might be enhancedZS; thirdly, the different P. values can lead to different S i - H configurations such as (SiHz) . which can lead to additional defect states in the mobility gap. Other measurements on similar materials, such as those on related field effect transistors 3 and photoluminescence measurements 26, confirm that a-Si:H prepared by magnetron sputtering at Pn = 0.6 m T o r r and T~ = 230"C has properties similar to those for glow discharge films and reinforces our finding that its defect density is comparably low. Accordingly, the difference between our results for N(Ev) as a function of P. and those published by other workers for conventional
GAP STATE DENSITY IN MAGNETRON-SPUTTERED
20
249
19 I
I
I!
19
'~: (J
a-Si:H
18
"7>
~'~17 Z
•7 U
3
0
16
15
I
0
I
i
J
1.2 1.6 0.4 0.8 Hydrogen Pressure (mTorr)
t
2.0
16
150
|
200 250 300 Substrate Temperature(C)
Fig. 7. N(EF) as a function of Pn for material deposited at T~ = 230 °C (symbols as for Fig. 6). Fig. 8.
N(Ev) as a function of T~for material deposited at Pn = 0.5 mTorr (symbols as for Fig. 6).
sputtering 27-29 are most probably attributable to the magnetron target used in this study 30,3x. 4. CONCLUSIONS We have demonstrated that differences in the apparent density of states found using field effect and Schottky measurement techniques are due to the methods themselves and not to inherent changes in the material properties. Values of N(E) can vary by as much as a decade depending on the type of measurement. The effect on N(EF) of a variation in P. for a magnetron-sputtered material has also been quantified for the first time. The general behaviour of N(EF) versus Pn, namely a rapid decrease in N(EF)followed by a less rapid increase in N(EF) as Pn increases, is independent of the method of measurement. The substrate temperature does not have as pronounced an influence on N(Ev) as does Pn in the range of investigation (170-260 °C). Finally, it has been demonstrated that magnetron sputtering techniques can be used to produce a-Si:H with a low density of states and similar to some glow discharge materials. ACKNOWLEDGMENTS
The authors wish to thank Mr. D. P. Turner, Mr. A. Mirza and Mr. A. Walker for providing the a-Si:H films and are indebted to them for m a n y helpful discussions. One of the authors (H. L. Fernandez-Canque) has been supported by a grant
250
H. L. FERNANDEZ-CANQUE, M. C. ABDULRIDA, J. ALLISON
from the Science and Engineering Research Council and another (M. C. Abdulrida) by the Ministry of Higher Education and Scientific Research of the Government of Iraq, for which they are extremely grateful. REFERENCES 1 A . J . Lewis. G. A. N. Connell, W. Paul, J. R. Pawlik and R. J. Temkin, AlP Cot!/; Proc., 20 (1974) 27. 2 A . R . Mirza, A. J. Rhodes, J. Allison and M. J. T h o m p s o n , J. Phys. (Paris). Colloq. C4, 10 (1981) 659. 3 M.C. AbdulridaandJ. Allison, ThinSolidFihns, lO2(1983) L43. 4 A. M a d a m P. G. LeComber and W. E. Spear, J. Non-Cryst. Solids, 20 (1976) 239. 5 N.B. G o o d m a n and H. Fritzsche, Philos. Mag. B, 42 (1980) 149. 6 M. Hirose, T. Suzuki and G. H. Dohler, Appl. Phys. Lett., 34 (1979) 234. 7 P. Viktorovitch and D. Jousse, J. Non-Cryst. Solids, 35- 36 (1980) 569. 8 P. Viklorovitch and G. Moddel, J. Appl. Phys., 51 (1980) 4847. 9 K . D . MacKenzie, P. G. LeComber and W. E. Spear, Philos. Mag. B, 46 (1982) 377. 10 J . D . Cohen, D. V. Lang and J. P. Harbison, Phxs. Rev. Lett., 45 (1980) 197. 11 C.H. Hyun, M.S. ShurandA. Madan, AppI. Phys. Lett.,41(1982) 178. 12 B. Von Roedern, L. Ley, M. Cardona and F. W. Smith, Philos. Mag. B, 40 (1979) 433. t3 P. Persans, Philos. Mag. B, 46 (1982)435. 14 P.E. Vanier and R. W. Griffith, Bull. Am. Phys. Soc., 25 (1980) 330. 15 P . D . Connor and J. Tauc, Phys. Rev. Lett., 43 (1979) 311. 16 I. Balberg and D. E. Carlson, Phys. Rev. Lett., 43 (1979) 58. 17 D . A . Anderson and W. Paul, Philos. Mag. B, 44 ( 1981 ) 187. 18 M . J . T h o m p s o n , M. M. A1-Kaisi and J. Allison, in R. Van Overstraeten and W. Palz (eds.), Proc. 2nd Commission qf the European Communities Con£ on Photovoltaic Solar Energy. Berlin, 1979, Reidel, Dordrecht, 1979, p. 303. 19 W . E . Spear and P. G. LeComber, Philos. Mag. B, 33 (1976) 935. 20 W . E . Spear and P. G. LeComber, J. Non-Cryst. Solids, 8--10 (1972) 727. 21 R . A . Abram and P. J. Doherty, Philos. Mag. B, 45 (1982) 167. 22 H . L . Fernandez-Canque, J. Allison and M. J. T h o m p s o n , J. Appl. Phys., in the press. 23 A.J. Snell, K. D. MacKenzie, P. G. LeComber and W. E. Spear, Philos. Mag. B, 40 (1979) 1. 24 T. Tiedje, C. R. Wronski, B. Abeles and J. M. Cebulka, Sol. Cells, 2 (1980) 301. 25 W. Paul and D. A. Anderson, Sol. Energy Mater., 5 ( 1981) 229. 26 P . K . Bhat, A. J. Rhodes, T. M. Searle, I. G. Austin and J. Allison, Philos. Mag. B, 47 (1983) L99. 27 R. Weisfield, P. Viktorovitch, D. A. Anderson and W. Paul, Appl. Phys. Lett., 39 (1981) 263. 28 P. Viktorovitch, G. Moddel, J. Blake, S. Oguz, R. L. Weisfield and W. Paul, J. Phys. (Paris), Colloq. C4, 10(1981)455. 29 T. Tiedje, T. D. Moustakas and J. M. Cebulka, Phys. Rev. B, 23 ( 1981) 5634. 30 J. Webb, J. Appl. Phys., 53 (1982) 9043. 31 H . J . Stein, P. S. Pearcy and M. Peckerar, J. Electron. Mater., 10 (1981) 797.