to 0.3 V. We reveal that the soft error rate (SER) at 0.3 V is eight times higher than SER at 1.0 V, and the ratio of MCUs to the total upsets increases as the supply ...
Alpha-Particle-Induced Soft Errors and Multiple Cell Upsets in 65-nm 10T Subthreshold SRAM Hiroshi Fuketa†∗, Masanori Hashimoto†∗, Yukio Mitsuyama†∗, and Takao Onoye†∗ ∗JST, CREST †Dept. Information Systems Engineering, Osaka University, JAPAN {fuketa.hiroshi,hasimoto,mituyama,onoye}@ist.osaka-u.ac.jp Abstract— This paper presents measurement results of alphaparticle-induced soft errors and multiple cell upsets (MCUs) in 65-nm 10T SRAM with a wide range of supply voltage from 1.0 V to 0.3 V. We reveal that the soft error rate (SER) at 0.3 V is eight times higher than SER at 1.0 V, and the ratio of MCUs to the total upsets increases as the supply voltage decreases. The SER and ratio of MCUs with body-biasing are also described. In addition, we investigate an impact of manufacturing variability on the soft error immunity of each memory cell. In our measurement, a distinct influence of manufacturing variability is not observed even in subthreshold region.
I. I NTRODUCTION Subthreshold circuits, which operate at a lower supply voltage than threshold voltage, are expected to be used for ultralow power applications, such as a sensor-node processor [1], [2]. On the other hand, soft error immunity of subthreshold circuits has become a concern because the ultra-low voltage operation reduces the energy required to cause upsets [3], [4]. Especially, the soft error rate (SER) in SRAM, which often characterize the SER of the entire circuit, must be carefully examined before adopting subthreshold circuits for practical applications. According to [5], the neutron-induced SER in SRAM increases by 18% for every 10% reduction in the supply voltage. Reference [6] reports a trend that decrease in the supply voltage makes the alpha-particle-induced SER dominant in SRAM. However, these measurements were just performed between the nominal supply voltage and 0.8 V. As for soft errors in subthreshold region, single event transient (SET) was recently analyzed with ring oscillators in [3]. On the other hand, the SRAM SER in subthreshold region has not been measured as far as the authors know. This paper is the first work to measure the alpha-particleinduced SER in subthreshold region using a newly designed 65-nm 10T SRAM. Measurement results show that 0.3 V operation increases SER eightfold compared to 1.0 V. In addition, information on frequency of multiple cell upsets (MCUs) is important for error prevention using error checking and correction (ECC) technique. In this paper, we also investigate MCUs in subthreshold region. We reveal that although the ratio of MCUs to the total upsets remarkably increases at lower voltage, conventional ECC technique is still effective in our 10T subthreshold SRAM. Additionally, the dependency of SER on body-bias is evaluated, and measurement results indicate that the SER and the ratio of MCUs are less sensitive to the body-bias voltage when the supply voltage is 0.4 V.
978-1-4244-5431-0/10/$26.00©2010 IEEE
RBL RWL
BL
BL WL
WL M4
M10 M9
M3 M5
M6 M2
RWL RBL M8 M7
M1
VFOOT
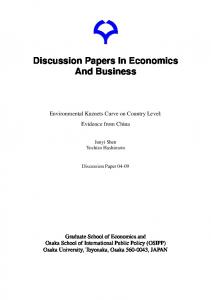
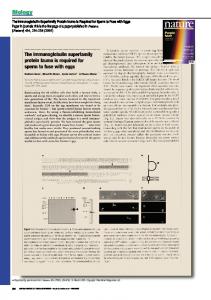
Fig. 1. Structure of the 10T memory cell. WL is only asserted at the write operation and RWL is asserted at the read operation.
Furthermore, we examine the variation in soft error immunity of each memory cell. Reference [7] indicates that the charge required to cause an upset, that is, critical charge varies bit by bit due to manufacturing variability, especially threshold voltage variation, and the variation in critical charge becomes larger as the supply voltage is lowered. In this paper, we investigate the influence of manufacturing variability on the soft error immunity in subthreshold region. Measurement results show that the distribution of the number of SEUs in each memory cell is well explained by the spatial randomness of alpha-particle hits without taking into account critical charge variation due to manufacturing variability. II. SRAM S TRUCTURE In order to measure the SRAM SER over a wide range of supply voltage, SRAM that can operate even in subthreshold region is required. On the other hand, traditional 6T SRAM, which is used in commercial off-the-shelf SRAMs, is scarcely functional in subthreshold region due to weak writability and read instability [8], [9]. Many types of memory cell structure have been proposed to overcome those problems in the lowvoltage operation [9]–[13]. One of the potential solutions is to add a few transistors dedicated to a read port [10]. Based on this technique, 10T [9], [11] and 8T [12], [13] SRAMs achieve subthreshold operation. In this paper, 10T SRAM was newly designed and fabricated. Fig. 1 depicts the structure of designed memory cell. This memory cell is based on the 8T memory cell proposed in [12]. We improved the 8T memory cell such that a differential read operation can be achieved by adding two NMOSs (M9 and M10). VFOOT is used to ensure the correct read operation in subthreshold region [12]. VFOOT of the accessed word is set to low and those of the unaccessed
3A.4.1
IRPS10-213
Vmc Vctrl
5
column decoder
VDDH
memory cell array (70μm x 100μm)
foot driver
row decoder
input/output FFs
2-stage
level converter
output
shift register
pre-charge
input
Soft error rate (a.u.)
VDDL
Memory cell array (2kb)
Micrograph of the test chip
sense amplifiers
4 3 2 1
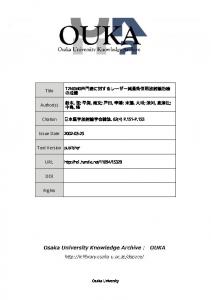
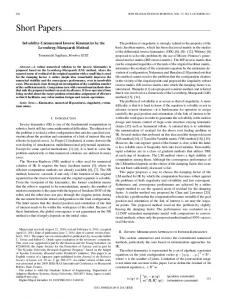
Fig. 2. Block diagram of the SRAM circuit and micrograph of the test chip. 0
0.3
0.4
0.5
0.6
0.7
0.8
0.9
1
Memory cell supply voltage (V) Column decoder
Vctrl
Vmc
Vctrl
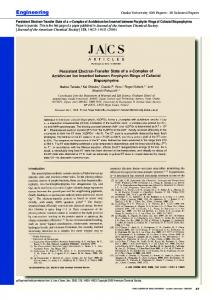
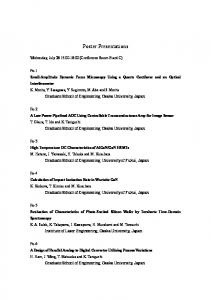
Fig. 4. SERs as a function of the supply voltage of the memory cell array (Vmc ). Each error bar indicates ±3σ, where σ is defined as the square root of the number of the observed upsets.
Vmc
PRE BL RBL
RBL BL
BL RBL
RBL BL
WL RWL
Row decoder
VFOOT
MC
MC
III. E XPERIMENTAL R ESULTS
Sense amplifier
+
WL RWL VFOOT
FOOT driver
MC
+
This section describes measurement results. We used an Am-241 foil, whose flux is 9 × 109 cm−2 h−1 , as an alpha particle source. The main peak energy of the alpha particle is 5.49 MeV. The foil was placed immediately above the die according to [15].
-
MC
-
+
-
Vctrl
A. Sort Error Rate and Multiple Cell Upset
Sense amplifiers
Fig. 3.
Details of the memory cell (MC) array and its control logic.
words remain high. The area of 6T (M1–M6) occupies 80% of the total area (10T) because the size of the cross-coupled inverters (M1–M4) was increased to mitigate threshold voltage variability and to retain the correct data in all bits even in subthreshold region. Fig. 2 shows the block diagram of the SRAM circuit. A test chip was fabricated in a 65-nm CMOS process. 2kb (128 row × 16 column) cells with triple-well structure are implemented, and are verified to be functional from 1.0 V to 0.3 V. This time, any bit-interleaving technique is not implemented in our design. Fig. 3 illustrates the details of the memory cell array and its control logic. Different supply voltages are applied to the memory cell array and the control circuit which consists of the FFs for input/output data and the row/column decoder. The supply voltage of the control circuit Vctrl is higher than the memory cell voltage Vmc . Since the word line (WL) and bit line (BL) drivers operate at Vctrl , strong writability can be achieved, which is similar to socalled “boosted word line” technique [12], [14]. Throughout this paper, Vctrl is set to Vmc + 0.1 V. Signals at Vctrl are converted to the nominal supply voltage VDDH via VDDL by the 2-stage level shifter. For example, a typical configuration at Vctrl = 0.4 V is VDDL = 0.6 V and VDDH = 1.2 V.
IRPS10-214
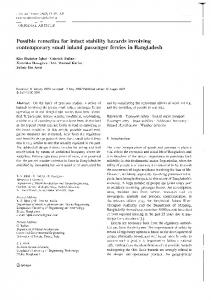
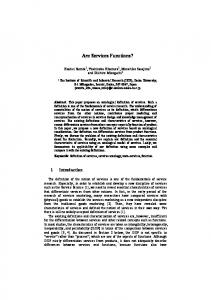
Fig. 4 shows SERs as a function of the supply voltage of the memory cell array (Vmc ). In this experiment, we first wrote zero to all bits in the SRAM. Then, all stored data was read every 10 seconds, and we checked whether each bit was flipped or not to evaluate the SER. The operation frequency in read operation was 5 kHz. Fig. 4 indicates that the SER increases as the supply voltage is reduced, and the SER at Vmc = 0.3 V is eight times higher than that at Vmc = 1.0 V. Next, we focus on the multiplicity of soft errors. Especially, multiple upsets belonging to the same word are critical, because the conventional SEC-DED (Single Error Correction, Double Error Detection) ECC cannot correct two or more errors in a word. As explained in Fig. 5, the occurrence of multiple upsets in adjacent bits depends on the written data pattern [16]. In our memory cell layout, the intra-word upsets might occur in data pattern “01” and “10”. Therefore, we periodically wrote the data pattern “1010 · · ·” to all words and checked the stored data until around 2000 soft errors were observed. Note that two errors originated from different particles might be misjudged as an MCU in this measurement. We, however, estimated the probability of this misjudgment, and the number of such “pseudo” MCUs was below two in this setup. Fig. 6 lists the number of single bit upsets (SBUs) and MCUs and plots the ratio of MCUs to the total number of upsets as a function of the memory cell voltage (Vmc ). All of the observed MCUs were two-bit ones. The ratio of MCUs dramatically increases when Vmc becomes less than 0.6 V. Interestingly, on the other hand, multiple upsets belonging to the same word were observed only once in Vmc = 1.0 V,
3A.4.2
n-well
p-well
“L”
M1
M3
M1
M3
“H” WL
Bit0 (stored value: “0”)
Vmc [V] # of SBU # of MCU 1.0 8 2148 2086 2 0.8 1995 2 0.6 1825 9 0.5 2025 42 0.4 63 2091 0.3
2.5
M4
M2
“H”
3.0
p-well
“L”
Alpha particle
M4
M2
n-well
Ratio of MCU (%)
n-well
Bit1 (stored value: “0”)
(a) intra-word upsets do not occur
2.0 1.5 1.0 0.5 0 0.3
n-well
n-well
p-well
“L”
M3 M2
M4
“H”
n-well
0.4
0.5
0.6
0.7
0.8
0.9
1.0
Memory cell supply voltage (V)
p-well
“H”
Alpha particle
M1
M3
Fig. 6. The number of single bit upsets (SBUs) and multiple cell upsets (MCUs), and the ratio of MCUs to the total upsets (SBU + MCU) as a function of the supply voltage of the memory cell array (Vmc ).
M1
M4
M2
“L” WL
Bit0 (stored value: “0”)
Memory cell unit
Bit1 (stored value: “1”)
sensitive node
(b) intra-word upsets might occur
Bit Line (BL)
: gate : diffusion
0.9um
Fig. 5. Occurrence of multiple upsets in adjacent bits depends on the written data pattern [16]. Only cross-coupled inverters (M1–4 in Fig. 1) are illustrated in this figure. In our memory cell layout, intra-word upsets might occur in data pattern “01” and “10”, and do not occur in “00” and “11”.
0.8μm 4.4μm
and all other MCUs occurred in inter-word adjacent bits. This means the conventional ECC technique is still effective for robust operation in subthreshold region. We here discuss the reason why the MCUs only arose in inter-word adjacent bits in subthreshold operation. Fig. 7 illustrates the layout of the memory cell array. The drains of P/NMOSs in the cross-coupled inverter pair are sensitive to alpha particles. The distance between the sensitive nodes of the adjacent rows is 1/5 shorter than that of the adjacent columns. In the designed 10T cells, the NMOSs for the read operation (M7–10 in Fig. 1) are located between the adjacent columns, which makes horizontally-adjacent cells distant. Thus, adjacent bits in different words along bit lines are more likely to upset. Next, we measure the dependence of the SER and MCU on the body-bias voltage of the memory cells at Vmc = 0.4 V and 1.0 V. Fig. 8 shows the measurement results. When Vmc is 1.0 V, the SERs at 1.0 V-RBB (reverse body bias) and at 0.3 V-FBB (forward body bias) increase by more than 30% compared to the SER at ZBB (zero body bias), whereas when Vmc is 0.4 V, the SERs at 1.0 V-RBB and 0.3 V-FBB are higher by below 10% than the SER at ZBB. In addition, although FBB raises the ratio of MCUs to the total upsets at Vmc = 1.0 V, body-bias does not affect the ratio so much at Vmc = 0.4 V. The SER and the ratio of MCUs are less sensitive to the body-bias at 0.4 V than those at 1.0 V.
NMOSs for read operation
Word Line (WL)
Fig. 7. Layout of the memory cell array. Blue ellipses indicate sensitive nodes for alpha particles. The NMOSs for the read operation (M7–10 in Fig. 1) are located between the adjacent columns.
B. Variation in Soft Error Immunity In this section, we investigate the influence of the critical charge variation due to manufacturing variability on the soft error immunity. We measured the number of soft errors in each memory cell for around 16 hours (the total number of errors was 300K) when the memory cell voltage (Vmc ) is 0.3 V. Fig. 9 shows the distribution of the number of soft errors in each memory cell in a single chip. This figure indicates that the number of errors varies bit by bit. In order to clarify whether this variation is caused by statistical variation due to the spatial randomness of particle hits or by the critical charge variation, we performed a Monte Carlo simulation with the following procedure:
3A.4.3
1) Let Pi be the occurrence probability of errors in the i th memory cell (0 ≤ i ≤ 2047). 2) An integer number n and a real number p are randomly generated. n and p satisfy 0 ≤ n ≤ 2047 and 0 ≤ p < 1, respectively.
IRPS10-215
4
4
3
3
2
2
1
1
RBB 0
-1.0
700 600
Frequency
5
Ratio of MCU (%)
Soft error rate (a.u.)
5
0
0.3
0
Fig. 9. Measured distribution of the number of soft errors in each memory cell in a single chip (Vmc = 0.3 V). The total number of errors is 300K. The values in parentheses represent the 95% confidence interval of the standard deviation.
3 2.5 0.8
2
0.6
1.5
0.4
1
0.2
0.5 0
0.3
Ratio of MCU (%)
Soft error rate (a.u.)
1
-0.5
in the number of errors in addition to the spatial randomness of particle hits, the distribution of the number of errors becomes different from the Poisson distribution like Fig. 10-(b). The distribution of Fig. 9 is normally distributed, and its standard deviation is close to that of Fig. 10-(a). This implies that the both distributions are almost identical and follow the Poisson distribution. This means that the variation shown in Fig. 9 is explained by the spatial randomness of particle hits, and the influence of the critical charge variation was not distinguishably observed even at Vmc = 0.3 V.
0
Body bias voltage (V) (b) Vmc = 1.0 V Fig. 8. Dependence of the SER and the ratio of MCUs on the body-bias voltage of the memory cells. “RBB” and “FBB” denote reverse body-bias and forward body-bias, respectively. Each error bar indicates ±3σ.
3) If p is less than Pn (p < Pn ), we consider that an upset occurs in the n th memory cell. 4) Steps 2) and 3) are repeated until the total number of upsets reaches 300K. Consequently, the number of errors in each memory cell is obtained. Fig. 10 shows the simulated distribution of the number of errors in each memory cell. Here, we assume that the occurrence probability of errors P = {P0 P1 · · · P2047 } is normally distributed with mean μP and standard deviation σP . In this simulation, μP is set to 0.5. Fig. 10-(a) depicts the simulated distribution in the case where σP is zero, that is, the occurrence probability of errors in each memory cell is the same. Fig. 10(b) shows the distribution when σP /μP is 0.1. The distribution of Fig. 10-(a) is normally distributed, and its standard deviation √ is equivalent to the square root of the mean ( 147.4 = 12.14). This means that Fig. 10-(a) obeys the Poisson distribution. If the variation in the number of errors is caused only by the spatial randomness of particle hits, the occurrence probability of errors in each memory cell is the same (σP = 0). In this case, the distribution of the number of errors follows the Poisson distribution as shown in Fig. 10-(a). On the other hand, if the critical charge fluctuation influences the variation
IRPS10-216
110 120 130 140 150 160 170 180 190 200
Number of errors
(a) Vmc = 0.4 V
-1.0
300
100
0
Body bias voltage (V)
0
400
200
FBB -0.5
500
mean : 147.4 std. dev. : 12.38 (12.00-12.77)
IV. C ONCLUSION In this paper, we presented alpha-particle-induced SERs and MCUs in subthreshold region of a designed 10T SRAM in a 65-nm CMOS process. The measurement results showed that the SER increases as the supply voltage is lowered and SER at 0.3 V is eight times higher than SER at 1.0 V. We also pointed out that the ratios of MCUs to the total upsets in subthreshold region are much higher than those in super-threshold (nominal supply voltage) region, yet the conventional ECC is still valid because intra-word multiple upsets were not observed in subthreshold region. We additionally revealed that the SER and the ratio of MCU are less sensitive to body-bias at 0.4 V supply voltage. Furthermore, we investigated the influence of the critical charge variation due to manufacturing variability on the soft error immunity in each memory cell. Measurement results indicated that the influence of the critical charge variation was not recognizably observed even in subthreshold region. ACKNOWLEDGMENTS This research was performed by the authors for STARC as part of the Japanese Ministry of Economy, Trade and Industry sponsored “Next-Generation Circuit Architecture Technical Development” program. The VLSI chip in this study has been fabricated in the chip fabrication program of VLSI Design and Education Center (VDEC), the University of Tokyo in collaboration with STARC, e-Shuttle, Inc., and Fujitsu Ltd. This study was partly supported by NEDO.
3A.4.4
700
700
mean : 147.4 std. dev. : 12.24 (11.88-12.63)
600
Frequency
Frequency
500 400 300 200
500 400 300 200
100 0
mean : 147.4 std. dev. : 19.17 (18.60-19.78)
600
100 0
110 120 130 140 150 160 170 180 190 200
Number of errors
80
100
120
140
160
180
200
220
Number of errors
(a) σP = 0 (the occurrence probability of errors in each memory cell is the same)
(b) σP / μP = 0.1
Fig. 10. Simulated distribution of the number of errors in each memory cell. The total number of errors is 300K. The values in parentheses represent the 95% confidence interval of the standard deviation. The simulation assumes that the occurrence probability of errors is normally distributed with mean μP 2 )). and standard deviation σP (P ∼ N (μp , σP
R EFERENCES [1] M. Seok, S. Hanson, Y. Lin, Z. Foo, D. Kim, Y. Lee, N. Liu, D. Sylvester, and D. Blaauw, “The Phoenix Processor: A 30pW Platform for Sensor Applications,” in Symp. VLSI Circuits Dig. Tech. Papers, pp. 188–189, 2008. [2] N. Ickes, D. Finchelstein, and A. Chandrakasan, “A 10-pJ/instruction, 4-MIPS Micropower DSP for Sensor Applications,” in Proc. ASSCC, pp. 289–292, 2008. [3] M.C. Casey, B.L. Bhuva, S.A. Nation, O.A. Amusan, T.D. Loveless, L.W. Massengill, D.McMorrow, J.S. Melinger, “Single-event effects on ultra-low power CMOS circuits,” in Proc. IRPS, pp. 194–198, 2009. [4] R. Garg and S.P. Khatri, “3D Simulation and Analysis of the Radiation Tolerance of Voltage Scaled Digital Circuit,” in Proc. ICCD, pp. 498– 504, 2009. [5] P. Hazucha, T. Karnik, J. Maiz, S. Walstra, B. Bloechel, J. Tschanz, G. Dermer, S. Hareland, P. Armstrong, and S. Borkar, “Neutron Soft Error Rate Measurements in a 90-nm CMOS Process and Scaling Trends in SRAM from 0.25-mm to 90-nm Generation,” in IEDM Tech. Dig., pp. 21.5.1–21.5.4, 2003. [6] Y. Tosaka, H. Ehara, M. Igeta, T. Uemura, H. Oka, N. Matsuoka, and K. Hatanaka, “Comprehensive Study of Soft Errors in Advanced CMOS Circuits with 90/130 nm Technology,” in IEDM Tech. Dig., pp. 38.3.1– 38.3.4, 2004. [7] A. Balasubramanian, P.R. Fleming, B.L. Bhuva, O.A. Amusan, and L.W. Massengill, “Effects of Random Dopant Fluctuations (RDF) on the Single Event Vulnerability of 90 and 65 nm CMOS Technologies,” IEEE Trans. Nucl. Sci. vol. 54, no. 6, Dec. 2007. [8] M. Yamaoka, N. Maeda, Y. Shinozaki, Y. Shimazaki, K. Nii, S. Shimada, K. Yanagisawa, and T. Kawahara, “Low-Power Embedded SRAM Modules with Expanded Margins for Writing,” in ISSCC Dig. Tech. Papers, pp. 480–481, 2005. [9] B. H. Calhoun and A. Chandrakasan, “A 256-kb 65-nm Sub-threshold SRAM Design for Ultra-Low-Voltage Operation,” IEEE J. Solid-State Circuits, vol. 42, pp. 680–688, Mar. 2007. [10] L. Chang, D.M. Fried, J. Hergenrother, J.W. Sleight, R.H. Dennard, R.K. Montoye, L. Sekaric, S.J. McNab, A.W. Topol, C.D. Adams, K.W. Guarini, and W. Haensch, “Stable SRAM Cell Design for the 32 nm Node and Beyond,” in Symp. VLSI Technology, Dig. Tech. Papers, pp. 128–129, 2005. [11] T.H. Kim, J. Liu, J. Keane, and C.H. Kim, “A High-Density Subthreshold SRAM with Data-Independent Bitline Leakage and Virtual Ground Replica Scheme,” in ISSCC Dig. Tech. Papers pp. 330–331, 2007. [12] N. Verma and A. Chandrakasan, “A 65nm 8T Sub-Vt SRAM Employing Sense-Amplifier Redundancy,” in ISSCC Dig. Tech. Papers, pp. 328–329, 2007.
[13] T.H. Kim, J. Liu, and C.H. Kim, “A Voltage Scalable 0.26V, 64kb 8T SRAM with Vmin Lowering Techniques and Deep Sleep Mode,” in Proc. CICC pp. 407–410, 2008. [14] I.J. Chang, J.J. Kim, S.P. Park, and K. Roy, “A 32 kb 10T Sub-Threshold SRAM Array With Bit-Interleaving and Differential Read Scheme in 90 nm CMOS,” IEEE J. Solid-State Circuits, vol. 44, no. 2, pp. 650–658, Feb. 2009. [15] JEDEC standard JESD89, “Measurement and Reporting of Alpha Particles and Terrestrial Cosmic Ray-Induced Soft Errors in Semiconductor Devices.” [16] N. Mikami, A. Oyama, H. Kobayashi, H. Usui, and J. Kase, “A Novel Technique for Mitigating Neutron-Induced Multi-Cell Upset by means of Back Bias,” in Proc. IRPS, pp. 187–191, 2008.
3A.4.5
IRPS10-217