hydro-tectonic regime in El-Arish area, northern Sinai Peninsula. Mohamed A. Khalil a,b,â, Fernando M. Santos a, Mohammad Farzamian a a Universidade de ...
Journal of Applied Geophysics 103 (2014) 104–113
Contents lists available at ScienceDirect
Journal of Applied Geophysics journal homepage: www.elsevier.com/locate/jappgeo
3D gravity inversion and Euler deconvolution to delineate the hydro-tectonic regime in El-Arish area, northern Sinai Peninsula Mohamed A. Khalil a,b,⁎, Fernando M. Santos a, Mohammad Farzamian a a b
Universidade de Lisboa, Centro de Geofísica da Universidade de Lisboa — IDL, Campo Grande, Ed. C8, 1749-016 Lisboa, Portugal National Research Institute of Astronomy and Geophysics, Helwan, Cairo, Egypt
a r t i c l e
i n f o
Article history: Received 13 September 2013 Accepted 24 January 2014 Available online 1 February 2014 Keywords: 3D gravity inversion Euler deconvolution Sinai Peninsula El-Arish
a b s t r a c t Sinai Peninsula occupies a part of the arid zone belt of northern Africa and southwestern Asia. The largest ephemeral stream in the Sinai Peninsula is called Wadi El-Arish, which winds down northward to the Mediterranean Sea. The delta of Wadi El-Arish has been built by the heavy floods of the Wadi. The Quaternary aquifer is the main water supply of the delta of Wadi El-Arish and its vicinities. The combined action of aridity and extensive pumping from the Quaternary aquifer led to a noticeable increase in groundwater salinity. The hydrochemistry and isotope hydrology confirm that the Quaternary aquifer is recharged by an old saline groundwater from the Pre-Quaternary. A hydrogeological connection between Quaternary and Pre-Quaternary aquifers in the form of fault(s) should exist to explain the hydro-tectonic regime of this area. The Bouguer gravity map shows the high gravity anomaly of the doubly plunging anticline of Risan Aniza Mountain to the south of El-Arish area, which is a part of the Syrian Arc System of northern Sinai Peninsula. A 3D density contrast model, 3D Euler deconvolution, horizontal derivative and least square separation have been performed. The findings showed that (1) two deep regional faults extending NE–SW, surround the Risan Aniza anticline, and (2) two deep local N–S faults are in the area of Delta Wadi El-Arish. These deep faults are proposed to bring the deep Cretaceous aquifer into contact with the shallow Quaternary aquifer and work as a hydrogeological connection between both aquifers. The present hypothesis has some geological evidences from the subsurface lithology of the nearby wells. © 2014 Elsevier B.V. All rights reserved.
1. Introduction The high salinity zone to the east of El-Arish area has been observed by many authors, among them are Abu-Zeid (1995), Dames and Moor (1984), RIWR (1989), JICA (1992), and Khalil (2002). The hydrochemical and isotope hydrological studies (Khalil, 2002) showed a high ratio of ground water salinity up to 7500 mg/l to the east of El-Arish City. The mixing ratio between Quaternary and PreQuaternary aquifers is estimated using stable isotopes (18O and 2H) to be from 70% to 76% of Quaternary water and from 30% to 24% of PreQuaternary water. In addition, C-14 and tritium dating showed that the groundwater samples of the Quaternary aquifer have an age ranging from 933 to 8.892 Y BP forming a mixture between sub-modern and recent recharge (Khalil, 2002). From the geological, hydrochemical and isotope hydrological studies, the upward flow of old, high-salinity water under the effect of high pumping rate implies the presence of fault(s) system working as a hydrogeological connection between the two aquifers. The aim of the present study is to elucidate the relation between tectonics of
⁎ Corresponding author at: Universidade de Lisboa, Centro de Geofísica da Universidade de Lisboa—IDL, Campo Grande, Ed. C8, 1749-016 Lisboa, Portugal. 0926-9851/$ – see front matter © 2014 Elsevier B.V. All rights reserved. http://dx.doi.org/10.1016/j.jappgeo.2014.01.012
Fig. 1. Location map of the study area.
M.A. Khalil et al. / Journal of Applied Geophysics 103 (2014) 104–113
105
Legend: Qsd: Quaternary sandstone and sheets. Qw: Quaternary wadi deposits Qp: Quaternary playa deposits Kml: Cretaceous, Malhah Formation (Albian-Aptian). Kaolinized sandstone, intercalated with mudstone, paleosoil, conglomerate and fossiliferous limestone
bands. Khll: Cretaceous , Halal Formation,(Cenomanian) Alternate beds of dolomite, dolostone, marl, and clay . Commonly rich in fossils Inferred faults from gravity inversion
Jmsh: Jurassic, Mashabbah Formation (Lower Liassic) crossbedded sandstone intercalated with clay beds. Jbgh: Jurassic , Bir Maghara Formation (Bajocian) coralline limestone intercalated with calcareous clays and algal limestone Jsh : Jurassic, Shushah Formation. (Upper Liassic) brown, fine to course-grained sandstone with intercalations of carbonaceous clay. Cultivated area. Surface faults hydrogeologic cross-section
Fig. 2. Geological map of El-Arish area (after Egyptian Geological Survey and Mining Authority, 1993).
northern Sinai and the hydrogeological regime focusing on the salt water intrusion in the El-Arish area. The area of Wadi El-Arish is located in the northern part of the Sinai Peninsula. It is delineated by latitudes 30° 50′ and 31° 20′ N, and longitudes 33° 40′ and 34° 10′ E (Fig. 1). The present study is an approach to understand the influence of different structural elements in the hydrogeological system of Wadi El-Arish area, taking into consideration the complicated tectonics of northern Sinai, which developed due to accumulated effect of different tectonic events. An attempt is made to estimate a 3D density contrast model and a 3D Euler solution. The horizontal derivative and least square separation are performed as well. 3D gravity inversion results in a density contrast mode and/or the shape and dimensions of the density variations. It adjusts density contrasts of the prismatic cells of a three dimensional model to minimize the residual between gravity data and the model response. Many
authors have studied and applied this inverse problem in different areas (e.g. Camacho et al., 2000, 2002; Gottsmann et al., 2008; Khalil and Santos, 2013; Montesinos et al., 2003; Patricia et al., 2013; Schiavone and Loddo, 2007). 2. Geological and hydrogeological setting The geological succession of Wadi El-Arish area has been studied by several authors among them are Said (1990) and Shata (1956, 1959). The geological succession from top to bottom is as follows: 1) Holocene deposits: a Sand dune accumulations: Sand dunes in northern Sinai have different forms such as low beach dunes, elongated dune ridges, and disconnected lenses. Holocene sand dune is composed mainly of fine to coarse quartz grains. Sand dunes of northern Sinai
106
M.A. Khalil et al. / Journal of Applied Geophysics 103 (2014) 104–113
A
A' (NE)
J2
(SW) A10
3
1-88
1
18
16
1-137
Depth in Meter
20 0 -20 -40 -60 -80 0
-100 A10
Borehole location and number
Sand
Loam
Calc.S.S (Kurkar)
Gravel
km
1
Clay & sandy Clay
Limestone
Fig. 3. Geologic cross section A–A′.
act as local collectors of the percolated precipitation. The thickness of the sand dunes ranges from 2 to 40 m (Figs. 2 and 3). b Modern beach deposits: Modern beach deposits are distributed along the coastal belt of northern Sinai and extended to Gaza. It is either developed into loose sand or into consolidated sandstone with shell fragments cemented by calcium carbonate. 2) Pleistocene deposits: a Upper Pleistocene old beach deposits Upper Pleistocene old beach deposits are distributed in the coastal zone underlying the sand dune deposits. It has a lenticular shape, which is made up of yellow to grayish white, rounded to subrounded, fine to coarse grain sands, partially cemented with silty materials and clay intercalation. The thickness of the Upper Pleistocene old beach deposits ranges from 6 to 44 m. The Upper Pleistocene old beach aquifer is the main fresh water bearing aquifer being exploited for urban water supply in El-Sheikh Zwayed–Rafah coastal zone (Mohamed, 1994). b Lower Pleistocene calcareous sandstone (Kurkar): It consists of grayish white calcareous sandstone with alga, shell fragments and rare chert pebbles. It is distinguished into upper continental Kurkar and lower marine Kurkar (Taha, 1968). It has a large geographical distribution on the coastal area. It extends from the northern Sinai to Lebanon. The thickness of Kurkar deposits ranges from 12 to 63 m (Mohamed, 1994). 3) Pre-Quaternary: In the El-Arish area and its vicinity, the Quaternary deposits are directly underlain by the Upper Cretaceous sediments, which consist mainly of chalky limestone and shales in the upper part (Senonian) and limestone, dolomites, dolomitic limestone and marls in the lower part (Turonian and Cenomanian). The lower
boundary of the Upper Cretaceous aquifer is a marly or shaly aquiclude changed into calcareous sandstone toward the south. The upper boundary is the base of the overlying Tertiary formations, which dominate the major part of central and northeastern Sinai and cause confinement to the aquifer (Zaghloul and Khidr, 1992). As shown in the geologic cross sections A–A′ and B–B′ (Figs. 3 and 4), the Upper Cretaceous limestone is directly overlain by Kurkar deposits in borehole Nos. J2, 2–26, 5–5, and El-Magdaba, which may indicate some inferred faults in the area. From a hydrogeological point of view, the Quaternary aquifer consists of four main water bearing formations (Figs. 2 and 3): Holocene sand dune aquifer, Upper Pleistocene old beach aquifer, Gravel aquifer (alluvium deposits) and Lower Pleistocene calcareous sandstone aquifer (Kurkar or Fagra). The differentiation in the lithological logs between sand dune deposits and old beach sand deposits is rather difficult. The old beach sand overlain by dune sand is assumed to be one of the prospecting aquifers in the area. The thickness ranges from 7 to 40 m. Considering the subsurface conditions, the three water bearing horizons are hydraulically connected and no significant difference has been recorded between the piezometers of the three aquifers. 3. Tectonic elements The main tectonic elements of the northern Sinai have been developed due to regional and local tectonic movements. The regional tectonic movements and its associated tectonic elements can be summarized chronologically from the oldest as follow:
B'
B
Depth in meter
100 80 60 40 20 0 -20 -40 -60 -80 -100 -120
(SE)
(NW)
El-Magdaba well Qirai well 2-26
A3
1-134
5-5
Test well A
Jica-18
1-141
Sand dune (Holocene)
Gravel (U. pleistocene)
Calc.S.S ( Kurkar) (L.Pleistocene)
Loam (U.Pleistocene)
Shale {Tertiary)
sandstone (U.Pleistocene)
Marl & sandy marl (L.Eocene)
Clay (Quternary)
Fig. 4. Geologic cross section B–B′.
Limestone (Cretaceous)
0
Km.
5
A3
Borehole location and number
M.A. Khalil et al. / Journal of Applied Geophysics 103 (2014) 104–113
107
Fig. 5. Tectonic map of Sinai (after Neev, 1975 and Agah, 1981).
1) Opening of the Tethys The breakup of North Africa–Arabia in Late Triassic–Liassic time and the opening of the Tethys took place and reactivated ENE– WSW-oriented deep-seated faults. The southern and central sectors of Sinai were uplifted, relative to the northern (onshore and offshore) sector (Bartov et al., 1980). The influence of this event has resulted in the development of a thick wedge of the Early and Middle Mesozoic sediments (Triassic, Jurassic and Early Cretaceous) in the northern sector and its abrupt thinning to the south. Structurally, this phase was dominated by Jurassic NW–SE leftlateral oblique extension which resulted in ENE- to NE-trending normal faulting (Aal and Lelek, 1994). 2) Syrian Arc System During the Late Cretaceous to Early Tertiary (Laramide) time, Africa moved west-northwest relative to Eurasia, which closed the Tethys Sea and produced a right-lateral shear couple between North Africa and Eurasia (Smith, 1971). This shear couple started in the Turonian, climaxed in the Late Cretaceous and decreased into the Early Tertiary, causing the right-lateral rejuvenation of the deep-
seated faults in north Egypt (Smith, 1971). This tectonic event produced a series of close, parallel asymmetrical NE to ENE oriented doubly plunging anticlines, which pertain to the Syrian Arc System trending N65° to 85°E and form the main topographic highs of the region. One of the main anticline features to the south of El-Arish area is the Risan Aniza–El-Kharruba anticline (Fig. 2). It is a capacious surface anticlinal structure, which is a member of El-Maghara anticlinal series. This anticlinal structure exposes the Jurassic rocks on the crestal portion, and the flanks are determined by dolomitic limestone belonging to the Lower Cretaceous and to the Cenomanian. Such flanks are extensively covered by sandy and also alluvial deposits of Wadi El-Arish. The northeastward extension of this anticline is detected at El-Kharruba by drilling between Risan Aniza and El-Kharruba (RIWR, 1989). Moustafa and Khalil (1989) classified northern Sinai anticlines into: large: tens of kilometers long mountains (Maghara, Yelleq and Halal), intermediate: several kilometers long mountains (e.g. Minsherah, Kherim, Arif El-Naqa) and small folds: less than 2 km in length. The large and intermediate folds are asymmetric. Six
108
M.A. Khalil et al. / Journal of Applied Geophysics 103 (2014) 104–113
Fig. 6. Bouguer gravity anomaly map of northern Sinai (after Standard Oil Company of Egypt S.A., 1952).
east-northeast elongated subbelts of right-stepped en echelon folds are recognized in northern Sinai (Moustafa and Khalil, 1989). These belts probably overlie deep-seated normal faults of the Early Mesozoic passive continental margin. 3) Sinai triple junction The uneven rate of northward movement for the ‘central plate’ (The Sinai and Arabian subplate) and the adjacent northwest Africa and Iranian plates in the Upper Paleozoic was postulated by Neev and Friedman (1978). The faster rate of movement of the central plate caused it to be wedged between the two adjacent plates. Three enechelon sinistral transcurrent faults are recognized at the western periphery of the central plate: The Qattara–El-Alamin–Eratosthenes shear, The Pelsium line, and the Gulf of Elate–Dead Sea–Jordan shear. The first phase of movement along the Gulf of Elate–Dead Sea– Jordan shear occurred in the Upper Oligocene or lower Miocene, in association with the opening of the Red Sea. This phase is obviously clear in Sinai where, Sinai is flanked by the two corresponding shear fault systems related to the opening of the Red Sea. One of them took place along the Gulf of Aqaba (Elate), a N15°E sinistral strike–slip movement simultaneously, right-lateral shear faulting, trending N35°W, developed along the Gulf of Suez. This movement is called Sinai triple junction (Courtillot et al., 1987). This movement is responsible for the major faults (Fig. 5) which cross central Sinai (Said, 1990). Some authors separate this tectonic event into two phases. (1) The rifting of the Gulf of Suez that started during the latest Oligocene to the earliest Miocene (Evans, 1990), and (2) The Late Miocene to Recent Gulf of Aqaba rifting (Eyal et al., 1981). The local tectonic movements “inside Sinai” are defined in two shear zones: Ragabet EI-Naam and Minsherah–Abu Kandu shear zones. These two shear zones in addition to the Pelsium line subdivided Sinai Peninsula into four provinces that are separated by three NNE–SSWand ENE–WSW-trending major tectonic dislocation “shear zones”. The major fold belts are: 1) Ragabet EI-Naam Shear Zone, named Central Sinai Shear Zone by some authors, is the most southern belt and is probably a reactivated Paleozoic trend (Beyth, 1981). Dominance of E–W- and ENE–WSWtrending wrench faults and folds are interpreted by Aal and Lelek (1994) as a result of pure shear forces. This shear zone separates
Fig. 7. Horizontal gradient perpendicular to N35°W (A) and N15°E (B). Dashed white lines outline the inferred faults.
the southern sector of the Sinai Peninsula, known as the stable shelf area by Said (1990), with the exposed Precambrian basement from the transitional zone. 2) Minsherah–Abu Kandu Shear Zone separates the transitional zone, where both compressive and wrench stresses affected central Sinai and resulted in creating flower structures along prominent rightlateral shear zones (Harding, 1985) and the unstable shelf in north Sinai. Such flower structures have a remarkable thinning of the sedimentary section along the ENE-trending Jurassic wedge-edge, e.g., Jebel El-Minsherah (Aal and Lelek, 1994). 4. Gravity data The Bouguer gravity anomaly map of the Sinai Peninsula is compiled from the gravity surveys conducted by the Standard Oil Company of Egypt S.A., The Anglo-Egyptian Oilfields Ltd., The Socony Vacuum Oil
M.A. Khalil et al. / Journal of Applied Geophysics 103 (2014) 104–113
109
anticline fold belt is a part of the Syrian Arc System trending N65° to 85°E. It produced a series of close; parallel asymmetrical NE to ENE oriented doubly plunging anticlines, which form the main topographic highs of the northern Sinai Peninsula. The Risan Aniza high gravity anomaly is decreasing gradually in the NE direction nearby Sheikh Zwayed area. 5. Data processing 5.1. Horizontal derivative The first degree horizontal derivative performed in a particular direction can look up lateral changes of the gravitational field and attenuates its regional tendency along that direction. In areas where the density contrast is higher, the first degree horizontal derivative will arrive at its highest or least. In view of that, it is a good technique to outline the density discontinuity in a direction perpendicular to the direction of derivation. According to the Sinai triple junction model, Sinai is flanked by the two corresponding shear fault systems related to the opening of the Red Sea. One of them is the right-lateral shear faulting, trending N35°W, developed along the Gulf of Suez simultaneously (Courtillot et al., 1987), or successively (Evans, 1990; Eyal et al., 1981) a N15°E sinistral strike–slip movement which took place along the Gulf of Aqaba (Elate). The first degree horizontal gradient is performed in perpendicular directions to the two mentioned directions. Fig. 7A shows the lateral changes of the gravitational field in a direction perpendicular to N35°W, which is the direction of the opening of the Gulf of Suez. There are no sharp contrast zones that could be observed. In the other direction – perpendicular to N15°E – shown in Fig. 7B, two major contrast zones extending in the NE–SW direction are perceptibly clear. These two major discontinuities bounded Risan Aniza anticline from its northern and southern directions. 5.2. Least square separation
Fig. 8. Residual (A) and regional (B) first order least square separation.
Company Inc. and South Mediterranean Oilfields Ltd. Instruments used are Thyssen, Carter and Mott-Smith gravimeters which have a sensitivity range between + 0.5 and 1.0 mgal. The present Bouguer gravity anomaly map is published by the Standard Oil Company of Egypt S.A. (1952). Fig. 6 shows the Bouguer gravity anomaly map of El-Arish area, which has the location of measured data points. The map is digitized in a 1 × 1 km regular grid. The spacing of data points ranges from 3 km in some locations to less than 1 km in other locations such as the northwestern part of Risan Aniza Mountain. The density of data points depends on the accessibility of the location and the spatial distribution of the anomaly under investigation. Generally, it shows a good coverage of data points within the study area. The Bouguer anomaly map has been corrected due to topographic variations (terrain correction). Fig. 6 shows the local high gravity anomaly of Risan Aniza anticline fold belt (G. Risan Aniza) to the south of El-Arish area. Risan Aniza
The Bouguer anomaly map is an involvement of a long-wavelength gravity anomaly resembling the large, deep-seated features “regional anomaly”, and short-wavelength anomalies resulted from the smaller and shallower geological features “residual anomaly”. Computing the regional field and further separation from the Bouguer anomaly will result in a residual gravitational field. Many empirical and analytical methods could be used to separate regional and residual anomalies discussed in many text books such as Telford et al. (2001), and Reynolds (1997). In the present study the least square polynomial regression (Agocs, 1951) has been applied in different orders. The most reasonable order of separation is selected using the method of Abdelrahman et al. (1999), in which, the correlation coefficient between consecutive least-squares residual anomalies has been considered. The highest correlation coefficient is found to be 0.99 between 1st and 2nd order residual gravity anomaly maps. Accordingly, the lowest order is used (Fig. 8). Fig. 8 shows the regional and residual anomalies obtained by a first order least square separation of the study area. The residual anomaly map (Fig. 8A) outlines the positive superficial anomaly of Risan Aniza anticline to the south of El-Arish area. A small scale positive gravity anomaly can be observed as well in the northeastern direction of the study area. 5.3. 3D Euler deconvolution The main objective of the Euler 3D process is to produce a map that shows the locations and depths of the geologic sources of the gravity or magnetic anomalies observed in a two-dimensional grid. Euler 3D process is based on Euler's homogeneity equation; an equation that relates the field and its gradient components to the location of the
110
M.A. Khalil et al. / Journal of Applied Geophysics 103 (2014) 104–113
Fig. 9. Euler solution for SI = 0 (A), SI = 1 (B), and SI = 2 (C).
source, with the degree of homogeneity N, which may be interpreted as a structural index (Thompson, 1982). This system uses a least square method to solve Euler's equation simultaneously for each grid position with sub-grid (window). The Structure Index (SI) is an exponential factor corresponding to the rate at which the field falls off with distance, for a source of a given geometry. The value of SI parameter depends on the type of the source body and the potential field (gravity or magnetic). For example in gravity field the SI value is equal to zero for a sill or dyke or step, 1 for a pipe, and 2 for a sphere. For the study area, total gravity field is used to produce different Euler solutions using SI of 0, 1, and 2 (Fig. 9A, B, C). Euler solution of SI equal to 0 is selected as a reasonable solution, where it outlines the steep contacts between gravity anomalies. The contacts between gravity anomalies represent the inferred faults in the area under study. The trend and distribution of the major inferred faults are generally in agreement with the findings of the horizontal derivative
map (Fig. 7B), in which two major NE–SW regional faults bounding Risan Aniza anticline can be easily detected. Other two local N–S faults exist precisely in the Delta of Wadi El-Arish to the north. These two faults can explain the existence of the Delta in that area particularly. The geological cross section A–A′ (Fig. 3) shows some geological evidences for the existence of these two faults particularly in well No. J2. 5.4. 3D gravity inversion The 3D density contrast model for the study area is estimated using the GRABLOX (V 1.6) software (Pirttijarvi, 2008). GRABLOX is a gravity interpretation and modeling software based on a 3D block model. The main objective is to optimize the density contrast and/or the shape and dimension of the density variations. GRABLOX computes the synthetic gravity anomaly of a 3-D block model; a large rectangular super block, which is divided into smaller brick-like volume elements.
M.A. Khalil et al. / Journal of Applied Geophysics 103 (2014) 104–113
111
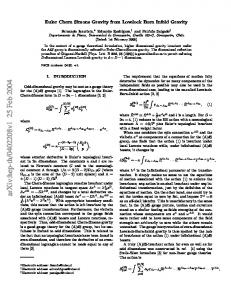
Fig. 10. An example of the misfit between measured and computed gravity fields for the profile Y = 62,500.
Each minor block is assigned an individual, constant density value. The optimization method is based on linearized inversion. In the present study the constrained Occam inversion method (Constable et al., 1987) is used, in which both the data misfit (difference between the measured data and the computed response) and the roughness of the model are minimized together. The neighboring parameter values are used as constraints. The Lagrange multiplier is used as a control parameter that defines if the data error is given more weight than the model error or vice versa. In our case study, the total gravity field data of 515 data points are used to create a synthetic model of 15,000 blocks in X, Y, and Z directions. The created blocks have an increasing height downward. The study area is divided into 50 × 50 block in X and Y directions, each block is 1 km2. The default values of the background density and Lagrange parameter are used as 2.67 g/cm3 and 1 consequently. Forward calculation is applied on the measured data to have the computed model, and then Occam inversion method is applied to optimize the density contrast model with a minimum RMS error (0.684510 E-1) between measured and calculated data (Fig. 10). The resulted density contrast model obtained after 8 iterations is shown in Fig. 11. 6. Results and conclusion The present study is an approach to recognize the major subsurface structural elements that is supposed to control the hydrogeological regime in El-Arish area. Principally, two major faults that extend roughly in the NE–SW direction are probably working as hydrogeologic connections between fresh Quaternary aquifer in the shallower part and salt Cretaceous aquifer in the deeper part. The NE–SW fault system is well defined using the horizontal derivative analysis in the direction perpendicular to the Gulf of Aqaba (N15°E) as shown in Fig. 7B. The same fault system is outlined by the 3D Euler deconvolution analysis using (SI) equal to zero (Fig. 9A). The findings of the 3D Euler deconvolution are not only the recognition of the spatial distribution of faults but also the estimation of the fault depth, which is about 3000 m in depth for the two regional NE–SW faults. Fig. 9A shows also some other minor deep and shallow faults distributed in the study area. The 3D density contrast model estimated by GRABLOX software (Pirttijarvi, 2008) shows a high gravity anomaly belt extending in the NE–SW direction in good agreement with the residual anomaly resulted
by 1st order least square separation (Fig. 8A). This zone of high density outlines the local high gravity anomaly of Risan Aniza anticline to the south of the El-Arish area. As shown in Fig. 11 the Risan Aniza high density zone is characterized by a large horizontal extension in the deeper part (− 3809 m) and gradually decrease upward in the shallower part that reflect the fold structural system. The high contrast in the northern and southern directions of the Risan Aniza fold zone increases the reliability of the regional NE–SW fault system. Fig. 12 shows a match between the total gravity anomaly filed along profile B–B′ (A), 2D density contrast model produced from the 3D gravity inversion (C), and the geological cross section B–B′ (B), which extend in the same direction. The figure shows a good match between the inferred faults in the geological cross section and the high contrast zone in the 2D density contrast model and abrupt decrease in the total gravity anomaly. References Aal, A.A., Lelek, J.J., 1994. Structural development of the northern Sinai, Egypt and its implication on the hydrocarbon prospectively of the Mesozoic. GEO 94, the Middle East Geosciences Conference, Bahrain, v. 1, p. 15.30. Abdelrahman, E.M., Radwan, A.H., Issawy, E.A., El-Araby, H.M., El-Araby, T.M., Abo-Ezz, E.R., 1999. Gravity interpretation of vertical faults using correlation factors between successive least-squares residual anomalies. Mining Pribram Symp. on Mathematical Methods in Geology MC2, pp. 1–6. Abu-Zeid, M., 1995. Major policies and programs for irrigation drainage and water resources development in Egypt. Options Mediterranean, Ser.B/No.9, — Egyptian Agriculture Profile 33–49. Agah, A., 1981. Structural map and plate reconstruction of the Gulf of Suez-Sinai area. International report, Conoco Oil Co, Houston, Texas, USA. Agocs, W.B., 1951. Least-squares residual anomaly determination. Geophysics 16, 686–696. Bartov, Y., Steinitz, G., Ayal, M., Ayal, Y., 1980. Sinistral movement along the Gulf of Aqaba: its age and relation to the opening of the Red Sea. Nature 285, 220–222. Beyth, M., 1981. Paleozoic vertical movement in Urn Bogma area, southern Sinai. Am. Assoc. Pet. Geol. Bull. 65, 160–165. Camacho, A.G., Montesinos, F.G., Vieira, R., 2000. Gravity inversion by means of growing bodies. Geophysics 65 (1), 95–101. Camacho, A.G., Montesinos, F.G., Vieira, R., 2002. A 3-D gravity inversion tool based on exploration of model possibilities. Comput. Geosci. 28, 191–204. Constable, S.C., Parker, R.L., Constable, C.G., 1987. Occam's inversion — a practical algorithm for generating smooth models from electromagnetic sounding data. Geophysics 52, 289–300. Courtillot, V., Armijo, R., Tapponnier, P., 1987. The Sinai triple junction revisited. Tectonophysics 141, 181–190. Dames, Moor, 1984. Sinai Development Study. Phase I. Water Resources, vols. II-a and II-b. Egyptian Geological Survey and Mining Authority 1993. Geological map of Sinai A.R.E., sheet No.4, scale 1:250.000. Evans, A.L., 1990. Miocene sandstone provenance relations in the Gulf of Suez: insights into synrift unroofing and uplift history. Am. Assoc. Pet. Geol. Bull. 74, 1386–1400.
112
M.A. Khalil et al. / Journal of Applied Geophysics 103 (2014) 104–113
Fig. 11. Density contrast model of the study area.
Eyal, M., Eyal, Y., Bartov, Y., Steinitz, G., 1981. The tectonic development of the western margin of the Gulf of Elat (Aqba) rift. Tectonophysics 80, 39–66. Gottsmann, J., Camacho, A.G., Martí, J., Wooller, L., Fernández, J., García, A., Rymer, H., 2008. Shallow structure beneath the Central Volcanic Complex of Tenerife from new gravity data: implications for its evolution and recent reactivation. Phys. Earth Planet. Inter. 168, 212–230. Harding, T.P., 1985. Seismic chrematistics and identification of negative flower structures, positive flower structures and positive structural inversion. Am. Assoc. Pet. Geol. Bull. 69, 458–600. JICA, 1992. North Sinai groundwater resources study in Arab Republic of Egypt. Final report. Khalil, M.A., 2002. Hydrogeological and Geophysical Investigation of the Groundwater Salinity Problem in Northern Sinai Peninsula. (PhD thesis) Justus Liebig Univ., Giessen, Germany. Khalil, M.A., Santos, F.A., 2013. 3 D gravity inversion of northern Sinai Peninsula, a case study. Pure Appl. Geophys. http://dx.doi.org/10.1007/s00024-013-0707-5.
Mohamed, H.M., 1994. Hydrogeological Conditions in El-Sheikh Zwayed and Rafah Area. (M.Sc thesis) Fac. Science, Assiut Univ.(111 pp.). Montesinos, F.G., Camacho, A.G., Nunes, J.C., Oliveira, C.S., Vieira, R., 2003. A 3-D gravity model for a volcanic crater in Terceira Island (Azores). Geophys. J. Int. 154, 393–406. Moustafa, A.R., Khalil, M.H., 1989. North Sinai structures and tectonic evolution. 25th Annual Meeting, Geological Society of Egypt, pp. 3–4. Neev, D., 1975. Tectonic evolution of the Middle East and Lavantine basin (Easternmost Mediterranean). Geology, v. 3, pp. 683–686. Neev, D., Friedman, G.M., 1978. Late Holocene tectonic activity along the margins of the Sinai sub-plate. Science 202, 427–429. Patricia, Represas, Monteiro Santos, F.A., Ribeiro, José, Ribeiro, Joana A., Almeida, Eugénio P., Gonçalves, Rui, Moreira, Mário, Mendes-Victor, L.A., 2013. Interpretation of gravity data to delineate structural features connected to low-temperature geothermal resources at northeastern Portugal. J. Appl. Geophys. 92, 30–38. Pirttijarvi, M., 2008. URL http://www.cc.oulu.fi/~mpi.
M.A. Khalil et al. / Journal of Applied Geophysics 103 (2014) 104–113
113
Fig. 12. Matching between the total gravity anomaly filed (A), density contrast model resulted from 3D inversion (C), and geological cross section B–B′ (B), extending in the same direction.
Reynolds, J.M., 1997. An Introduction to Applied and Environmental Geophysics. John Wiley and Sons, England 796. RIWR, 1989. Groundwater Management Study in El-Arish–Rafah Plain Area — Phase-I. Main Report, vol. 1. Said, R., 1990. Geology of Egypt. Balkema, Rotterdam, Netherlands (734 pp.). Schiavone, D., Loddo, M., 2007. 3-D density model of Mt. Etna Volcano (Southern Italy). J. Volcanol. Geotherm. Res. 164, 161–175. Shata, A., 1956. Structural development of the Sinai Peninsula, Egypt. 20th. Int. Geol. Congress. Mexico, pp. 225–249. Shata, A., 1959. Geological problems related to the groundwater supply of some desert areas of Egypt. Bull. Soc. Geography of Egypt, v.32. Egyptian Geographic Society, Cairo Egypt 248–262.
Smith, A.G., 1971. Alpine deformation and the oceanic areas of the Tethys, Mediterranean and Atlantic. Geol. Soc. Am. Bull. 82, 2039–2070. Standard Oil Company of Egypt 1952. Bouguer Anomaly Map of Sinai, Scale 1:250,000. Taha, A., 1968. Geology of the Groundwater Supplies of El-Arish–Rafah Area. M.Sc. Cairo Univ., Egypt. Telford, W.M., Geldart, L.P., Sheriff, R.E., 2001. Applied Geophysics. Cambridge University Press, New York 770. Thompson, D.T., 1982. EULDPH: a new technique for making computer-assisted depth estimates from magnetic data. Geophysics 47, 31–37. Zaghloul, Z., Khidr, I., 1992. Subsurface geological setting of the Mesozoic–Cenozoic formations and hydrocarbon potentials, north Sinai. 11th EGPC Exploration Seminar, Egypt, v. 1, pp. 563–577.