May 3, 2016 - The claim was rewarded in 13.6.2012 and expired in 13.6.2015 (Halkoaho .... This was done for each of the domains and elements separately.
GEOLOGIAN TUTKIMUSKESKUS Yksikkö Kuopio
3.05.2016
65/2015
3D modelling and mineral resource estimation of the Kiviniemi Scandium deposit, Eastern Finland Janne Hokka & Tapio Halkoaho
GEOLOGIAN TUTKIMUSKESKUS 3.05.2016
GEOLOGIAN TUTKIMUSKESKUS
KUVAILULEHTI Päivämäärä / Dnro
Tekijät Janne Hokka & Tapio Halkoaho
Raportin laji Mineraalivarantoarvioraportti Toimeksiantaja Geologian tutkimuskeskus
Raportin nimi Rautalammin Kiviniemen skandiumesiintymän 3D-mallinnus- ja resurssiarvioraportti Tiivistelmä Tutkimuskohde sijaitsee Itä-Suomen läänissä Rautalammin kunnassa Kiviniemen alueella, karttalehdellä 3224 08 sekä P4333 D2, D4, noin 70 km Kuopiosta lounaaseen. Kiviniemi on asumaton Niiniveteen pistävä, kivikkoinen niemi. Kiviniemen tutkimuskohteelle tehtiin vuosina 2008, 2009 ja 2010 (8.12.2008-16.1.2009 ja 3.5.-3.6.2010) GTK:n toimesta yhdeksän (9) POKA-kairausreikää, yhteispituudeltaan 1251,80 metriä. Rautalammin Kiviniemen ferrodioriitti-intruusio koostuu osista, jotka voidaan erottaa toisistaan raekoon perusteella. Karkearakeisin, rauta- ja skandiumrikkain granaattipitoinen ferrodioriitti sisältää fayaliittia ja se sijaitsee niemen pohjoisosassa dioriittisen yksikön ympäröimänä. Sen reunoilla esiintyy paikoitellen osueina vaaleamman sävyistä leukoferrodioriittia. Käytettävissä olevan tietojen vähäisyys heikentää arvion luotettavuutta. Pääesiintymän homogeenisuus ja säännöllinen muoto kuitenkin auttavat arvion tekemisessä. Lisäksi merkittävä pudotus malmitonneissa tapahtuu vasta välillä 100-150 g/t Sc. Alustavan arvion mukaan Kiviniemen intruusio sisältää 13,4 miljoonaa tonnia kiveä, jonka keskipitoisuus on 162.7 g/t skandiumia, 1726.2 g/t zirkoniumia ja 81 g/t yttriumia. Tässä tuloksessa on käytetty 40 g/t scandiumin cut off- arvoa. Ilman cut off arvoa intruusion kokonaisresurssi on 14.3 miljoonaa tonnia kiveä skandiumin keskipitoisuuden ollessa 154.3 g/t.
Asiasanat (kohde, menetelmät jne.) Rautalampi, Kiviniemi, 3D-malli, resurssiarvio, fayaliitti ferrodioriitti Maantieteellinen alue (maa, lääni, kunta, kylä, esiintymä) Suomi, Itä-Suomen lääni, Rautalampi, Niinivesi, Kiviniemi Karttalehdet 3224 08 (KKJ) ja P433 (UTM) Muut tiedot
Arkistosarjan nimi Mineraalivarantoarvioraportti Kokonaissivumäärä 16 + 5 liitettä
Arkistotunnus 65/2015 Kieli Englanti
Hinta
Yksikkö ja vastuualue Itä-Suomen yksikkö, 401
Hanketunnus 2551014
Allekirjoitus/nimen selvennys
Allekirjoitus/nimen selvennys
Janne Hokka
Tapio Halkoaho
Julkisuus julkinen
GEOLOGIAN TUTKIMUSKESKUS 3.05.2016
GEOLOGICAL SURVEY OF FINLAND
DOCUMENTATION PAGE Date / Rec. no.
Authors Janne Hokka & Tapio Halkoaho
Type of report Mineral resource estimation report Commissioned by Geological Survey of Finland
Title of report 3D modelling and mineral resource estimation of the Kiviniemi scandium deposit, Eastern Finland Abstract The study area of Kiviniemi is located at the municipality of Rautalampi, Eastern Finland Province, about 70 km from the city of Kuopio. The base map sheets are 3224 08 (KKJ) and P4333D (EUREF). During 2008-2010 (8.12.2008-16.1.2009 and 3.5.-3.6.2010) total of 9 drillholes (1251.80 m) were conducted to the Kiviniemi prospect by GTK. The ferrodioritic intrusion of Kiviniemi consists of two parts that can be separated by its grain size. The iron and scandium rich coarsegrained unit of garnet-bearing ferrodiorite situates at the north end of the cape of Kiviniemi surrounded by diorites. Leucoferrodiorite parts are exposed at the contact boundaries. The resource classification is conservative due to the inadequate exploration drilling and should be treated as low certainty. Although, scandium, yttrium and zirconium are following the large homogeneous ferrodioritic unit with an even grade distribution. A dramatic tonnage drop appears not before getting towards 100-150 g/t Sc cut off values. The resource estimation calculated for Kiviniemi intrusion by using 40 g/t Sc cut off value is 13.4 Mt of rock with an average grade of 162.7 g/t scandium, 1726 g/t zirconium and 81 g/t yttrium. The total estimation is 14.3 Mt with an average scandium grade of 154.3 g/t, when no cut off values are applied. Keywords Rautalampi, Kiviniemi, 3D model, mineral resource estimation, fayalite ferrodiorite Geographical area Finland, Province of Eastern Finland, Rautalampi, Niinivesi, Kiviniemi Map sheet 3224 08 (KKJ) ja P433 (UTM) Other information
Report serial Mineral resource estimation report Total pages 16 + 5 appendices
Archive code 65/2015 Language English
Price
Unit and section Eastern Finland Office, 401
Project code 2551014
Signature/name
Signature/name
Janne Hokka
Tapio Halkoaho
Confidentiality Public
GEOLOGIAN TUTKIMUSKESKUS 3.05.2016
TABLE OF CONTENTS 1
2
INTRODUCTION
1
1.1
Exploration history
2
1.2
Drillings and analyses
3
1.3
Geological setting
3
3D MODELLING AND MINERAL RESOURCE ASSESSMENT
5
2.1
Data Collection
5
2.2
Topography
5
2.3
Compositing data and statistical analysis
6
2.4
Domaining
7
2.5
Inverse distance estimation
2.5.1
10
Background/Block Model
10
3
DISCUSSION
15
4
CONCLUSION
15
5
REFERENCES
15
6
APPENDIX
16
GEOLOGIAN TUTKIMUSKESKUS
1 3.05.2016
1
INTRODUCTION
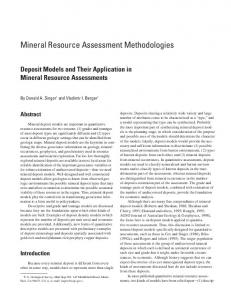
Kiviniemi intrusion is located at the municipality of Rautalampi, Province of Eastern Finland (Figure 1), about 70 km SW from the city of Kuopio and about 350 km NNE of Helsinki. The KKJ base map sheet is 3224 08 and KKJ Zone 3 coordinates are 6967905 (X) and 3485045 (Y), corresponding to the EUREF-FIN geographic coordinates of Latitude 62° 48.886' oN, Longitude 26° 42.202' oE. The UTM map sheet is P4333D.
Figure 1. Location of Kiviniemi claim property
The Kiviniemi property was covered by a claim (Exploration Licence: Kiviniemi 1) with an area of 24.6 hectares. The claim was rewarded in 13.6.2012 and expired in 13.6.2015 (Halkoaho & Niskanen 2015). The land and surface rights of the Kiviniemi claim area are currently on hold (waiting period). Kiviniemi property is accessed by 3 – 4 km of gravel road diverging from sealed road 545. The closest village is Rautalampi which is about 30 km south from the claim (road 543-545). Kiviniemi is situated in a cape of lake Niinivesi (Figure 1). The Kiviniemi intrusion is approximately 25 hectares in size and
GEOLOGIAN TUTKIMUSKESKUS
2 3.05.2016
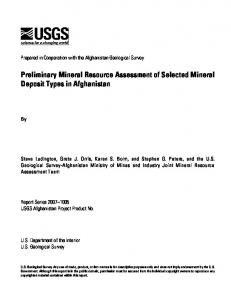
the highest topographical feature is Kiviniemenvuori, fairly gentle dipping hill that situates at the northern margin of the intrusion. 1.1 Exploration history The magnetic airborne survey was done in 1986 by GTK and in 2008 GTK commenced in the Kiviniemi area the geophysical ground surveys together with the detail bedrock mapping. The focus was to detect the source for previously found Layman’s samples that contained some of nickel and copper. GTK commenced two diamond drilling programs in the Kiviniemi property during 2008 – 2009 and 2010, in total 1251.8 meters. There are several outcrop exposures which have resulted close to 50 bedrock observations in the area. In addition, eight whole rock analyses (XRF) have been made from outcrops of the Kiviniemi intrusion (Figure 2). Bedrock map interpretation from Kiviniemi area (Figure 2) is rather detailed and has been used in enveloping the intrusion.
Figure 2. Bedrock map of the Kiviniemi intrusion. The smaller ferrodiorite intrusion body (NNE) is interpreted by using geophysical and outcrop observation data. The Kiviniemi Sc-deposit is confined to fayalite ferrodiorite (the darkest brown).
GEOLOGIAN TUTKIMUSKESKUS
3 3.05.2016
1.2 Drillings and analyses GTK commenced the first diamond drilling program during 2008 – 2009 which included four drill holes (R331-R334) and a total of 346.50 meters. Second diamond drilling program was commenced in 2010 which included five drill holes (R1-R5) and a total of 905.30 meters covering the northern and southern parts of the intrusion. The average length of drill holes were 139 meters and the maximum vertical extension was to 167 meters. The diamond drill core size used was 46 mm (T56 bit). The distance between the drilling profiles varied from 50 – 200 meters. All drill holes were measured afterwards with GPRS device (< 1 m). No down-hole survey was done from drill holes. Drill holes P433_2010_R1, P433_2010_R2, P433_2010_R3, and P433_2010_R4 was used in grade estimation study (Appendix 1.1.). No assay data was available from drill hole 3224_2008_R331 and it was excluded from domain model. However, lithological data was used in global model to envelope intrusion boundaries. All drill holes were logged and photographed at GTK’s core logging facility. The core was sampled as half core and the average sample length was 1.3 meters. The core was systematically analysed at Labtium Oy. Various methods were tested to get the optimal results: X-ray fluorescence (XRF) (method code 175X), ICP-MS (method code 308M) and fusion with sodium peroxide (method code 724P). The most reliable results were obtained with sodium peroxide. GTK metallurgical research laboratory at Outokumpu carried out a primary metallurgical test work from Kiviniemi in 2010 (drill core samples R331-R332 and surface samples). Scandium occurs mainly in the internal structure of iron-rich silicates, such as amphibole (40 %) and pyroxene (59 %), which needs to be enriched and leached with a particular method. In primary testing the most potential separation method of scandium was magnetic separation with ~346 ppm of Sc concentrate with ~72 % of recovery. Acid solution of hydrogen fluoride and hydrochloric/sulphuric acid dissolves scandium at best results. Neither the quantity of acid or recovery of scandium from acid solution has been studied. Some problems may be encountered in leaching due to large quantities of masses and acids needed to be processed in further processing (Korhonen et al. 2010). The wet chemistry study group in the University of Eastern Finland have been continuing the testing of scandium recovery from acidic solutions with a patented metal chelator method (Ahven 2016). 1.3 Geological setting Kiviniemi intrusion is located in the northeastern part of the Central Finland Granitoid Complex, near the arc-type rocks of the Savo Belt. The composition of intrusion is mafic and it’s surrounded by porphyritic granite. Kiviniemi intrusion was formed in the post-tectonic stage of Svecofennian orogeny (1880 – 1860 Ma). The U-Pb date of garnet-bearing fayalite ferrodiorite is 1857±2 Ma and the age of surrounding porphyritic granite is 1859±9 Ma (Ahven 2012). The Kiviniemi intrusion consists of five rock types: coarse-grained (garnet-bearing) fayalite ferrodiorite, leucoferrodiorite, medium- and fine-grained ferrodiorite, diorite and granite. The main host rock for enriched scandium, yttrium and zirconium is the coarse-grained fayalite ferrodiorite. The surface extension of the main Sc-mineralized block is around 2.5 hectares and it’s extending the vertical depth down to at least 167 meters (Figure 3). The Kiviniemi Sc-deposit is subdivided into two
GEOLOGIAN TUTKIMUSKESKUS
4 3.05.2016
ferrodioritic intrusion blocks. The smaller block is situated approximately 100 meters NE of the main block, but there is no surface outcrops (Figure 2). Geometrically blocks are rather homogeneous, deeply dipping packages. Table 1. Drill holes in Kiviniemi property. Hole-ID
Year
Company
X
Y
X (Euref)
Y (Euref)
Z
Azimuth
Dip
Length
3224_2008_R331
2008
GTK
3485045
6967905
6964985
484880
110
45
-45
102.1
3224_2008_R332
2008
GTK
3484993
6967860
6964940
484828
104
45
-45
93.8
3224_2008_R333
2008
GTK
3485356
6967416
6964497
485191
113
360
-45
60.3
3224_2009_R334
2009
GTK
3485450
6967820
6964900
485285
103
90
-45
90.3
P433_2010_R1
2010
GTK
3484980
6967900
6964980
484815
105
45
-45
253.2
P433_2010_R2
2010
GTK
3485085
6967850
6964930
484920
109
45
-45
254.5
P433_2010_R3
2010
GTK
3485120
6968040
6965120
484955
99
225
-45
173.6
P433_2010_R4
2010
GTK
3485150
6967975
6965055
484985
108
45
-45
131.5
P433_2010_R5
2010
GTK
3485375
6967875
6964955
485210
108
225
-45
92.5
total
1251.8
Figure 3. Fayalite ferrodiorite part of the Kiviniemi intrusion. The dimensions are approximately 200 x 150 x 167 meters. Digital Elevation Model (DEM) shows the topography of Kiviniemi area. Magnetic map is draped over the elevation model surface. Drill holes (green) shows grade distribution of scandium and yttrium in the deposit.
GEOLOGIAN TUTKIMUSKESKUS
5 3.05.2016
2
3D MODELLING AND MINERAL RESOURCE ASSESSMENT
2.1 Data Collection Data is stored in Microsoft access database. Database was updated and checked to ensure no major discrepancies existed in the data, and used for grade estimation study. Database comprises a total of nine drill holes which is stored in collar and survey data along with lithology, assay, and susceptibility data in own tables. 2.2 Topography The work consisted of creating 3D digital elevation model (DEM) covering the Kiviniemi intrusion. The National Land Survey of Finland’s (NLS) Airborne Laser scanning data were used as primary data source (Figure 4).
Figure 4. DEM-model from Kiviniemi area. Bedrock and magnetic maps draped over the elevation model. The brown coloured solid represent the intrusion boundaries. Slight vertical exaggeration is used to emphasize the changes in topography.
GEOLOGIAN TUTKIMUSKESKUS
6 3.05.2016
2.3 Compositing data and statistical analysis A total of 443 samples were analysed (fusion with sodium peroxide, Labtium Oy method code 724P) from five drill holes (P433_2010_R1- P433_2010_R5, see Appendix 1.1.). The mean sample length was 1.3 meters (Figure 5) and assay data was composited to the nearest half meter. The compositing process was controlled using domain boundaries, restarting at each change in domain.
Histogram for Length Number of samples
300 250 200 150 100 50 0 sample_length
0.5
1
1.5
2
2.5
3
4
145
257
31
4
1
Figure 5. Histogram shows the average sample length and propotion of assay data. The drill hole assays were composited to 1.5 meters in GEOVIA Surpac mining software.
Validation checks were done on composites to ensure that metal was not lost in transition. The sample data was checked before and after compositing to ensure that the total length was equal and no metal had been affected. The mean grade in the sample data was compared against the mean grade in the model (Table 2). This was done for each of the domains and elements separately. Domain 201 shows a -10 % difference to the mean of composite data. Acceptable limit can be kept around (10 % difference). No topcut or declustering was applied. A total of 374 one and a half meter composite samples are in the Kiviniemi. Statistical investigation was done to understand the data behaviour. The composited scandium data shows bimodal distribution with at least two distinctive grade populations (Figure 6).
GEOLOGIAN TUTKIMUSKESKUS
7 3.05.2016
Figure 6. Histogram of scandium (ppm) shows a bimodal distribution which is an indication of mixed populations.
2.4 Domaining The geological characteristics used to define the estimation domains at Kiviniemi included lithological control and scandium grade. Interpreted strings were linked together to create 3D solids (wireframes) and modified if necessary to create realistic geological shapes. The three-dimension domain solids were constructed using GEOVIA Surpac mining software. The criteria for the domains are: 1. Global domain consists of an interpretation of the total volume of the deposit. Solid was modelled to envelope the deposit boundaries from available surface mapping and drill hole data. All the individual domains were included in this model. 2.
Individual Domains consist (Figure 7) of three domains (codes: 101, 201, 301) and three subdomains (codes: 102, 103, 202). Lenses were modelled as cross-sections using lithology and scandium grade to distinguish the main populations and classifying them into high grade, low grade and medium grade domains. High grade and low grade domains included several lenses which were subdivided into sub-domains.
GEOLOGIAN TUTKIMUSKESKUS
8 3.05.2016
Figure 7. Scandium grade population in each domain (Table 2). The main domain 101 (top left) shows negatively skewed ( -0.515) normal distributed grade population.
GEOLOGIAN TUTKIMUSKESKUS
9 3.05.2016
Table 2. Statistical comparison of scandium, yttrium and zirconium in all domains. The Coefficient of Variation (CV) is generally low which indicates no need for topcut. Table also shows the grade variation of global domain and individual domains for each element. Sc
Samples
Minimum
Maximum
Mean
CV
Model difference
Global model difference
all
373
0
291.24
142.15
0.29
4.83
14.37
domain 101
221
28.66
291.24
169.65
0.26
0.91
domain 102
38
44.44
245.33
158.09
0.31
0.80
domain 103
9
152.27
241.64
195.93
0.16
-0.22
domain 201
36
33.02
125.75
76.86
0.39
-10.48
domain 202
35
0
68.99
44.78
0.30
1.60
domain 301
34
41.43
171.25
100.65
0.31
3.97
Y
Samples
Minimum
Maximum
Mean
CV
Model difference
Global model difference
all
373
0
231.43
84.15
0.21
-1.66
-5.71
domain 101
221
44.47
168.00
81.52
0.21
-3.72
domain 102
38
58.33
96.76
82.39
0.12
-1.42
domain 103
9
64.57
77.00
71.54
0.06
0.11
domain 201
36
89.15
154.39
103.02
0.13
1.58
domain 202
35
0
144.54
70.57
0.35
1.42
domain 301
34
51.47
231.43
100.51
0.29
2.78
Zr
Samples
Minimum
Maximum
Mean
CV
Model difference
Global model difference
all
373
3.05
5683.20
1743.80
0.58
0.11
-2.55
domain 101
221
290.17
5683.20
1675.76
0.70
3.18
domain 102
38
1143.40
4874.92
2765.31
0.44
5.65
domain 103
9
1110.32
5658.07
3065.36
0.42
-0.64
domain 201
36
592.09
3186.22
1833.19
0.33
-4.43
domain 202
35
3.05
3478.80
1451.50
0.42
3.41
domain 301
34
359.11
1720.66
900.76
0.37
3.03
Multi-variate data analysis was done to provide a quick assessment of whether there were obvious relationships between the elements and whether these realationships are positive or negative. Absolute correlation coefficient greater that 0.6 is kept as signal of a strong correlation (Table 3).
GEOLOGIAN TUTKIMUSKESKUS
10 3.05.2016
Table 3. Multi-variate analysis shows strong correlation with scandium and zirconium in most of the domains (red). Scandium also correlates well with yttrium in domain 202 (blue). domain
Sc
Y
Zr
domain
101
Sc
Y
Zr
102 Sc
1
0.0711
0.515
Sc
1
0.4416
0.6512
Y
0.0711
1
0.3158
Y
0.4416
1
0.2091
Zr
0.515
0.3158
1
Zr
0.6512
0.2091
1
1
-0.4135
0.6358
103
201 Sc
1
0.3102
0.6818
Sc Y
-0.4135
1
-0.3723
Zr
0.6358
-0.3723
1
1
0.2377
0.1413
Y
0.3102
1
-0.0402
Zr
0.6818
-0.0402
1
202
301 Sc
1
0.8298
0.6933
Sc
Y
0.8298
1
0.7398
Y
0.2377
1
0.0076
Zr
0.6933
0.7398
1
Zr
0.1413
0.0076
1
2.5 Inverse distance estimation 2.5.1
Background/Block Model
A block model was built using Gemocom Surpac softaware. The volume model (describing the geometry of domains) was based on 20 meters (X) x 20 meters (Y) x 20 meters (Z) sized parent cells, and was sub-celled to 5 meters (X) x 5 meters (Y) x 5 meters (Z) blocks at the domain boundaries (Table 4 and Figure 8). The parental cell size was chosen to represent half the drill spacing.
Table 4. Kiviniemi Block Model Parameters BLOCK MODEL PARAMETERS
Y
X
Z
Minimum Coordinates
6967855
3484950
-100
Maximum Coordinates
6968075
3485290
160
User Block Size
20
20
20
Min. Block Size
5
5
5
0
0
0
Rotation Total Blocks
25965
Storage Efficiency %
83.31
GEOLOGIAN TUTKIMUSKESKUS
11 3.05.2016
The empty block model was coded using the main geological features. Blocks above topography DTM were flagged as air and blocks inside the deposit were flagged as mineralised rock and outside the deposit boundary flagged as barren rock (footwall and hangingwall rocks). Each domain was coded using the solid wireframes. Only eleven gravity measurements were taken from drill holes. The average gravity of three samples taken from fayalite ferrodiorite 3.16 g/cm 3 were assigned to all mineralised rocks and used in resource estimation. Several commonly used validation checks were performed to ensure the quality of the model. Checks included volumes, composites and metal, sample data versus model data comparison and visual checks (Appendices 1.2 and 1.4.).
Figure 8. Block model of Kiviniemi deposits (global domain). Colour coding represents the scandium grade. Inverse distance method was used to interpolate the average grades for each block (see Appendices 1.3. and 1.5.). Drill core assays were weighted using inverse of the square of a distance (ID2). Due to the sparse drilling, grade continuity of deposit resulted poor variograms. The trend of deposit is considered to be roughly in SE direction and dipping around -60 degrees (Table 5).
GEOLOGIAN TUTKIMUSKESKUS
12 3.05.2016
Table 5. Kiviniemi Search Parameters SEARCH PARAMETERS Surpac
ZXY
First axis
105
Second axis
0
Third axis
-59.6
ANISOTROPY FACTORS Semi_major axis
2
Minor axis
1
OTHER INTERPOLATION PARAMETERS Max search distance of major axis
200
Max vertical search distance
200
Maximum number of samples
15
Minimum number of samples
3
Table 6. Table showing volumes, tonnages and grades for individual domains. Global domain is only an indication of exploration potential and should be treated as very low certainty. Kiviniemi Scandium deposit Indivividual Domains
volume
Method: Inverse distance tonnage
Sc_ppm
Y_ppm
Zr_ppm
domain 101
865500
2734980
171.279
78.602
1732.973
domain 102
53500
169060
159.345
81.228
2921.466
domain 103
5875
18565
195.51
71.614
3045.803
domain 201
159375
503625
68.806
104.641
1751.99
domain 202
52375
165505
45.498
71.57
1500.932
domain 301
51750
163530
104.653
103.302
928.076
1188375
3755265
148.67
82.94
1750.24
Total Global Domain intrusion
volume 4531750
tonnage 14320330
Sc_ppm 154.312
Y_ppm 78.488
Zr_ppm 1679.783
GEOLOGIAN TUTKIMUSKESKUS
13 3.05.2016
Table 7. Table showing inferred resources and their main grades with different cut off values. Global domain is only an indication of exploration potential, not categorised as inferred resource, and should be treated as very low certainty. Individual Domains cut off (Sc ppm)
Tonnage
Sc
Y
Zr
0
3.7
149.1
82.8
1748.6
20
3.7
149.1
82.8
1748.6
40
3.7
150.1
83.0
1751.3
60
3.3
163.4
81.1
1791.4
80
3.2
164.8
80.7
1790.8
100
3.2
166.1
80.3
1787.5
150
2.1
182.9
78.7
2099.3
cut off (Sc ppm)
Tonnage
Sc
Y
Zr
0
14.3
154.3
78.5
1679.8
20
14.1
157.3
80.0
1711.8
40
13.4
162.8
81.0
1726.2
60
12.6
170.1
80.5
1745.0
80
12.6
170.5
80.4
1744.7
100
12.5
170.9
80.3
1743.6
150
11.1
175.3
80.2
1830.3
Global Domain
GEOLOGIAN TUTKIMUSKESKUS
14 3.05.2016
Figure 9. Mineral resource curves by block modelling as function of cut off grade. A dramatic tonnage drop appears not before getting towards 100-150 g/t Sc cut off values.
GEOLOGIAN TUTKIMUSKESKUS
15 3.05.2016
3
DISCUSSION
There are 1-5 drill hole intersections at the modelled sections and the distance between each section is 30-200 meters. Due to the scattered sample grid the resource classification is categorised as ore potential category rather than considering it as inferred resource estimate. Although, the scandium seems to have a fairly good continuity, more drilling and sampling is required to obtain more accurate resource assessment. Nevertheless, the dramatic tonnage drop appears not before getting towards 100150 g/t Sc cut off values (Figure 9, Tables 6 and 7). The dimensions of the two Kiviniemi intrusions are still only been partly explored. The main intrusion is open in all directions and same applies to the smaller intrusion. The global domain model estimation gives a good scale of size of the intrusion and its vast potential. Scandium grade is fairly homogeneous and increases the confidence on estimation the global resources. Further exploration drilling is needed to increase the confidence on resource estimation. The infill drilling should be targeted between the drill hole profiles so that at least 50 m spacing is achieved. This would require approximately 500-700 meters of diamond drilling.
4
CONCLUSION
The assessment and related investigations are following the international standards. The resource classification is conservative due to the inadequate exploration drilling and should be treated as low certainty. Although, scandium, yttrium and zirconium are following the large homogeneous ferrodioritic unit with an even grade distribution, only few additional drill holes would improve the estimation substantially. The global domain should not be considered as resource category, rather an exploration potential measurement. The resource estimation calculated for Kiviniemi intrusion by using 40 g/t Sc cut off value is 13.4 Mt of rock with an average grade of 162.7 g/t scandium, 1726 g/t zirconium and 81 g/t yttrium. The total estimation is 14.3 Mt with an average scandium grade of 154.3 g/t, when no cut off values are applied.
5
REFERENCES
Ahven, M. 2016. Scandium deposits and potential in Finland. In: Staboulis, S. et al. (eds) Abstracts of the 32nd Nordic Geological Winter Meeting, 13.-15.1.2016, Helsinki, Finland. Bulletin of the Geological Society of Finland, Special Volume, p.111. Ahven, M. 2012. Petrology and geochronology of the Kiviniemi garnet-bearing fayalte ferrogabbro, Rautalampi. Master’s Thesis, University of Helsinki, Department of Geosciences and Geography, pp. 62.
GEOLOGIAN TUTKIMUSKESKUS
16 3.05.2016
Halkoaho, T. & Niskanen, M. 2015. Tutkimustyöselostus Rautalammin kunnassa valtausalueella Kiviniemi 1 (kaivosrekisterinumero 8777/1) suoritetuista skandium- ja zirkoniumesiintymätutkimuksista vuosina 2008-2010. Geologian Tutkimuskeskus, Itä-Suomen Yksikkö, Valtausraportti 56/2015, s. 32. Korhonen, T., Neitola, R., Mörsky, P. & Laukkanen, J. 2010. Alustavia skandiumin rikastustutkimuksia Rautalammin Kiviniemen näytteellä. Geologian Tutkimuskeskus, Itä-Suomen Yksikkö, Tutkimusraportti C/MT/2010/56, s. 35.
6
APPENDIX
Appendix 1.1. Drill hole assay data of Kiviniemi Appendix 1.2. Cross-section of domain boundaries Appendix 1.3. The solid model of Kivinemi intrusion Appendix 1.4. Visual validation of individual domains Appendix 1.5. Blockmodel of Kiviniemi intrusion with different cut off grade
3D modelling and resource estimation of the Kiviniemi Scandium deposit, Eastern Finland. 65/2015, Hokka, J & Halkoaho, T.
APPENDIX 1.1. DRILL HOLE ASSAY DATA OF KIVINIEMI HOLE-ID P433_2010_R1 P433_2010_R1 P433_2010_R1 P433_2010_R1 P433_2010_R1 P433_2010_R1 P433_2010_R1 P433_2010_R1 P433_2010_R1 P433_2010_R1 P433_2010_R1 P433_2010_R1 P433_2010_R1 P433_2010_R1 P433_2010_R1 P433_2010_R1 P433_2010_R1 P433_2010_R1 P433_2010_R1 P433_2010_R1 P433_2010_R1 P433_2010_R1 P433_2010_R1 P433_2010_R1 P433_2010_R1 P433_2010_R1 P433_2010_R1 P433_2010_R1 P433_2010_R1 P433_2010_R1 P433_2010_R1 P433_2010_R1 P433_2010_R1 P433_2010_R1 P433_2010_R1 P433_2010_R1 P433_2010_R1 P433_2010_R1 P433_2010_R1 P433_2010_R1 P433_2010_R1 P433_2010_R1 P433_2010_R1 P433_2010_R1 P433_2010_R1 P433_2010_R1 P433_2010_R1 P433_2010_R1 P433_2010_R1
From m 28.3 29.8 30.8 31.8 33 34 35 36 37 38 39 40 41 42 43 44 45 46 47 48 49 50 51 52 53 54 55 56 57 57.9 59 60 61 62 63 64 65 66 67 68 69 70 71 72 73 74 75.3 75.6 77.1
To m 29.8 30.8 31.8 33 34 35 36 37 38 39 40 41 42 43 44 45 46 47 48 49 50 51 52 53 54 55 56 57 57.9 59 60 61 62 63 64 65 66 67 68 69 70 71 72 73 74 75.3 75.6 77.1 78
Length m 1.5 1 1 1.2 1 1 1 1 1 1 1 1 1 1 1 1 1 1 1 1 1 1 1 1 1 1 1 1 0.9 1.1 1 1 1 1 1 1 1 1 1 1 1 1 1 1 1 1.3 0.3 1.5 0.9
sc_ppm 59 72 73 131 133 175 146 168 153 167 135 144 134 131 123 141 164 171 148 181 166 149 158 179 168 156 186 204 208 214 174 163 175 186 184 171 207 210 185 222 190 192 191 221 187 181 27 167 187
y_ppm 99 114 113 84 114 175 136 111 93 96 109 93 89 86 84 95 93 97 84 103 96 86 92 102 99 86 93 103 120 105 89 86 90 96 93 94 99 96 76 94 78 78 92 114 85 79 66 71 75
zr_ppm 1090 1220 861 299 856 846 892 693 492 461 605 667 528 445 496 783 652 670 682 772 486 1080 1150 1130 1380 1370 1230 1120 723 2200 2810 2790 2690 3240 3000 2840 3740 3400 2010 1780 2060 2180 2820 3070 2160 2430 365 2210 2420
Appendix 1.1
3D modelling and resource estimation of the Kiviniemi Scandium deposit, Eastern Finland. 65/2015, Hokka, J & Halkoaho, T.
HOLE-ID P433_2010_R1 P433_2010_R1 P433_2010_R1 P433_2010_R1 P433_2010_R1 P433_2010_R1 P433_2010_R1 P433_2010_R1 P433_2010_R1 P433_2010_R1 P433_2010_R1 P433_2010_R1 P433_2010_R1 P433_2010_R1 P433_2010_R1 P433_2010_R1 P433_2010_R1 P433_2010_R1 P433_2010_R1 P433_2010_R1 P433_2010_R1 P433_2010_R1 P433_2010_R1 P433_2010_R1 P433_2010_R1 P433_2010_R1 P433_2010_R1 P433_2010_R1 P433_2010_R1 P433_2010_R1 P433_2010_R1 P433_2010_R1 P433_2010_R1 P433_2010_R1 P433_2010_R1 P433_2010_R1 P433_2010_R1 P433_2010_R1 P433_2010_R1 P433_2010_R1 P433_2010_R1 P433_2010_R1 P433_2010_R1 P433_2010_R1 P433_2010_R1 P433_2010_R1 P433_2010_R1 P433_2010_R1 P433_2010_R1
From m 78 79 80 81 82 83 84 85 86 87 88 89 90 91 92.5 95.5 96.5 97.7 98.1 99.4 100.4 101.4 102.4 103.4 105.4 106.6 108.1 109.9 111.1 112.3 113.5 114.7 115.7 116.7 117.7 119.1 120 121 122 123 124 125 126 127 128 129 130 131 132
To m 79 80 81 82 83 84 85 86 87 88 89 90 91 92.5 95.5 96.5 97.7 98.1 99.4 100.4 101.4 102.4 103.4 105.4 106.6 108.1 109.9 111.1 112.3 113.5 114.7 115.7 116.7 117.7 119.1 120 121 122 123 124 125 126 127 128 129 130 131 132 133
Length m 1 1 1 1 1 1 1 1 1 1 1 1 1 1.5 3 1 1.2 0.4 1.3 1 1 1 1 2 1.2 1.5 1.8 1.2 1.2 1.2 1.2 1 1 1 1.4 0.9 1 1 1 1 1 1 1 1 1 1 1 1 1
sc_ppm 247 246 242 183 201 215 210 216 183 227 183 174 190 185 149 173 109 0 193 175 132 175 173 22 129 163 27 185 195 183 204 247 205 177 29 171 197 165 196 196 176 178 187 149 171 194 179 185 200
y_ppm 86 90 94 83 101 83 79 92 80 80 72 85 81 78 64 64 50 23 74 75 70 74 70 61 70 75 110 76 61 60 107 120 68 65 106 66 71 59 59 66 56 56 58 54 68 66 58 61 59
zr_ppm 3370 3970 3760 2070 3250 2240 1230 2240 2490 1920 2300 2170 2520 2180 1660 1390 1200 177 1230 1400 1930 2050 2030 565 1260 1470 1200 1340 1350 1500 2700 3100 1960 1850 575 1910 722 595 616 1110 736 558 697 628 1190 1540 670 697 1540
Appendix 1.1
3D modelling and resource estimation of the Kiviniemi Scandium deposit, Eastern Finland. 65/2015, Hokka, J & Halkoaho, T.
HOLE-ID P433_2010_R1 P433_2010_R1 P433_2010_R1 P433_2010_R1 P433_2010_R1 P433_2010_R1 P433_2010_R1 P433_2010_R1 P433_2010_R1 P433_2010_R1 P433_2010_R1 P433_2010_R1 P433_2010_R1 P433_2010_R1 P433_2010_R1 P433_2010_R1 P433_2010_R1 P433_2010_R1 P433_2010_R1 P433_2010_R1 P433_2010_R1 P433_2010_R1 P433_2010_R1 P433_2010_R1 P433_2010_R1 P433_2010_R1 P433_2010_R1 P433_2010_R1 P433_2010_R1 P433_2010_R1 P433_2010_R1 P433_2010_R1 P433_2010_R1 P433_2010_R1 P433_2010_R1 P433_2010_R1 P433_2010_R1 P433_2010_R1 P433_2010_R1 P433_2010_R1 P433_2010_R1 P433_2010_R1 P433_2010_R1 P433_2010_R1 P433_2010_R1 P433_2010_R1 P433_2010_R1 P433_2010_R1 P433_2010_R1
From m 133 134 135 136 137 138 139 140 141 142 143.5 145.7 147 148.3 149.4 150.5 151.6 152.8 154 155 156 157 158 159 160 161 162 163 164 165 166 167 168 169 170 171 172.2 173.7 175.2 176.7 178.2 179.7 181.2 182.7 184.2 185.8 186.8 187.8 188.8
To m 134 135 136 137 138 139 140 141 142 143.5 145.7 147 148.3 149.4 150.5 151.6 152.8 154 155 156 157 158 159 160 161 162 163 164 165 166 167 168 169 170 171 172.2 173.7 175.2 176.7 178.2 179.7 181.2 182.7 184.2 185.8 186.8 187.8 188.8 189.7
Length m 1 1 1 1 1 1 1 1 1 1.5 2.2 1.3 1.3 1.1 1.1 1.1 1.2 1.2 1 1 1 1 1 1 1 1 1 1 1 1 1 1 1 1 1 1.2 1.5 1.5 1.5 1.5 1.5 1.5 1.5 1.5 1.6 1 1 1 0.9
sc_ppm 187 181 195 188 204 191 208 211 197 200 21 244 231 293 291 277 258 226 233 247 231 237 233 229 229 217 204 169 185 203 196 169 178 217 208 171 74 80 73 91 71 105 74 75 82 165 158 175 135
y_ppm 72 66 65 63 64 58 57 71 65 62 62 75 71 88 90 99 97 89 91 98 97 96 97 97 99 92 84 74 101 79 83 106 73 93 89 84 119 105 103 94 105 103 110 111 111 79 76 81 69
zr_ppm 1790 1910 1130 1660 2150 1870 1310 1800 1200 1940 263 1350 3450 985 1270 1020 1860 2730 2970 3870 3170 3970 4900 5320 4290 4760 2200 3240 1570 2440 1480 1600 1310 1500 1120 1750 978 1010 899 1040 1050 1020 851 997 903 2220 1350 1770 1660
Appendix 1.1
3D modelling and resource estimation of the Kiviniemi Scandium deposit, Eastern Finland. 65/2015, Hokka, J & Halkoaho, T.
HOLE-ID P433_2010_R1 P433_2010_R1 P433_2010_R1 P433_2010_R1 P433_2010_R1 P433_2010_R1 P433_2010_R1 P433_2010_R1 P433_2010_R1 P433_2010_R1 P433_2010_R1 P433_2010_R1 P433_2010_R1 P433_2010_R1 P433_2010_R1 P433_2010_R1 P433_2010_R1 P433_2010_R1 P433_2010_R1 P433_2010_R1 P433_2010_R1 P433_2010_R1 P433_2010_R2 P433_2010_R2 P433_2010_R2 P433_2010_R2 P433_2010_R2 P433_2010_R2 P433_2010_R2 P433_2010_R2 P433_2010_R2 P433_2010_R2 P433_2010_R2 P433_2010_R2 P433_2010_R2 P433_2010_R2 P433_2010_R2 P433_2010_R2 P433_2010_R2 P433_2010_R2 P433_2010_R2 P433_2010_R2 P433_2010_R2 P433_2010_R2 P433_2010_R2 P433_2010_R2 P433_2010_R2 P433_2010_R2 P433_2010_R2
From m 189.7 191.2 192.7 194.2 195.7 197.2 198.5 199.7 201 202 203 204 205 206 207 208 209 210 211.3 212 213 214 67 67.9 68.4 70.15 71.5 73 74.5 76 77.5 79 80.5 82 83.5 85 85.8 87.8 89 90.1 91.5 93 94.9 96 97 98 99 100.5 102
To m 191.2 192.7 194.2 195.7 197.2 198.5 199.7 201 202 203 204 205 206 207 208 209 210 211.3 212 213 214 215.5 67.9 68.4 70.15 71.5 73 74.5 76 77.5 79 80.5 82 83.5 85 85.8 87.8 89 90.1 91.5 93 94.9 96 97 98 99 100.5 102 103.5
Length m 1.5 1.5 1.5 1.5 1.5 1.3 1.2 1.3 1 1 1 1 1 1 1 1 1 1.3 0.7 1 1 1.5 0.9 0.5 1.75 1.35 1.5 1.5 1.5 1.5 1.5 1.5 1.5 1.5 1.5 0.8 2 1.2 1.1 1.4 1.5 1.9 1.1 1 1 1 1.5 1.5 1.5
sc_ppm 122 76 89 83 84 102 95 244 157 186 193 191 173 152 151 202 178 58 180 92 65 60 33 32 37 34 45 52 45 49 61 48 48 68 61 59 48 30 37 59 58 65 82 100 108 109 112 102 103
y_ppm 106 104 88 98 116 119 123 101 80 75 99 96 85 86 76 92 77 89 82 66 103 92 92 88 95 93 108 121 105 100 116 106 107 129 102 96 95 96 86 158 148 118 91 89 90 94 99 97 106
zr_ppm 1030 762 802 890 1000 974 1050 2360 2370 1720 1820 1760 1860 1540 2030 1760 1310 1510 1230 1080 1790 1590 1190 1070 2110 1210 1010 1180 2080 1220 1110 1800 1570 1730 1330 1470 1450 1250 1120 1710 1580 1470 2090 2340 2210 2850 2440 2520 2750
Appendix 1.1
3D modelling and resource estimation of the Kiviniemi Scandium deposit, Eastern Finland. 65/2015, Hokka, J & Halkoaho, T.
HOLE-ID P433_2010_R2 P433_2010_R2 P433_2010_R2 P433_2010_R2 P433_2010_R2 P433_2010_R2 P433_2010_R2 P433_2010_R2 P433_2010_R2 P433_2010_R2 P433_2010_R2 P433_2010_R2 P433_2010_R2 P433_2010_R2 P433_2010_R2 P433_2010_R2 P433_2010_R2 P433_2010_R2 P433_2010_R2 P433_2010_R2 P433_2010_R2 P433_2010_R2 P433_2010_R2 P433_2010_R2 P433_2010_R2 P433_2010_R2 P433_2010_R2 P433_2010_R2 P433_2010_R2 P433_2010_R2 P433_2010_R2 P433_2010_R2 P433_2010_R2 P433_2010_R2 P433_2010_R2 P433_2010_R2 P433_2010_R2 P433_2010_R2 P433_2010_R2 P433_2010_R2 P433_2010_R2 P433_2010_R2 P433_2010_R2 P433_2010_R2 P433_2010_R2 P433_2010_R2 P433_2010_R2 P433_2010_R2 P433_2010_R2
From m 103.5 105 106.5 108 109.5 111 112.5 114.4 116.4 118 119 120.8 122.4 123.7 125 126.5 128 129.5 131 132.5 134 135.5 137 138.5 140 142 143.5 145 146.5 148 149.5 151.2 153.2 154.5 156 157.5 159 160.5 162 163.5 165 166.5 168 169.5 171 172.3 172.9 174.2 175.4
To m 105 106.5 108 109.5 111 112.5 114.4 116.4 118 119 120.8 122.4 123.7 125 126.5 128 129.5 131 132.5 134 135.5 137 138.5 140 142 143.5 145 146.5 148 149.5 151.2 153.2 154.5 156 157.5 159 160.5 162 163.5 165 166.5 168 169.5 171 172.3 172.9 174.2 175.4 176.5
Length m 1.5 1.5 1.5 1.5 1.5 1.5 1.9 2 1.6 1 1.8 1.6 1.3 1.3 1.5 1.5 1.5 1.5 1.5 1.5 1.5 1.5 1.5 1.5 2 1.5 1.5 1.5 1.5 1.5 1.7 2 1.3 1.5 1.5 1.5 1.5 1.5 1.5 1.5 1.5 1.5 1.5 1.5 1.3 0.6 1.3 1.2 1.1
sc_ppm 86 90 123 108 119 121 117 114 133 102 139 130 148 233 199 171 165 175 200 208 198 138 169 212 195 217 229 239 208 219 246 193 197 213 168 110 137 119 170 150 140 82 110 122 96 0 200 126 30
y_ppm 94 90 102 94 91 94 93 89 90 106 82 85 94 92 86 80 80 69 80 72 76 71 63 79 73 94 102 108 130 111 106 96 81 84 78 82 86 63 107 58 71 51 56 88 87 91 255 89 40
zr_ppm 2590 3310 2860 1870 2070 1920 2230 2790 1680 1490 1620 1120 1430 2570 2160 2180 2750 1940 4430 3020 2360 2660 2520 3480 3880 5290 5100 6070 5250 3120 921 684 484 655 366 359 600 493 452 265 542 618 346 473 647 689 507 537 278
Appendix 1.1
3D modelling and resource estimation of the Kiviniemi Scandium deposit, Eastern Finland. 65/2015, Hokka, J & Halkoaho, T.
HOLE-ID P433_2010_R2 P433_2010_R2 P433_2010_R2 P433_2010_R2 P433_2010_R2 P433_2010_R2 P433_2010_R2 P433_2010_R2 P433_2010_R2 P433_2010_R2 P433_2010_R2 P433_2010_R2 P433_2010_R2 P433_2010_R2 P433_2010_R2 P433_2010_R2 P433_2010_R2 P433_2010_R2 P433_2010_R2 P433_2010_R2 P433_2010_R2 P433_2010_R2 P433_2010_R2 P433_2010_R2 P433_2010_R2 P433_2010_R2 P433_2010_R2 P433_2010_R2 P433_2010_R2 P433_2010_R2 P433_2010_R2 P433_2010_R2 P433_2010_R2 P433_2010_R2 P433_2010_R2 P433_2010_R2 P433_2010_R2 P433_2010_R2 P433_2010_R2 P433_2010_R2 P433_2010_R2 P433_2010_R2 P433_2010_R2 P433_2010_R2 P433_2010_R2 P433_2010_R2 P433_2010_R3 P433_2010_R3 P433_2010_R3
From m 176.5 178 179.5 181 182.2 183.9 185.5 187.5 188.7 190.3 191.9 193.5 195.6 197 198.1 198.8 200.3 201.8 203.5 204.7 206 206.6 208.1 209.6 210.8 212 213.5 215 216.5 218 219.4 220.4 221 222.5 224 225.5 227 228.5 230 231.5 233 234.5 235.5 236.8 238 239.5 14.5 16.1 16.45
To m 178 179.5 181 182.2 183.9 185.5 187.5 188.7 190.3 191.9 193.5 195.6 197 198.1 198.8 200.3 201.8 203.5 204.7 206 206.6 208.1 209.6 210.8 212 213.5 215 216.5 218 219.4 220.4 221 222.5 224 225.5 227 228.5 230 231.5 233 234.5 235.5 236.8 238 239.5 241 16.1 16.45 17.3
Length m 1.5 1.5 1.5 1.2 1.7 1.6 2 1.2 1.6 1.6 1.6 2.1 1.4 1.1 0.7 1.5 1.5 1.7 1.2 1.3 0.6 1.5 1.5 1.2 1.2 1.5 1.5 1.5 1.5 1.4 1 0.6 1.5 1.5 1.5 1.5 1.5 1.5 1.5 1.5 1.5 1 1.3 1.2 1.5 1.5 1.6 0.35 0.85
sc_ppm 122 138 102 121 26 97 181 116 50 26 195 0 217 200 21 219 250 217 176 152 0 179 175 154 150 185 221 187 229 178 199 0 156 159 166 170 136 152 105 75 114 162 118 66 66 67 129 0 145
y_ppm 65 73 123 87 124 115 114 118 112 31 73 54 90 107 51 83 95 84 78 82 43 74 73 75 80 81 87 93 98 84 91 13 84 83 90 85 86 83 83 109 104 108 72 51 53 54 168 81 163
zr_ppm 669 550 594 545 682 673 861 1410 1670 666 3120 560 2630 3990 459 3910 4850 4580 3510 3520 384 4210 3690 3710 3890 3950 5000 4330 4840 3550 3640 126 3870 3680 3930 1490 1240 1460 1360 2220 1810 4400 1190 1320 1570 1640 5220 217 6760
Appendix 1.1
3D modelling and resource estimation of the Kiviniemi Scandium deposit, Eastern Finland. 65/2015, Hokka, J & Halkoaho, T.
HOLE-ID P433_2010_R3 P433_2010_R3 P433_2010_R3 P433_2010_R3 P433_2010_R3 P433_2010_R3 P433_2010_R3 P433_2010_R3 P433_2010_R3 P433_2010_R3 P433_2010_R3 P433_2010_R3 P433_2010_R3 P433_2010_R3 P433_2010_R3 P433_2010_R3 P433_2010_R3 P433_2010_R3 P433_2010_R3 P433_2010_R3 P433_2010_R3 P433_2010_R3 P433_2010_R3 P433_2010_R3 P433_2010_R3 P433_2010_R3 P433_2010_R3 P433_2010_R3 P433_2010_R3 P433_2010_R3 P433_2010_R3 P433_2010_R3 P433_2010_R3 P433_2010_R3 P433_2010_R3 P433_2010_R3 P433_2010_R3 P433_2010_R3 P433_2010_R3 P433_2010_R3 P433_2010_R3 P433_2010_R3 P433_2010_R3 P433_2010_R3 P433_2010_R3 P433_2010_R3 P433_2010_R3 P433_2010_R3 P433_2010_R3
From m 17.3 18.3 19.5 21 22.5 24 25.5 27 28.5 30 31.5 33 34.5 36 37.6 39.4 41.3 43 44.5 46 47.5 49 50.5 52 53.5 55 56.5 58 59.5 61 62.5 64 65.2 66.6 68 69.5 71 72.5 73.8 75 76.5 78 79.5 81 82.5 84 85.5 87 88.5
To m 18.3 19.5 21 22.5 24 25.5 27 28.5 30 31.5 33 34.5 36 37.6 39.4 41.3 43 44.5 46 47.5 49 50.5 52 53.5 55 56.5 58 59.5 61 62.5 64 65.2 66.6 68 69.5 71 72.5 73.8 75 76.5 78 79.5 81 82.5 84 85.5 87 88.5 90
Length m 1 1.2 1.5 1.5 1.5 1.5 1.5 1.5 1.5 1.5 1.5 1.5 1.5 1.6 1.8 1.9 1.7 1.5 1.5 1.5 1.5 1.5 1.5 1.5 1.5 1.5 1.5 1.5 1.5 1.5 1.5 1.2 1.4 1.4 1.5 1.5 1.5 1.3 1.2 1.5 1.5 1.5 1.5 1.5 1.5 1.5 1.5 1.5 1.5
sc_ppm 158 186 145 138 159 142 145 145 65 72 127 140 140 176 124 140 190 166 172 150 170 212 151 94 120 76 90 178 171 122 151 148 30 168 145 123 131 99 242 129 200 179 194 287 237 216 189 177 205
y_ppm 110 99 82 87 86 75 72 90 82 47 89 68 75 82 70 85 93 83 81 70 75 90 74 56 65 61 72 96 74 66 78 83 87 76 63 52 85 68 70 41 54 55 84 70 76 65 60 51 66
zr_ppm 3360 2180 1660 1380 1260 870 585 723 690 560 776 559 812 536 795 811 655 701 641 570 527 606 612 707 509 789 773 873 386 582 558 873 731 493 395 301 438 641 1190 682 902 1310 1810 1170 1830 2000 1460 858 1490
Appendix 1.1
3D modelling and resource estimation of the Kiviniemi Scandium deposit, Eastern Finland. 65/2015, Hokka, J & Halkoaho, T.
HOLE-ID P433_2010_R3 P433_2010_R3 P433_2010_R3 P433_2010_R3 P433_2010_R3 P433_2010_R3 P433_2010_R3 P433_2010_R3 P433_2010_R3 P433_2010_R3 P433_2010_R3 P433_2010_R3 P433_2010_R3 P433_2010_R3 P433_2010_R3 P433_2010_R3 P433_2010_R3 P433_2010_R3 P433_2010_R3 P433_2010_R3 P433_2010_R3 P433_2010_R3 P433_2010_R3 P433_2010_R3 P433_2010_R3 P433_2010_R3 P433_2010_R3 P433_2010_R3 P433_2010_R3 P433_2010_R3 P433_2010_R3 P433_2010_R3 P433_2010_R3 P433_2010_R3 P433_2010_R3 P433_2010_R3 P433_2010_R3 P433_2010_R3 P433_2010_R3 P433_2010_R3 P433_2010_R3 P433_2010_R3 P433_2010_R3 P433_2010_R3 P433_2010_R3 P433_2010_R4 P433_2010_R4 P433_2010_R4 P433_2010_R4
From m 90 91.5 93 94.5 96 97.5 99 100.5 102 103.5 105 106.5 108 109.5 111 112.5 114 115.5 117 118.5 120 121.5 123 124.5 126 127.5 128.8 130.1 131.5 133 134.5 136 137.5 139.2 141.4 142.7 144.2 145.6 146.8 148.5 150 151.5 152.6 154.2 155.7 62.5 63.7 64.3 65.5
To m 91.5 93 94.5 96 97.5 99 100.5 102 103.5 105 106.5 108 109.5 111 112.5 114 115.5 117 118.5 120 121.5 123 124.5 126 127.5 128.8 130.1 131.5 133 134.5 136 137.5 139.2 141.4 142.7 144.2 145.6 146.8 148.5 150 151.5 152.6 154.2 155.7 157.2 63.7 64.3 65.5 67.1
Length m 1.5 1.5 1.5 1.5 1.5 1.5 1.5 1.5 1.5 1.5 1.5 1.5 1.5 1.5 1.5 1.5 1.5 1.5 1.5 1.5 1.5 1.5 1.5 1.5 1.5 1.3 1.3 1.4 1.5 1.5 1.5 1.5 1.7 2.2 1.3 1.5 1.4 1.2 1.7 1.5 1.5 1.1 1.6 1.5 1.5 1.2 0.6 1.2 1.6
sc_ppm 201 176 163 183 194 153 166 201 228 176 194 187 184 249 235 242 242 197 181 189 204 178 157 141 157 186 0 146 152 143 139 133 130 69 63 170 124 106 145 165 174 154 127 68 69 0 0 154 229
y_ppm 66 58 53 57 69 52 52 61 63 65 57 103 80 95 91 90 83 79 80 84 79 77 73 69 76 94 60 82 83 81 81 88 94 110 100 103 94 77 85 92 96 89 84 97 104 39 25 76 64
zr_ppm 1390 1850 2030 1510 2740 1190 1390 3600 1630 3270 2270 3180 2600 5070 4010 5010 4410 2870 1960 1960 1100 1430 1590 1770 1450 2250 196 1640 1360 1610 777 431 844 1210 1210 825 700 543 470 289 346 339 479 1370 1420 117 337 769 3490
Appendix 1.1
3D modelling and resource estimation of the Kiviniemi Scandium deposit, Eastern Finland. 65/2015, Hokka, J & Halkoaho, T.
HOLE-ID P433_2010_R4 P433_2010_R4 P433_2010_R4 P433_2010_R4 P433_2010_R4 P433_2010_R4 P433_2010_R4 P433_2010_R4 P433_2010_R4 P433_2010_R4 P433_2010_R4 P433_2010_R4 P433_2010_R4 P433_2010_R4 P433_2010_R4 P433_2010_R4 P433_2010_R4 P433_2010_R4 P433_2010_R4 P433_2010_R4 P433_2010_R4 P433_2010_R4 P433_2010_R4 P433_2010_R4 P433_2010_R4 P433_2010_R4 P433_2010_R4 P433_2010_R4 P433_2010_R4 P433_2010_R4 P433_2010_R4 P433_2010_R4 P433_2010_R4 P433_2010_R4 P433_2010_R4 P433_2010_R4 P433_2010_R4 P433_2010_R4 P433_2010_R4 P433_2010_R4 P433_2010_R4 P433_2010_R4 P433_2010_R4 P433_2010_R4 P433_2010_R4 P433_2010_R5 P433_2010_R5 P433_2010_R5 P433_2010_R5 P433_2010_R5 P433_2010_R5
From m 67.1 68.1 69.1 70.45 72.5 74 75.5 77 78.3 79.6 80.85 82.1 83.5 85 86.6 88 89.5 91 92.5 94 95.5 97 98.5 100 101.5 103 104.5 106 107.5 109 110.5 112 113.5 115 116.5 118 119.5 121 122.5 124 125.5 127 128.5 129.5 130.7 51 52 53 54 55 56
To m 68.1 69.1 70.45 72.5 74 75.5 77 78.3 79.6 80.85 82.1 83.5 85 86.6 88 89.5 91 92.5 94 95.5 97 98.5 100 101.5 103 104.5 106 107.5 109 110.5 112 113.5 115 116.5 118 119.5 121 122.5 124 125.5 127 128.5 129.5 130.7 131.5 52 53 54 55 56 57
Length m 1 1 1.35 2.05 1.5 1.5 1.5 1.3 1.3 1.25 1.25 1.4 1.5 1.6 1.4 1.5 1.5 1.5 1.5 1.5 1.5 1.5 1.5 1.5 1.5 1.5 1.5 1.5 1.5 1.5 1.5 1.5 1.5 1.5 1.5 1.5 1.5 1.5 1.5 1.5 1.5 1.5 1 1.2 0.8 1 1 1 1 1 1
sc_ppm 239 245 208 167 165 218 225 135 111 0 0 46 44 36 41 40 51 37 43 46 41 0 43 52 69 57 60 34 37 49 47 47 50 48 47 50 60 49 48 44 48 52 43 49 81 60 67 59 62 64 69
y_ppm 77 77 70 64 72 79 74 75 89 0 0 66 64 52 65 80 94 77 60 64 54 11 83 83 92 99 112 78 54 68 69 68 71 69 64 72 76 72 72 68 77 79 81 85 198 124 136 118 124 126 122
zr_ppm 5790 5490 3650 3690 2290 2240 2240 1840 2530 63 0 1370 1240 1100 1270 1580 2510 2090 1430 1480 1210 0 1780 3480 2220 1930 2450 1070 1070 1300 1510 1270 1320 1630 1180 1380 1260 1220 1260 1140 1400 1330 1430 1400 2440 1270 1330 1320 1360 1350 1120
Appendix 1.1
3D modelling and resource estimation of the Kiviniemi Scandium deposit, Eastern Finland. 65/2015, Hokka, J & Halkoaho, T.
APPENDIX 1.2. CROSS-SECTION OF DOMAIN BOUNDARIES
Figure 1.2.1. Cross-section of domain boundaries
3D modelling and resource estimation of the Kiviniemi Scandium deposit, Eastern Finland. 65/2015, Hokka, J & Halkoaho, T.
Figure 1.2.2. Cross-section of individual domain boundaries.
3D modelling and resource estimation of the Kiviniemi Scandium deposit, Eastern Finland. 65/2015, Hokka, J & Halkoaho, T.
APPENDIX 1.3. THE SOLID MODEL OF KIVINEMI INTRUSION
Figure 13.1. The solid model of the main intrusion and smaller NE block. Red areas are drill hole intersections with higher confidence and brown areas interpretation.
3D modelling and resource estimation of the Kiviniemi Scandium deposit, Eastern Finland. 65/2015, Hokka, J & Halkoaho, T.
APPENDIX 1.4. VISUAL VALIDATION OF INDIVIDUAL DOMAINS
Figure 1.4.1. Visual validation of individual domains. The colour coding is presented in the table above.
3D modelling and resource estimation of the Kiviniemi Scandium deposit, Eastern Finland. 65/2015, Hokka, J & Halkoaho, T.
Figure 1.4.2. Visual validation of individual domains.
3D modelling and resource estimation of the Kiviniemi Scandium deposit, Eastern Finland. 65/2015, Hokka, J & Halkoaho, T.
Figure 1.4.3. Visual validation of global domain.
3D modelling and resource estimation of the Kiviniemi Scandium deposit, Eastern Finland. 65/2015, Hokka, J & Halkoaho, T.
APPENDIX 1.5. BLOCKMODEL OF KIVINIEMI INTRUSION WITH DIFFERENT CUT OFF GRADE
Figure 1.5.1. Individual domains with 40 ppm Sc cut off.
Figure 1.5.2. Individual domains with 100 ppm Sc cut off.
3D modelling and resource estimation of the Kiviniemi Scandium deposit, Eastern Finland. 65/2015, Hokka, J & Halkoaho, T.
Figure 1.5.3. Individual domains with 150 ppm Sc cut off.
Figure 1.5.4. Individual domains with 200 ppm Sc cut off.


![[Read] Mineral Resource Estimation Popular Online - Google Sites](https://m.moam.info/img/260x300/read-mineral-resource-estimation-popular-online-go_6478f162097c474b228dc240.jpg)