area coverage and the gap frequencies influence the light reflectance in the upper ... along the Amazon River and its main affluents. They are characterized by ...
German-Brazilian Workshop on Neotropical Ecosystems – Achievements and Prospects of Cooperative Research Hamburg, September 3-8, 2000 Session 4: Living Resources Management: Approaches, Techniques, Variability
Detection of Different Forest Types in Central Amazonian Várzea by Remote Sensing Techniques - Preliminary Results Wittmann, F.1, Anhuf, D.2 and Junk, W.1 1
Max-Planck-Institut für Limnology, Plön, Germany Universität Mannheim, Institut für Physische Geographie, Mannheim, Germany
2
Abstract
1
In Central Amazonian white-water floodplains (várzea), different forest types become established in relation to the flood-level gradient. The formations are characterized by typical patterns of species composition, and their architecture can be quantified using large-scale aerial photography. Crown sizes, tree heights, the projected crown area coverage and the gap frequencies influence the light reflectance in the upper canopy, and provide information which facilitates a classification of different forest types by satellite imagery. Results of ground analysis indicate that at the average flood-level of 3 m, species diversity and architecture of the forests changes, thus justify the classification into the categories of low várzea (várzea baixa) and high várzea (várzea alta). The structure of low várzea depends on the successional stage, and species diversity increases with increasing age of the formations. Within the early successional stages of low várzea, a homogeneous, nonstratified canopy is developped, with uniform tree heights and crown extensions, resulting in a smooth canopy surface. Gap frequency is low. Therefore, these forests show a simple behaviour pattern in pixel distribution and are easy to detect, when scanned by TM images. In subsequent successional stages, tree heights and crown areas increase, and an initial stratification is developed. Gap frequency tends to increase with increasing age of the formations. In high várzea, only one successional stage was found and species diversity is higher than in all low-várzea formations. Tree heights reach 45 m and stratification is well defined. The more complex architecture of the high várzea results in the most diffuse behaviour patterns of pixel distribution, when scanned by TM image data.
The várzea forests of central Amazonia are seasonally flooded by white-water rivers (PRANCE 1979), which occur along the Amazon River and its main affluents. They are characterized by periodic floods, reaching an average amplitude of 10 m and lasting up to 230 d each year (JUNK 1989). Tree species diversity and structure of várzea forests vary along the flood gradient. Typical vegetation units and forest communities become established at different flood levels. JUNK (1989) described three tree-level communities with characteristic species compositions in the várzea. Each community is determined by the flood-level gradient and duration of flooding. AYRES (1993) also correlated different forest types with the annual flood level. He described the ‘chavascal’ as a community influenced by water height of 5-7 m and flood duration of 6-8 mo. every year. The ‘restinga baixa’ undergoes 2.5-5 m flooding (4-6 mo.), and the ‘restinga alta’ an average of 1-2.5 m (2-4 mo.). In addition to the influence of flooding, the natural development of forests defines tree species composition, species diversity and architecture of várzea forests. Without taking the flood gradient into consideration, WORBES (1997) found five main successional stages, from the first establishment of pioneer species on recent sedimentation bars to the climax stage with trees reaching ages of up to 400 y. Even though many attempts have been made to quantify the different várzea habitats in Amazonia using remote-sensing techniques (HESS et al. 1990, 1995; MERTES et al. 1995, NOVO et al. 1997a, RADAMBRASIL 1976, SAATCHI et al. 2000), no satisfactory and comprehensive classification of the different forest types has been presented up to now. Most of the studies concentrated on the classification of herbaceous plants (COSTA et al. 1996, 1998, NOVO et al. 1997b) and in closed canopy forests only the separation of pioneer and non-pioneer formations has been realized (HÖNSCH 1993, SOCIEDADE CIVIL MAMIRAUÁ et al. 1996, WITTMANN 1997). The present study deals with large-scale investigation of the structure and architecture of different várzea forest types.
Keywords Amazonia, Aerial photography, Flooding gradient, Landsat TM, Remote sensing, Succession, Várzea.
Introduction
Wittmann, F., Anhuf, D. and Junk, W.: Detection of Different Forest Types in Central Amazonian Várzea by Remote Sensing Techniques - Preliminary Results
607
German-Brazilian Workshop on Neotropical Ecosystems – Achievements and Prospects of Cooperative Research Hamburg, September 3-8, 2000 Session 4: Living Resources Management: Approaches, Techniques, Variability
communities and they differ in topography and thus the flood height and duration of flooding. Three plots are influenced by submersion about 4.5 m or an average of 122 dy-1 (low várzea), while one plot is influenced by submersion about 2.5 m or 53 dy-1 (high várzea) (Fig. 1). In the classification of WORBES (1997), the three low-várzea sites represent the successional stages of early secondary, late secondary and the climax stage. The high-várzea site represents a climax stage.
Data obtained through aerial photography were compared with data obtained from Landsat TM images. The density and structure of high-canopy tree tops, especially projected crown areas, as well as tree heights, gap sizes and gap frequency provide the most important information for classification of forest vegetation by remote-sensing (BUTERA 1986, HALLÉ et al. 1978, PETERSON et al. 1986, RHODY 1983). The aim of this study was to describe typical upper-canopy features of the different várzea forest types, to facilitate their detection through satellite- image data.
2.2 2
Aerial Photography
Material and Methods To scale up from ground analysis to satellite data, perpendicular aerial photography of all study sites was obtained between April and September 1999. The photographs were taken at altitudes between 500 and 800 m, using a digital reflex camera (Minolta RD 175, focal distance: 50 mm) and a large format camera (Linhof Aerotechnica, focal distance: 48 mm). Photographs were resampled by screening and geo-referenced using line distances measured on forest ground. Natural geometric displacements, usually established with increasing distance from the nadir-point in each photo, were not considered. All photographs were processed at a scale of approximately 1:1000. All recognized crowns or crown-fractions were digitized to determine the single crown area. The area of gaps in proportion to the crown area coverage was examined. Tree heights were determined using overlapping scenes of conventional photos and a stereoscope (Zeiss-Stereochord G3). In stereoscopic vision, the heights were determined by the procedure of paralaxis calculation. For sub-canopy trees, tree heights were estimated in the field.
The main part of the study was carried out within the focal area at the Mamirauá Sustainable Development Reserve (MSDR) (2°51´S, 64°55´W), approximately 70 km northwest of the city of Tefé and 50 km upstream from the mouth of the Japurá river into the Solimões, in western Central Amazonia, Brazil. The focal area of MSDR amounts to 260000 ha, and approximately 90% of the area is covered by closed canopy forests (SOCIEDADE CIVIL MAMIRAUÁ et al. 1996). A preliminary investigation was conducted at Ilha da Marchantaria in the lower Rio Solimões, an island with an area of approximately 45 km2 (3°15´S, 59°58´W), located 20 km south-west the city of Manaus. 2.1
Ground Analysis
For this study, a total of four rectangular plots of 1 ha (50 x 200 m) were investigated. All trees ≥ 10 cm dbh were identified in species. The sites represent different forest
2.3
Satellite Imagery
For this study, TM images from 1997 and 1998, obtained at the Instituto Nacional de Pesquisas Espaciais (INPE), with the bands 5 (0.63-0.69 µm, red), 4 (0.76-0.90 µm, near IR) and 3 (1.55-1.75 µm, middle IR) were used, representing a common band-combination for the classification of forest vegetation units (ALBERTZ 1991, BUTERA 1986, HÖNSCH 1993). The images were geo-referenced using Ground Control Points (GCPs) at each plot measured by a Global Positioning System (GPS). Image enhancements were realized by greyscale-stretching by 5%. Using the supervised classification by maximum-likelihood clustering, all areas with the same or similar pixel distributions were classified and assigned to the same or similar forest formation. The amount of unclassified pixels
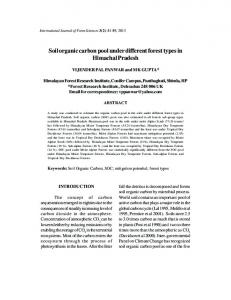
Fig. 1: Relative location of the study sites along the average flood gradient (m). With days of submersion per year in a: high várzea (1 ha), b: low várzea (3 ha) and c: closed forest borderline.
Wittmann, F., Anhuf, D. and Junk, W.: Detection of Different Forest Types in Central Amazonian Várzea by Remote Sensing Techniques - Preliminary Results
608
German-Brazilian Workshop on Neotropical Ecosystems – Achievements and Prospects of Cooperative Research Hamburg, September 3-8, 2000 Session 4: Living Resources Management: Approaches, Techniques, Variability
was defined < 1%. More distant areas (± 20 km), showing a similar pixel distribution in the colour composite were visited on location to verify the actual forest type. 3
Results
3.1
Ground Check
3.2
Aerial Photography
Using aerial photographs, the total projected crown area of 942 individuals was measured within an area of 4 ha. Generally, crown areas differ with the successional stage and the topographic situation of the tree stands. In the early-secondary stage of low várzea, 62% of all trees found in the plot are in the upper canopy (Fig. 2). A homogenous sub-canopy stratum is absent. Tree heights amounted to 15-20 m. In this young successional stage, a pronounced stratification does not exist and the canopy forms an overall homogeneous surface. Accordingly, the average gap area ha-1 was comparatively small and amounted to 11.5%. The average crown area per tree was 26.0 m2. Cecropia latiloba (Cecropiaceae), a fast-growing light-demanding pioneer species, dominates the forest stand with a total coverage of 37%. In the late-secondary stage, 41% of all trees in the plot are part of the upper canopy (Fig. 2). In contrast to the early successional stages, an initial stratification is developed. The sub-canopy stratum has an average height of 15-20 m,
Detailed information about diversity and floristic composition of the investigated plots are described by WITTMANN et. al. (2001). In this study, the most important differentiation of várzea forests is between the low várzea (várzea baixa) and the high várzea (várzea alta), separated by a border-line at the average flood level of 3 m. In the three low-várzea sites, the number of individual trees ≥10 cm dbh decreased from about 650 in the early-secondary stage (estimated age: 30 y) to about 450 in the climax stage (estimated age: 200-400 y). Species diversity increased from 35 species in the early-secondary stage to 100 species in the climax stage. In high várzea (climax stage), the inventory found 469 individual trees, belonging to 177 species.
Fig. 2: Map of crowns of the four plots, evaluated by aerial photography. With n: number of recognized crowns, cac: crown area coverage, ga: gap area, cat: average crown size (sd=standard deviation), and cx:crown layers (stratification) in m.
Wittmann, F., Anhuf, D. and Junk, W.: Detection of Different Forest Types in Central Amazonian Várzea by Remote Sensing Techniques - Preliminary Results
609
German-Brazilian Workshop on Neotropical Ecosystems – Achievements and Prospects of Cooperative Research Hamburg, September 3-8, 2000 Session 4: Living Resources Management: Approaches, Techniques, Variability
often shaded by species of the upper-canopy stratum at a height of 25-30 m. The tree-top size on average amounted to 44.8 m2 per tree, and was considerably larger than in the early-secondary stage. The amount of gaps averaged 15.3%. In the climax stage of low várzea, 39% of all trees in the plot are in the upper canopy. Here, a higher amount of all adult individuals are shade-tolerant tree species of the understorey. Trees belong to two significant canopy strata, which were found at 30-40 m (upper canopy) and at 20-25 m (sub-canopy). The forest floor is constantly shaded and sparsely populated by young individuals, which form a third stratum at 5-15 m. The area measured for the tree tops averaged 52.3 m2 per tree, thus representing the highest measured mean value. Also the projected crown area coverage was the highest measured with 92.7%, while the gap area averaged 7.3% (Fig. 2). In high várzea, only 34.7% trees reach the upper canopy (Fig. 2). Canopy stratification in the plot is well defined. The upper canopy reached a height of 40-45 m. A homogeneous sub-canopy stratum occurred at the height of 30 m, followed by a third well-developed stratum at a height of about 15 m. On average, the crown area in the upper 2 canopy amounted to 51.3 m , thus it is comparable with the climax stage of the low várzea. The projected crown area coverage amounted to 84.2% while the gap area was 15.8%, respectively.
3.3
TM-Classification
Using supervised classification, it was possible to classify three different forest types. High várzea is clearly defined, but it was difficult to determinate the borders of the different low-várzea formations. Within the low várzea, the early-secondary forest appeared with a constantly low pixel diversity as shown in the histogram (Fig. 3). Since early successional stages often occur next to the rivers or river-channels on small sand bars, an unequivocal classification was prevented by the comparatively low image resolution of 30 m per pixel. The late-secondary stage could not be clearly separated from the climax stage. Pixel distribution of both formations was very similar, with almost the same standard deviations presented in the histogram (Fig. 3). However, demarcation of these two formations was clearly defined by the early successional stages in the low várzea as well as the formation of the high várzea. High-várzea formations are characterized by the most complex behaviour pattern of pixel distribution. Therefore, the histogram shows the highest standard deviations (Fig. 3).
Fig. 3: Average pixel distribution (histogram) of the three classified forest communities, each investigated in ten sites with n = 306 pixel. With class I: early secondary and chavascal forest, class II: late secondary and climax forest, class III: high várzea forest.
Wittmann, F., Anhuf, D. and Junk, W.: Detection of Different Forest Types in Central Amazonian Várzea by Remote Sensing Techniques - Preliminary Results
610
German-Brazilian Workshop on Neotropical Ecosystems – Achievements and Prospects of Cooperative Research Hamburg, September 3-8, 2000 Session 4: Living Resources Management: Approaches, Techniques, Variability
4
extensions result in a smooth canopy surface. Therefore, the limited range of light reflection allows a good detection of these forests by TM image data. More diverse late secondary and climax stages of low várzea show initial stratification, gaps were caused by the mortality of big trees, and the local establishement of pioneer species result in a more complex architecture of these forests. Finally, highvárzea formations are characterized by the most complex architecture, resulting in the most intense light scattering and the most diffuse behavior patterns in pixel distribution, when scanned by TM images. There is no evidence that gap frequency is linked to crown area coverage or tree-top density. On the other hand, gap frequency tends to increase with increasing age of the forests. Local gaps with significant sizes are absent in early successional stages, and the whole forest changes overall in species, leading continuously to subsequent successional stages. From the late secondary stages, the importance of gaps and local succession to light reflectance increases. However, increasing tree-crown extensions in subsequent successional stages compensate the trend of increasing gap frequency. Therefore, the importance of tree-crown density influencing light reflection, as mentioned by BUTERA (1986) and PETERSON et al. (1986), can not be confirmed within the closed canopy forests of the várzea. Rather all the factors quantified by aerial photography in this study are supposed to result in the different light-reflection patterns of the classified forest formations.
Discussion
In closed canopy forests, TM data indicate the quantity of light reflected from the upper canopy. Light reflectance in a forest depends on the arrangement, morphology and quantity of leaf cells, on different leaf morphologies, and on the spatial arrangement of leaves and branches (HALLÉ et al. 1978, HILDEBRANDT 1976, HÖNSCH 1993, SELLERS 1985). ACCORDING TO BUTERA (1986) and PETERSON et al. (1986), the most important factor that influences spectral variations is the tree crown density. In addition, image texture gives an classification feature of closed canopy forests (HÖNSCH 1993). The canopy appearance principle takes up the relief surface, so that its structure reflects topographical changes. The results of this study indicate that the várzea forests contain two significantly different habitats with respect to forest structure and species composition, reflecting the topography of the environment. Both the low várzea and the high várzea are characterized by the dominance of typical tree species, probably defined by their adaptations to the annual flood stress. Below a flood level of 3 m, natural forest succession results in different forest types, which species diversity and architecture complexity is increasing with increasing age. Above a flood level of 3 m, only one successional stage was found and species diversity, population dynamics and architecture of high várzea is more complex than in all low-várzea formations. Multi-spectral TM-images are still a convenient and economical remote-sensing resource for differentiating and classifying tropical forest communities. However, the utilization of multi-temporal optic-based images of the Amazon Basin is strongly affected by cloud cover (COSTA et al. 1998), and cloudless scenes are scarce. In addition, the relative low resolution of 30 m per pixel often does not allow a clear definition of community borders, especially when forest communities are small. A reliable classification by satellite imagery depends on the quantity and the quality of ground-checks. Therefore, aerial photography is an important method to scale between ground and Landsat data. The determinant factors in the upper canopy are difficult to obtain by field work alone. In this study, it was possible to differentiate between three main várzea-forest communities using satellite-image data. Aerial photographs can quantify the architecture of forest types. Each community is determined by typical features of growth heights and crown extensions, which increase with the age of the forest types and/or the increasing topography of their stands. In young successional stages, low species diversity, homogeneous tree heights and small crown
5
References
ALBERTZ, J. 1991. Grundlagen der Interpretation von Luft- und Satellitenbildern. Eine Einführung in die Fernerkundung. Wissenschaftliche Buchgesellschaft Darmstadt. 204 pp. AYRES, J. M. 1993. As matas de várzea do Mamirauá. Pp 1-123 in Sociedade Civil Mamirauá (ed). Estudos de Mamirauá, Vol. 1. BUTERA, M. K. 1986. A correlation and regression analysis of percent canopy closure versus TMS spectral response for selected forest sites in the San Juan National Forest, Colorado. Transactions on Geoscience and Remote Sensing, Vol. GE-24 (1):122-129. COSTA, M.P. DE, MORAES NOVO, E.M., AHERN, F., MITSUO, F., MANTOVIANI, J.E., BALLESTER, M.V. & PIETSCH, R.W. 1998. The Amazon floodplain through radar eyes: Lago Grande de Monte Alegre case study. Canadian Journal of Remote Sensing 24 (4):339-349. HALLÉ, F., OLDEMAN, R. A. & TOMLINSON, P. B. 1978. Tropical trees and forests. An architectural analysis. Springer Verlag New York. 450 pp. HESS, L., MELACK, J., FILOSO, S., WANG, Y. 1995. Delineation of inundated area and vegetation along the Amazon floodplain with SIR-C Synthetic Aperture Radar. IEEE Transactions on Geoscience and Remote Sensing 33(4):896-903. HILDEBRANDT, G. 1976. Die spektralen Reflexionseigenschaften der Vegetation. Remote Sensing in Forestry.-Proc. Symp. During the XVI I UFRO World Congress Oslo:9-22.
Wittmann, F., Anhuf, D. and Junk, W.: Detection of Different Forest Types in Central Amazonian Várzea by Remote Sensing Techniques - Preliminary Results
611
German-Brazilian Workshop on Neotropical Ecosystems – Achievements and Prospects of Cooperative Research Hamburg, September 3-8, 2000 Session 4: Living Resources Management: Approaches, Techniques, Variability
SAATCHI, S.S., NELSON, B., PODEST, E. & HOLT, J. 2000. Mapping land cover types in the Amazon Basin using 1 km JERS-1 mosaic. International Journal of Remote Sensing 21(6-7):1201-1234. SELLERS, P. 1985. Canopy reflectance, photosynthesis and respiration. International Journal of Remote Sensing 6:1335-1372. SOCIEDADE CIVIL MAMIRAUÁ (SCM), CONSELHO NACIONAL DE DESENVOLVIMENTO CIENTÍFICO E TECNOLÓGICO (CNPq/MCT), INSTITUTO DE PROTEÇÃO AMBIENTAL DO ESTADO DO AMAZONAS (IPAAM) (eds). 1996: Mamirauá, Plano de Manejo (síntese). Brasilia, pp. 96. WITTMANN, F. 1997. Die Várzea Wälder Zentralamazoniens Phänologische Untersuchungen ausgewählter Baumarten zur Reaktion auf den annuellen Flutungsstreß. Diplomarbeit, Geographisches Institut der Universität Mannheim, pp 88. WITTMANN, F., ANHUF, D. & JUNK, W. J. (2001): Tree species distribution and community structure of Central Amazonian várzea forests by remote sensing techniques.( submitted to Journal of Tropical Ecology) WORBES, M. 1986. Lebensbedingungen und Holzwachstum in zentralamazonischen Überschwemmungswäldern. Scripta Geobotanica 17:1112. WORBES, M. 1997. The forest ecosystem of the floodplains. Pp. 223-265 in JUNK, W. (ed). The central Amazon floodplain: Ecology of a pulsating system. Ecological Studies Vol. 126, Springer Verlag, Heidelberg.
HÖNSCH, H. 1993. Erfassung und und Klassifizierung von tropischen Regenwaldformationen und anthropogenen Nutzungen anhand multisensoralen Satellitenbilddaten am Beispiel Brasiliens. DLR-Forschungsbericht 93-95. 229 pp. JUNK, W. J. 1989. Flood tolerance and tree distribution in Central Amazonian floodplains. Pp 47-64 in Nielsen, L.B., Nielsen, I.C. & Balslev, H. (eds). Tropical Forests: Botanical dynamics, speciation and diversity. Academic Press London. LÖFFLER, E. 1994. Geographie und Fernerkundung. Teubner Verlag, Stuttgart. 251 pp. MERTES, L.A.K., DANIEL, D.L., MELACK, J.M., NELSON, B., MARTINELLI, A. & FORSBERG, B.R. 1995. Spatial patterns of hydrology, geomorphology, and vegetation on the floodplain of the Amazon River in Brazil from a Remote Sensing Perspective. Geomorphology 13: 215-232. NOVO, E., LEITE, F., AVILA, J., BALLEMESTER, M. & MELACK, J. 1997A. Assessment of Amazon Floodplain habitats using TM/Landsat data. Ciência e Cultura 49 (4): 280-284. NOVO, E., COSTA, M., MANTOVANI, J. & BALLESTER, M. 1997B. RADARSAT Relative backscanner and macrophyte canopy variables: Preliminary results for Tucuruí Reservoir and Lago Grande floodplain, Brazilian Amazon. Proceedings GER´97 (5):25-30, Ottawa. CD-ROM publ. PETERSON, D.L.,WESTMAN, W. E., STEPHENSON, N. J., AMBROSIA, V. G., BRASS, J. A. & SPANNER, M. A. 1986. Analysis of forest structure using Thematic Mapper Simulator Data. Transactions on Geoscience and Remote Sensing Vol. GE-24 (1), 113-121. PRANCE, G. T. 1979. Notes on the vegetation of Amazonia III. The terminology of Amazonian forest types subject to inundation. Brittonia 31 (1): 26-38, New York. RADAMBRASIL.1976. Levantamento de Recursos Naturais. Vol. 10, Rio de Janeiro. RHODY, B. 1983. Erfassung mitteleuropäischer Hauptbaumarten im Rahmen von Waldinventuren mit Hilfe kleinformatiger Luftaufnahmen. Schweizerische Zeitschrift für Forstwesen 134:17-36.
6
Acknowledgements
We wish to thank the Institute for Sustainable Development Research Mamirauá (ISDRM) and the Instituto Nacional de Pesquisas da Amazônia (INPA) for assistance and Dr. Pia Parolin and Thomas Motzer for helpful comments on this manuscript. The field work was made possible by financial support from the INPA/Max-Planck Project.
Wittmann, F., Anhuf, D. and Junk, W.: Detection of Different Forest Types in Central Amazonian Várzea by Remote Sensing Techniques - Preliminary Results
612
Reinhard Lieberei 1, Helmut K. Bianchi 2, Vera Boehm 1, Christoph Reisdorff 1
Editors
1
Universität Hamburg, Institut für Angewandte Botanik, Ohnhorststr. 18, 22609 Hamburg, Germany
2
GKSS-Forschungszentrum Geesthacht GmbH, Max-Planck-Straße 1, 21502 Geesthacht Germany
Layout
Helmut K. Bianchi, GKSS, Karsten Bittner, Documedia, Geesthacht, Germany
Printing
GKSS-Forschungszentrum Geesthacht GmbH, Geesthacht, Germany
ISBN 3-00-010691-X
Lieberei, R., Bianchi, H-K., Boehm, V., Reisdorff, C., (eds.) 2002: Neotropical Ecosystems, Proceedings of the German-Brazilian Workshop, Hamburg 2000. GKSS-Geesthacht .
The publishers give permission to copy single contributions from the Proceedings for personal use exclusively. Copies may be passed on only with the correct specification of the source. The research cooperation has been carried out under the auspices of the German - Brazilian Govemmental Agreement on the Cooperation in Scientific Research and Technological Development. The issuance of the Proceedings and the production of the CD-ROM was sponsored (Code 0339991) by the
Federal Ministry of Education and Research The responsibility for the contents of the contributions is solely the authors'.