of absolute lung volume and airway resistance ... extent of lung function
impairment, spirometry tests ..... a roll of z-folded sheet metal acting as a fixed
resis- tor.
95
Pulmonary Fu 8. Pulmonary Function Testing
Pulmonary function tests (PFT) examine the functionality of the lungs. This chapter describes the working principles of major test techniques and instruments including spirometry, peak flowmetry, body plethysmography, nitrogen washout, and ergospirometry. Spirometry (Sect. 8.1), specifically the measurement of the amount (volume) and speed (flow) of air that can be inhaled or exhaled, is the most basic of the pulmonary function tests. Body plethysmography (Sect. 8.2.2) offers determination of absolute lung volume and airway resistance and is particularly sensitive in the detection of obstructive pulmonary disease requiring little patient cooperation. Nitrogen washout (Sect. 8.2.4) is a common test for measuring functional residual lung capacity. Ergospirometry evaluates the complex interaction between lung, heart, and muscle by analysing the gas exchange under exercise (Sect. 8.2.5). The chapter closes with considerations of planning and laboratory space (Sect. 8.2.8).
8.1
Spirometry ........................................... 95 8.1.1 Flow Recording ............................ 96 8.1.2 Technology .................................. 96 8.1.3 Methodology of Spirometry ........... 101 8.1.4 Cooperation-Free Pulmonary Function Tests.............................. 104
8.2 Advanced Cardiopulmonary Function Testing................................... 8.2.1 Overview ..................................... 8.2.2 Body Plethysmography ................. 8.2.3 Diffusion Capacity ........................ 8.2.4 Nitrogen-Washout Test for Determination of FRC ............... 8.2.5 Ergospirometry ............................ 8.2.6 Noninvasive Determination of Cardiac Output ......................... 8.2.7 Metabolic Activity Monitoring ........ 8.2.8 Planning and Laboratory Space Considerations .............................
105 105 106 109 111 111 114 115 116
References .................................................. 116
8.1 Spirometry Spirometers are noninvasive diagnostic instruments for screening and basic testing of pulmonary function. Offering essential diagnostic insight into the type and extent of lung function impairment, spirometry tests can be performed fast at fairly low cost. In the light of an ever-increasing prevalence of airway diseases such as asthma, bronchitis, and emphysema, pulmonary function instruments have become indispensable diagnostic tools, in clinical and office settings, in industrial and preventive medicine, as well as in epidemiology. Screening of individuals at risk, basic testing of sick patients, and treatment follow-up are key applications of spirometry.
Two essential questions of pulmonary function testing (PF testing) can be answered by spirometry: 1. What is the size of lung volume which can be inspired or expired? 2. What is the time it takes to exhale this volume, or what is the flow rate during exhalation? Flow rates and resulting volumes are measured by connecting a spirometry sensor through a mouthpiece to the test subject’s mouth. The most common and internationally standardized test consists of an evaluation of forced expiration after a complete inhalation, allowing the determination of forced vital capacity (FVC)
Part B 8
Rolf M. Schlegelmilch, Rüdiger Kramme
96
Part B
Functional Diagnostics Devices
a)
b) Volume-time spirogram
Flow-volume loop
V (l)
PEF FEF25
Flow (l/s)
FEF50
Part B 8.1
EX
FEF75 FVC
Expiration
FEV1
Volume (l)
FVC Flow (l /s)
EVC
IN
1
t (s)
VT ERV IRV IC VCIN
IVC IC VT IRV ERV FVC FEV1 FEV1% PEF FEF25
= Inspiratory vital capacity = Inspiratory capacity = Tidal volume = Inspiratory reserve volume = Expiratory reserve volume = Forced vital capacity = Forced expiratory volume in one second = FEV1 in % of vital capacity = Peak expiratory flow = Forced expiratory flow when 25% of the FVC has been expired FEF50 = Forced expiratory flow when 50% of the FVC has been expired FEF25 = Forced expiratory flow when 75% of the FVC has been expired PIF = Peak inspiratory flow
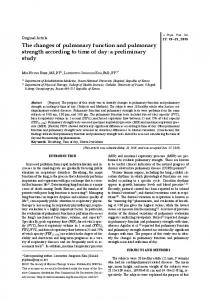
Fig. 8.1 (a) Forced spirogram and (b) flow–volume loop
and the forced expired volume during the first second (FEV1 ). Recording of the test trace is taken as a forced spirogram (volume over time) or as a flow– volume loop (flow against volume). Although FVC and FEV1 are the most common, dozens of parameters can be derived when evaluating forced expiration, all describing the shape and size of recorded traces and loops (Fig. 8.1). Besides forced spirometry, slow spirometry, i.e., the recording of slow inspiration and expiration at tidal breathing, may also be recorded, offering determination of lung-volume subdivisions such as tidal volume (VT), inspiratory and expiratory reserve volume (IRV and ERV), as well as inspiratory capacity (IC). In most cases, slow spirometry will be a part of advanced PF tests (Sect. 8.2.2).
8.1.1 Flow Recording The basis of all PF tests consists in the recording of air flow rates against time, a procedure also called pneumotachography. Mostly, flow velocity [cm/s] is measured in a defined sensor geometry, yielding flow [l/s], also referred to as flow rate. In 1925 the Swiss physiologist Alfred Fleisch published about the clinical application of pneumotachography. While registration of spirometry traces and flow–volume loops required a recorder and manual evaluation in the past, all contemporary spirometers contain microprocessors for online data processing, displaying results on a builtin screen or transferring data to a personal computer.
Measured flow is continuously accrued to lung volume by digital integration. Independent of the size and cost of any pulmonary function device, from a handheld peak flowmeter to a body plethysmograph, the flow sensor always represents the core element (Fig. 8.2).
8.1.2 Technology While closed systems such as the bell or wedge spirometer were still in use two to three decades ago, only open systems will be found today, offering smaller footprint and size, higher precision, and more comfortable and hygienic conditions for the patient. In an open system the patient breathes from and to the ambient air through a sensor, which in case of more advanced testing can be connected to one or more valves. The spirometer detects the flow rate from the sensor and digitally integrates flow to volume � V = V˙ dt (l) , where V denotes the inspired or expired volume, and V˙ = dV/ dt (l/s) is the measured flow. Figure 8.3 depicts a typical pneumotachogram (flow over time) and the resulting spirogram (flow integrated volume). The recording of breathing traces and the calculation of derived parameters are usually performed by an integrated microprocessor or a personal computer.
Pulmonary Function Testing
97
Fig. 8.2 Pneumotachograph (ndd Medizintechnik, Zurich, Switzerland)
Part B 8.1
Measuring Range When testing adults, the physiologically relevant flow range should reach from 25 ml/s to 10 l/s, optimally from 10 ml/s to 15 l/s, requiring a resolution of 5–10 ml/s. These conditions impose very demanding technical specifications on flow sensors. For precise detection of the first part of the forced exhalation, a linear frequency response of up to 5 Hz is required in the flow sensor characteristics. Verification and Calibration To verify the accuracy of a flow sensor and if needed to calibrate it, an optional verification and calibration routine should be implemented in any spirometer. Both verification and calibration are carried out by means of a manual or motorized pump of known volume of at least 2 l. When activating the calibration pump connected to the flow sensor, the spirometer will read integrated instantaneous flows. At the end of a full stroke, the spirometer should display a flow integrated volume identical to that of the pump. As digital integration can be assumed to be sufficiently precise, any deviation in volume will indicate the error in flow measurement. By moving the piston at varying speeds, flow rates between −10 l/s and +10 l/s can be simulated, covering most of the physiological flow range. Any deviation between a stroke volume resulting from low flow rates versus that produced at high flow rates will indicate a nonlinearity in the flow sensor or spirometer circuitry. Today, most spirometers offer a calibration program facilitating the calibration routine. Averaging over a given number of pump strokes, the deviation from the correct volume is displayed, and a correction factor will be considered in future measurements. Verification and calibration must be carried out without regard of body temperature pressure saturated (BTPS) correction (see later), as pump volume is measured at ambient not at lung conditions. In recent years, disposable spirometer sensors have become common. Even if these sensors are precalibrated or calibration data are read into the spirometer, a verification routine should be available to allow for quality assurance. The same applies to the newer digital sensor systems which are advertised as calibration free. Nevertheless, accuracy and linearity should be verified at reasonable intervals. The American Thoracic Society (ATS) and European Respiratory Society (ERS) have issued recommendations [8.1, 2] mandating testing of spirometers by independent laboratories prior to market release. By subjecting production models to a battery of tests,
8.1 Spirometry
V (l/s)
Pneumotachogram
Inspiration
Fig. 8.3 Comparison of
pneumotachogram and spirogram
Expiration t V (l) Inspiration
Spirogram Expiration
t
manufacturers can document the overall performance of their spirometers to the user. Test laboratories employ motorized, processor-controlled calibration pumps producing standardized flow–volume loops, able to simulate a wide range of clinically relevant flows. This testing procedure is part of the obligatory premarket registration procedure in the USA [Food and Drug Administration (FDA) approval]. One can assume that spirometers which are also sold in the USA fulfill these requirements. Before purchasing a spirometry device, documented compliance with the recommendations of the ERS and ATS spirometry standards [8.1, 2] should be requested from the manufacturer or supplier. Hygiene Cross-contamination is an ever-present risk in spirometry. To effectively avoid the risk of infection in patients
98
Part B
Functional Diagnostics Devices
Part B 8.1
or individuals tested with the same spirometer, suitable preventive measures should be instituted. In case the flow sensor is a fixed installation which cannot easily be exchanged, a disposable breathing filter is indispensable. Like the sensor itself, the breathing filter must have a low resistance, minimizing any hindering effect on breathing. Usually the flow sensor can be exchanged and replaced by one that has been cleaned and sanitized. In regular clinical testing, sensors do not need to be sterile; disinfection according to manufacturer’s recommendations is sufficient. Many modern spirometers incorporate disposable sensors, favorably combining adequate hygiene with ease of use. As single-use sensors should not cost much more than a good breathing filter, their design is a contradiction in terms of low cost versus good performance (in accuracy and resolution, see above). In this regard a disposable item that is not part of the sensor itself may be advantageous, as it ensures hygiene while not affecting accuracy. The ERS has published recommendations concerning the resistance of spirometry sensors and breathing filters, calibration, and hygiene of spirometers [8.2]. Conversion to Body Conditions An open system requires conversion of measured flow and integrated volume from ambient to lung or BTPS conditions (37 ◦ C, 760 mmHg, 100% relative humidity). The conversion needs to correct inspiratory and expiratory flows and volumes separately. While, during inspiration, 1 l of ambient air expands to about 1.1 l of lung air due to heating and humidification, 1 l of lung air will shrink during expiration to about 0.97 l
at the sensor, both corrections depending on the sensor type and the geometry of the mouthpiece. Without BTPS correction, substantial errors in the range of 10% in flow and volume parameters may occur. Conversion formulae can be found in [8.2]. In all commercially available spirometers, conversion to BTPS conditions is implemented, automatically correcting data to BTPS conditions. In Table 8.1, the measuring principles of currently commercially available flow sensors, their pros and cons are presented. Differential Pressure Flowmeter The classical method to measure respiratory flow consists in the acquisition of the differential pressure ( p1 − p2 ) in a flow tube where a resistive element is inserted. The type of the resistor characterizes the sensor principle, and usually it will lend its name to it. As the airstream leaving the trachea and mouth is turbulent, a short tube or a breathing filter should be inserted between the flow sensor and the mouth, acting as a flow rectifier to laminarize the flow pattern before entering the sensor. Only laminar flow will provide a pressure drop across the resistor which is proportional to flow rate. Depending on flow direction, the differential pressure across the resistor will be positive (expiration) or negative (inspiration). The pressure is picked up by a pressure transducer and converted into an electrical and/or digital signal. All flow-measuring devices based on differential pressure transducers are sensitive to baseline instability. Even the smallest asymmetry in the transducer leads to a drift in the flow
Table 8.1 Types of flow sensors Type
Pros
Cons
Pneumatachograph according to Fleisch
Proven measuring principle, durable
Pneumatachograph according to Lilly
Turbine flowmeter
Proven measuring principle, durable, cleaning possible Proven measuring principle, durable, lightweight, simple cleaning Small, lightweight sensor
Several sensors for different flow ranges required, sensitive to contamination, difficult to clean, frequent calibration required Sensitive to contamination, calibration required Calibration required
Hot-wire anemometer
Offers good accuracy
Vortex flowmeter
Simple sensor construction
Ultrasound flowmeter
Simple sensor construction, small, lightweight, high accuracy, calibration free
Diaphragm pneumotachometer
Frequent cleaning and calibration required Simple anemometer not accurate, calibration required Not proven in routine testing, only unidirectional, difficult to calibrate
Pulmonary Function Testing
8.1 Spirometry
99
Capillaries = Resistor
Inspiratory
Breathing flow
V
Expiratory P1
Part B 8.1
Mouthpiece
P2
Δp
Pressure transducer
Integrator
∫V dt = V
0
Flow signal
Volume signal
V
Fig. 8.4 Pneumotachograph according to Fleisch (schematic)
signal and consequently to a drift in volume. Even rather minimal flow drifts can – over time – integrate into appreciable volume offsets. To avoid this effect, a flow range around baseline needs to be defined in which no flow integration takes place (dead zone). As flows at the end of expirations can be rather small but are of diagnostic significance in obstructive disease, the dead zone should be kept as small as possible and may not exceed 10–15 ml/s. The Fleisch Pneumotachometer Until the 1980s, the pneumotachometric principle according to Fleisch was the most widely used flowmeter in PF testing, also called the Fleisch pitot tube (Fig. 8.4). The sensor consists of a bundle of capillaries, typically a roll of z-folded sheet metal acting as a fixed resistor. The bulk of flow is subdivided into small threads of flow, laminar over a certain range. The pressure difference along a capillary can be derived by applying the Hagen–Poiseuille law, which in case of laminar flow yields
Δ p = c · V˙ =
8ηl V˙ , r4
where c is a constant dependent on the gas viscosity and sensor geometry, l is the length of the sensor tube, r is the radius of the sensor tube, η is a viscosity constant, and V˙ is the flow rate. In the Fleisch tube, linearity between pressure difference and flow rate is attained by use of a large
number of bundled capillaries. As long as mechanical signal recorders were used, linearity in flow assessment was required to allow for direct reading of the flow rate from the trace. Today, due to fast digital online processing, also nonlinear sensor principles can be implemented for flow determination and recording. Despite the use of modern technology, sensor calibration and accuracy need to be checked regularly. Since the Fleisch tube and all other pneumotachographs employing some type of resistor are directly exposed to the exhaled air, sputum, even a small droplet, may change the resistance, leading to considerable errors in indicated flow rate. Therefore, a bend is inserted between the mouth and sensor both to retain sputum droplets and to laminarize the airstream. Alternatively, a disposable air filter can be inserted to avoid contamination and safeguard hygiene (Sect. 8.1.2). The Lilly Pneumotachometer Over a tube restriction, a pressure drop proportional to flow can be registered, up to a Reynolds number of ≈ 10. This relation also holds when a combination of restrictors, such as a close-mesh screen, single or in a series, characterizes the flow sensor. An essential feature of this design is the large difference between tube and mesh diameter. In practice, a layer of several sieves improves the linearity of the flow measurement but increases the breathing resistance, which needs to be considered.
100
Part B
Functional Diagnostics Devices
Part B 8.1
Diaphragm Pneumotachometer In this type of flowmeter a specially slotted foil diaphragm is employed, acting as the resistor. A pressure drop across the diaphragm will occur, being either proportional to flow over a certain range or needing linearization over a larger range. Depending on design, the diaphragm will exhibit a larger differential pressure at lower flows, an overproportionally smaller pressure difference at higher flows. Certain applications, such as exercise testing or intensive care measurements, may benefit from such varying resolution. The diaphragm is less prone to humidity and contamination by sputum and may be cleaned more easily. Turbine Flowmeter A turbine or propeller built into the flow tube characterizes this sensor, which is also called a digital volume transducer. Excited by the passing gas flow, the rotating elements interrupt or reflect the light from a light-emitting diode (LED). Photodiodes register the rotations, returning an electrical impulse frequency proportional to flow, while the total count is proportional to volume. To minimize inertia, the turbine bearing resistance and turbine mass have to be as small as possible. Contemporary turbine flowmeters can be dismantled easily for cleaning. Hot-Wire Anemometer This sensor consists of a Venturi tube in which two hot wires are installed, linked in an electric bridge circuit (Wheatstone bridge). While one wire, consisting of two types of platinum, senses gas temperature,
Transducer 1
t1 Gas flow
d t2 T
Transducer 2
Temperature
Fig. 8.5 Working principle of an ultrasound flowmeter (ndd Medizintechnik, Zurich, Switzerland)
the other measures the heat flux into the passing gas. Temperature-corrected heat flux is proportional to gas flow. A more modern version of this principle, the socalled mass flowmeter, is able to measure the amount of gas molecules passing the hot wire, featuring independence from gas temperature and mixture or viscosity. Vortex Flowmeter The phenomenon of fluid vortices was already described by Leonardo da Vinci as early as 1518. Vortices are usually caused by waves meeting a resistance in flow. In a vortex flowmeter the air flow is channeled towards a resistive element, the so-called bluff body, where vortices occur. The type and extent of vortices formed depend on the flow velocity. The number of vortices can be evaluated by different technologies: piezoelectric elements, thermistors, or optodes. The vortex flowmeter can only detect unidirectional flow and needs an independent sensor, such as a pressure sensor, for detection of flow direction. Therefore, this principle finds only limited acceptance in spirometry. Ultrasound (Transit Time) Flowmeter This method (Fig. 8.5) is based on the determination of transit times of acoustic waves traveling through a flowing medium. The velocity of acoustic waves across a flow tube increases at the same rate as the velocity of air in that tube. Three technical realizations exist:
1. Continuous phase shift analysis, where the phase shift of a continuously generated ultrasound signal is determined. 2. Impulse phase shift, where the phase shift between sinusoidal ultrasound waves is measured. 3. Time-of-flight impulse, where the transit time of the ultrasound traveling between a transmitter and receiver is determined. While the principle of determining phase shifts has not been commercialized in medical technology, the time-of-flight method [8.3] has been successfully introduced in spirometry, with wide acceptance in clinical practice and epidemiology. The sensor technology employs two ultrasound elements which are built into the sensor housing and placed oblique to the airstream in a flow tube. Alternating ultrasound impulses are emitted in both directions, and their transit times across the tube are measured. While transit times are shorter downstream, they are longer upstream. The difference in transit time is proportional to the flow velocity, independent of any other variable such as gas tempera-
Pulmonary Function Testing
Peak Flowmeter For monitoring obstructive diseases such as asthma and for analyzing therapy response, peak flowmeters play an important role, in particular for home use. The classical mechanical peak flowmeter consists in a piston moving in a scaled flow tube. A forced expiration moves the piston up the vertically held tube, allowing a reading of maximum peak expiratory flow (PEF) in units of l/min or l/s. More modern peak flowmeters implement one of the above-mentioned measuring principles, most often turbines. Usually they offer electronic signal processing, display of results, memory and diary function, as well as data logging through a modem or the Internet. When applied over a longer period of time, verification and calibration of PEF meters should be warranted.
8.1.3 Methodology of Spirometry Lung-Volume Subdivisions Pulmonary gas transport depends on the filling capacity of the lungs with breathing gas and the speed and uniformity of gas distribution. Markers of lung filling are the lung-volume subdivisions, which are measured at slow breathing, while flow rates are of minor interest. When two or more volume subdivisions are combined, lung capacities result. The most important role in PF testing is played by vital capacity (VC), the volume of complete inspiration (IVC) or slow expiration volume (EVC), both directly accessible by spirometry. At the end of a deep expiration, residual lung volume (RV) remains in the lungs, which can be determined by gas dilation methods (Sect. 8.2.4) or body plethysmography only (Sect. 8.2.2). Consequently, the sum of VC and residual volume (RV) determines the volume at the end of a complete inspiration and is called the total lung ca-
101
pacity (TLC), an important measure of maximum lung volume. Vital capacity consists of the subdivisions:
• • • •
Tidal volume (VT ), the volume ventilated during a regular breathing cycle Expiratory reserve volume (ERV), the volume that can be exhaled from breathing baseline, i. e., at the end of a regular breathing cycle Inspiratory reserve volume (IRV), the volume which can be inhaled above the inspiratory breath of a regular VT cycle Inspiratory capacity (IC), i.e., the sum of VT and IRV.
As for TLC and RV, the functional residual capacity (FRC), being the sum of RV and ERV, can be determined by more elaborate methods only (Sect. 8.2). As determination of lung-volume subdivisions is time consuming and diagnostically less significant, subdivisions will be evaluated in combination with the more relevant FRC. For standardization of lung volume testing refer to [8.4]. Forced Spirometry Of the diagnostic arsenal of internal medicine, dynamic lung volumes, in particular forced vital capacity and forced expiratory volume in the first second (FEV1 ), are considered essential parameters. Forced expiration not only delivers important information about an existing pulmonary obstruction in the sense of reduced airway diameter but may also indicate a loss in lung retraction, parallel to diminished lung elasticity and enhanced airway instability. Reduced elasticity mirrors the loss of functional tissue structure, resulting in reduced surface area for gas exchange and accompanied by a high demand in ventilation at reduced maximum oxygen uptake. In contrast to the predominantly practiced forced expiration, forced inspiration can be used for differential diagnosis of extrathoracic obstruction, e.g., tracheal stenosis. Being technically less demanding, the recording of a forced spirogram prevailed traditionally; today the flow–volume loop is registered together with the spirogram. The time-based spirogram offers observation of expiratory time, typically 3 s in a healthy subject but maybe as long as 10–20 s in an obstructed patient. As the forced spirogram represents the shape of an exponential function, analysis of its form requires a certain understanding of the underlying pulmonary
Part B 8.1
ture, viscosity or humidity. In a commercially available ultrasound flowmeter a disposable breathing tube is employed, featuring sealed windows across from the ultrasound elements. While the windows are transparent to ultrasound, germs cannot pass, effectively avoiding cross-contamination. In addition to being calibration free, this sensor design also has the advantages of high accuracy and total hygiene. While the difference in transit time yields the flow, the sum of the transit times is directly related to the molar mass, the molecular or specific weight of the breathing gas, allowing instantaneous reading of the specific weight of the gas passing through the sensor. During expiration, the molar mass changes according to the composition of the exhaled gas, similar to a CO2 waveform (Sect. 8.1.4).
8.1 Spirometry
102
Part B
Functional Diagnostics Devices
Table 8.2 The most important parameters of the forced spirogram and flow–volume loop
Part B 8.1
Parameter
Unit
Description
FVC FEV1 FEV1/FVC FEVt PEF FEF25-75 FEF25 FEF50 FEF75 MTT FIV1 FIF50
l l % l l/s l/s l/s l/s l/s s l l/s
Forced vital capacity Forced expiratory volume in 1 s FEV1 in % of FVC or relative FEV1 e.g., FEV0.5, FEV2, FEV3 Peak expiratory flow Mean forced expiratory flow between 25% and 75% of FVC Forced expiratory flow when 25% of FVC has been expired Forced expiratory flow when 50% of FVC has been expired Forced expiratory flow when 75% of FVC has been expired Mean transit time Forced inspiratory volume in 1 s Forced inspiratory flow at 25% of FVC
mechanics. In contrast, the flow–volume loop represents a linearization of the exponential expiratory decay, as an exponential and its derivative are recorded against each other. In a healthy person the rise to peak flow is steep, while the decay is (quite) straight. The very obvious deviation from a straight line towards a concave shape means a reduction in flow, which is easy to interpret. Table 8.2 presents the most important parameters of the forced spirogram and flow–volume loop. The list of parameters derived from forced expiration could be extended (almost) endlessly. Beside the numerical evaluation of the flow–volume loop, attention should be drawn to the analysis of its shape (Fig. 8.6). Documentation Online recording and evaluation of the flow–volume loop has become a gold standard in basic pulmonary function testing. When testing a patient, several trials should be registered to assess cooperation and repeatability. Loop tracings should be recorded with sufficient resolution. The aspect ratio, i.e., the flow versus volume scaling, is of importance for form analysis, e.g., in pre/post broncholytic drug medication, and should be fixed to pronounce the difference between a healthy and an obstructive loop. Practical Considerations The quality of most pulmonary functions tests, in particular forced expiration, depends on the cooperation of the test subject and the (incentive) instructions of the operator. After preparing the spirometer, verification or calibration, and insertion of a new mouthpiece or breathing filter, the testing procedure is explained to the subject. Before and during spirometry, breathing maneuvers are further supported by the operator, and the
subject should be motivated to maximize forcing efforts and exhale completely. The subject, wearing a nose clip, should be able to breathe free and unhindered through the mouthpiece and should be encouraged to practice before recording starts. All tests should be carried out in the same body position, generally sitting. In screening and industrial testing, also a standing position is adequate. In children and seniors, use of a mouthpiece with a sealing lip is recommended. A smaller, pediatric mouthpiece should be applied in children. Unless disposable flow sensors are used, a disposable filter attached to the sensor is mandated, both as a hygienic requirement and a preventive measure to avoid intrusion of sputum into the flow sensor. Both the ERS and ATS have issued recommendations in which at least daily volume calibration using a calibration syringe is mandated. In a calibration-free device, volume verification should be carried out at least once a month. Slow Vital Capacity and Volume Subdivisions Instructions The subject breathes at resting baseline. After a couple of breaths, the operator gives instructions for a slow, continuous, maximum inspiration followed by a slow, maximum expiration, followed again by a complete inspiration. The cycle should be repeated again. Parameters from repeated tests should not deviate by more than 5%. Forced Spirometry and Flow–Volume Loops Instructions Breathing at resting baseline, the subject is instructed to inhale completely and exhale as hard and as long as possible. This procedure should be repeated at least twice.
Pulmonary Function Testing
a) Normal loops Good cooperation
8.1 Spirometry
103
b) Obstruction No forced expiration
No maximum expiration
Expiration
Part B 8.1
Flow (l/s)
Inspiration
e) Stenosis c) Restriction
Intrathoracic tracheal stenosis
d) Emphysema
Fixed extrathoracic stenosis
Fig. 8.6a–e Typical flow–volume loops: (a) normal, (b) obstruction, (c) restriction, (d) emphysema, and (e) stenosis
Breathing maneuvers need to be instructed clearly; especially the forced exhalation should be supported by incentive commands. For evaluation, maximum forced flow rates (FEFs) are picked from the recording. Contemporary software programs offer warnings to the operator in case quality standards (ERS, ATS) are not met. Either best values are taken from all forced traces or the trace with the highest sum of FVC and FEV1 is considered for analysis. Several errors may occur: Poor cooperation of the test subject may lead to a late or low PEF (Fig. 8.6a). In general, low FEFs may result in case no nose clip is worn or the lips did not entirely seal the mouthpiece. Deformation of loops and traces may result from coughing or swallowing. If no FEV1 is given, exhalation was too short or interrupted. Varying loops indicate poor instruction and motivation. With good cooperation, all forced flow–volume loops should superimpose adequately. After analyzing the results of forced spirometry, a first classification into normal, obstructive, or restrictive findings can take place (Fig. 8.6a–e). In frequently evidenced obstructive disturbances, even the severity can be assessed. Predicted Values Evaluation of spirometry testing is carried out by comparing measured data with predicted norms or reference
data, derived from body weight, height, age, and gender. Predictions are calculated from equations published and recommended by scientific societies. When comparing measured with predicted values, the standard deviation, an indicator of the variation of the tested parameter in a healthy population, needs to be taken into consideration. The determination of the residual R R=
M−S SD
is recommended, where M is the measured value, S is the predicted value, and SD is the standard deviation, allowing comparison with a distribution in the reference population and detection of significant deviations. The leading international societies, the ERS and ATS [8.5], have issued predicted formulae, mostly derived from Caucasian populations. These European and North American predicted values do not substantially differ from each other. When assessing pulmonary function in other ethnicities, predictions of national societies or other scientific sources should be used, or at least a percentage adaptation of Caucasian predicted values be considered. Most processor-based test devices are equipped with different sets of prediction formulae that can be selected by the operator. The user manual should give the national background and literature references of the predicted sets.
104
Part B
Functional Diagnostics Devices
Besides reporting measured, predicted, and percentage values, spirometry reports should contain a marker for significant deviation from certain limits, such as the standard deviation. Testing in children and adolescents requires a set of pediatric formulae.
Part B 8.1
8.1.4 Cooperation-Free Pulmonary Function Tests For more than half a century spirometry has been a valued clinical tool and its importance has been documented in numerous publications. Forced spirometry can predict mortality better than smoking habits, existing cardiovascular morbidity, blood pressure, or gender [8.6]. As valuable as forced spirometry findings may be, it is often difficult to attain and ensure cooperation in subjects. Even well-equipped pulmonary function laboratories with well-trained staff will soon reach their limits when addressing and motivating children, geriatric or foreign-language patients. In former times, cooperation-free tests were postulated mostly for pediatric departments and epidemiological and screening studies. More recently, the cataclysmic demographic changes accompanied by a dramatic increase in the senior generation underline the urgent necessity of suitable tests. Although FEV1 and FEV1 /FVC% are a recognized gold standard for detecting and assessing obstructive disease, more appropriate, more specific parameters might be available, correlating well with dyspnea (shortness of breath). Therefore, new, (almost) cooperation-free methods have been developed during the recent years, some of which are still pending commercial release. The next section gives an overview of proven and new developments in this area. Ultrasound Pneumography In Sect. 8.1.3, the ultrasound flowmeter was described and its ability mentioned to measure molar mass, the molecular or specific weight of the breathing gas, derived in real time from the sum of transit times – at no additional expenditure. While ambient air is inhaled through the sensor, the molecular weight changes during expiration as oxygen content drops and carbon dioxide increases (O2 has much lower density than CO2 ). When molar mass is registered during expiration, its waveform resembles that of CO2 . In fact, ultrasound pneumography (UPG) makes use of the scientific expertise gathered over decades of clinical research in expiratory CO2 waveform analysis. The former approach of complicated synchronous recording
Fig. 8.7 Ultrasound pneumography in a child (ndd Medizintechnik, Zurich, Switzerland)
of spirometry in combination with fast gas analysis, mostly by demanding mass spectrometry, can be replaced by instantaneous and genuinely synchronous measurement of flow, volume, and molar mass in UPG. Although the determination of molar mass is complicated by the dependence on temperature and humidity, recent research indicates the clinical validity of native molar mass derived directly from uncorrected ultrasound transit times. The subject performs regular tidal breathing into the ultrasound sensor, without the need for any special breathing maneuvers (Fig. 8.7). Molar mass waveforms are averaged and analyzed, containing information about pulmonary gas distribution. Clinical studies [8.7, 8] confirm a high correlation with FEV1 and FEV1 /FVC% as well as the degree of obstruction. Resistance Measurements Forced Oscillation Technique. Applied in various
forms since the 1970s, this testing principle combines a flowmeter, an inserted resistive element, a pressure transducer, and an oscillation generator (loudspeaker) [8.9, 10]. Low-amplitude (forced) pressure oscillations by the loudspeaker are superimposed on the patient’s tidal breathing, resulting in a phase shift orig-
Pulmonary Function Testing
been cleared with the advent of modern commercial instruments. However, technical complexity and cost still exceed that of conventional spirometry equipment. Monofrequent Oscillatory Resistance Measurement.
This much simpler version of the forced modality has been proven clinically over decades [8.12]. Instead of a loudspeaker a small sinusoidal pump is used, generating small pressure swings superimposed on the patient’s tidal breathing. Analysis of measured data again results in a phase diagram of resistance and reactance. In clinical practice, however, correlation with FEV1 is just adequate, offering lower specificity and therefore only serving as an orientation or screening tool.
8.2 Advanced Cardiopulmonary Function Testing 8.2.1 Overview In contrast to simple spirometry, advanced cardiopulmonary function testing requires a much higher level of methodology, instrumentation, and staff. This may be the reason why advanced testing can be found predominantly in internal and pulmonary departments of hospitals and specialized practices. Nevertheless, slow and forced spirometry will always remain the foundation of any type of pulmonary function instrumentation, particularly in all more complex or advanced pulmonary devices. Among the more demanding modalities, body plethysmography takes a prime position, efficiently combining measurement of lung-volume subdivisions and airway resistance. Diffusion testing according to the single-breath method and determination of functional residual capacity (FRC) by N2 washout are sometimes
105
preferred in English-speaking countries. Historically, closed systems with gas dilution methods were widely applied for FRC studies but have been replaced by more hygienic devices. Besides the before mentioned, an array of more or less complex modalities can be found but without broad clinical acceptance. An overview of the most important methods is given in Table 8.3. Finally, cardiopulmonary stress testing or ergospirometry, investigating gas exchange under physical exercise, has (in combination with ECG) become an important tool in assessing and differentiating ventilatory and cardiac disturbances. Especially in medical opinions and ratings, e.g., regarding compensation claims, this objective method allows global appraisal and staging of performance reductions in cardiopulmonary disease. During recent years, the interest in continuous measurement of physical activity and metabolic monitoring
Table 8.3 Procedures and parameters in advanced pulmonary function testing Procedure
Main parameters
Derived parameters
Body plethysmography
Intrathoracic gas volume (IGV)
FRC, RV, TLC
Body plethysmography
Airway resistance RAW
G AW , sRAW , sG AW
Compliance determination
Static compliance Cstat
Pmi
Compliance determination
Dynamic compliance Cdyn
Work of breathing
Airway occlusion test
p0.1 , pmax
Single-breath diffusion test
Transfer factor TLCO
K CO , VA , TLCSB
Single-breath test with O2
Membrane factor DM
Capillary blood volume Vc
Intrabreath diffusion test
Co-diffusion DLCO
Cardiac output Q c
N2 washout test
FRC
RV, TLC, distribution
Part B 8.2
inating from the respiratory tract. Resulting flow and pressure signals are differentiated from the originating patient signals, independent from the patient’s breathing pattern. The analysis yields impedance Z rs with its components, resistance R and reactance X, which can be plotted in a frequency diagram. Today, this technique is most often found in a variation called impulse oscillometry, applied in geriatric, pediatric, and industrial medicine as well as in drug studies. This method, only requiring passive patient cooperation, i. e., tidal breathing at a mouthpiece, can complement standard pulmonary testing modalities and is suited for screening of obstructive disease [8.11]. Previous concerns about its technical complexity and limited hygiene have
8.2 Advanced Cardiopulmonary Function Testing
106
Part B
Functional Diagnostics Devices
Part B 8.2
has seen a tremendous rise. Practically all medical disciplines, from rehabilitation of obstructive patients to dementia prophylaxis, have recognized and published the invaluable importance of physical activity for improving, rehabilitating from, and particularly preventing disease. Despite a host of technical innovations facilitating its application, ergospirometry remains a demanding procedure in regards to test equipment, duration, and evaluation. This may be the reason why much more inexpensive portable devices have been developed for activity monitoring. Medical technology, as a part of the information technology (IT) industry, undergoes the same fast-paced cycles in innovation and cost reduction that the microelectronics mass market exhibits. In the mid 1970s a computerized body box, as a body plethysmograph is called colloquially, sold for about €100 000. Today, almost 40 years later, a more operator friendly, even more accurate device can be purchased for less than €15 000. Practically all commercial instruments incorporate microelectronics, and a PC or notebook, most often implementing software under a certain operating system, featuring networking capabilities and data exchange to a hospital information system, together simplifying operation and enhancing laboratory productivity.
8.2.2 Body Plethysmography Physical and Methodological Principles A body plethysmograph, also called a whole-body plethysmograph or body box, consists of an airtight chamber, similar to a sealed phone booth, in which the patient is seated (Fig. 8.8). The thoracic movements created by the patient’s breathing are transferred into volume and pressure swings inside the enclosure, which are measured and evaluated. The foundations of modern body plethysmography, originally published by DuBois in the USA [8.13, 14] and Ulmer et al. in Germany [8.12], reach back to the 1950s, historically differentiating so-called constantvolume and constant-pressure modes. Applying the latter, the test person is seated in a chamber, breathing through a tube from and to the outside air, causing total thoracic volume displacements inside the enclosure. Today, virtually all commercially available body plethysmographs implement the constant-volume measuring principle, which seems to be technologically less demanding and clinically more reliable. In constantvolume mode, the subject breathes chamber air through a flowmeter and a fast-acting shutter valve. The goal of body plethysmography lies in the determination of (mean) alveolar pressure caused by compression
Fig. 8.8 Body plethysmograph (CareFusion 234, Höchberg, Germany)
Pulmonary Function Testing
Determination of Intrathoracic Gas Volume When breathing against the shutter at the mouth, a thoracic volume change takes place, causing an alveolar pressure swing, as long as pressure equilibration between mouth and alveolar space can be assumed. When registering mouth pressure against box pressure during shutter closure, the (linear) relation between mouth pressure and box pressure can be established. This ratio of alveolar pressure to thoracic volume also enables the calculation of lung volume at the time and level of shutter closure, which is called the (intra-)thoracic gas volume (ITGV or IGV). pK (l) , ITGV = kα · pM where pK is the chamber pressure, pM is the mouth pressure, and kα is a constant that depends on the chamber volume, the body volume of the subject, and the barometric pressure. When, during tidal breathing, the shutter is triggered at the end of a normal expiration, the ITGV corresponds to the functional residual capacity (FRC). Determination of Airway Resistance The so-called airway resistance loop can be graphed when the box pressure is registered against flow at the mouth during tidal breathing (Fig. 8.10). According to Ohm’s law,
U = R· I
or
palv = RAW · V˙ (hPa) ,
pm
S PT
V VL
pk
PT VL EV V pm pk S CP L
pneumotachograph lung volume equilibration vessel flow mouth pressure chamber pressure shutter chamber calibration pump defined leak
L CP
EV
Fig. 8.9 The volume-constant plethysmographic principle
from which airway resistance (RAW ) can be derived as � � palv pK hPa , RAW = = kβ · l/s V˙ V˙ where palv is the alveolar pressure, V˙ is the flow at the mouth, pK is the chamber pressure, and kβ is a factor comprising mainly the ratio of mouth over chamber pressure established during the shutter manoeuvre. Technical Characteristics of Body Plethysmography In tidal breathing, the chamber pressure changes are fairly small, only a few hPa (or cmH2 O). Disturbances caused by a patient-related temperature increase within the chamber (body heat), by breathing-related air temperature and humidity changes, and by pressure changes related to external pressure variations, to mention just a few, can be significant and may accumulate to an error greater than the sensed measuring signal. To attain adequate pressure equilibration between mouth and alveolar space, panting during the shutter maneuver should be avoided [8.15]. The construction characteristics of the body plethysmograph chamber are essential to ensure good measuring quality. Some of these features are:
• • • • •
Rigidity of the enclosure Heat transfer characteristics of the chamber walls Built-in equilibration vessel BTPS compensation Calibration unit
107
Part B 8.2
and decompression of gas volume entrapped in the thorax. Note that this method captures the (small) compressible volume which, according to Boyle’s law ( p · V = const), is proportional to alveolar pressure. Simultaneously with the compression of lung volume and the corresponding decompression of chamber volume, the alveolar pressure generates a flow and consequently a volume, which is measured at the mouth by the flowmeter. Thus, the thoracic movement causes a volume and proportional pressure change inside the lung, which is reflected by an identical volume and, again according to Boyle’s law, a proportional pressure swing inside the chamber (Fig. 8.9). In a procedure colloquially called box calibration the proportionality factor between chamber volume change and chamber pressure change is determined. Usually a small motorized pump is built into the enclosure, generating a constant stroke displacement, e.g., 50 ml, which is registered as a pressure swing. Calibration of the chamber is typically stable and does not require frequent checks.
8.2 Advanced Cardiopulmonary Function Testing
108
Part B
Functional Diagnostics Devices
Fig. 8.10 Screenshot of
Part B 8.2
a body plethysmographic test including airway resistance and shutter loops (Ganshorn Medizin Electronic, Niederlauer, Germany)
• •
Adjustment of a defined leak Type and speed of the shutter assembly.
The following remarks, although not exhaustive, should be made in this context. The enclosure should be constructed in a shape and from materials which ensure solid rigidity and fast heat transfer of the temperature rise caused by the patient. An equilibration vessel for common mode rejection of externally transmitted pressure artifacts should be built into the enclosure (Fig. 8.9). An automatic box calibration pump for dynamic simulation of thoracic volume compression and an adjustable defined leak (pneumatic low-pass filter for drift compensation) are indispensable for quality assurance. In a modern box, pressure- and flow-related BTPS compensation is carried out digitally. The resistance of a breathing filter must be considered when airway resistance is determined. If the above-mentioned peculiarities are accounted for, body plethysmography can be implemented into clinical routine efficiently, offering fast and stable test results. Technical service requirements for a body plethysmograph enclosure are relatively few. Except for mouthpieces and breathing filters, no other disposable
material is needed. Improving hygienic requirements, modern shutter assemblies can be disassembled easily. Use of breathing filters is recommended. A complete body plethysmographic evaluation of a patient, including repeated determination of resistance and ITGV, will take about 15 min, and in combination with spirometry determining lung-volume subdivisions, less than 30 min. Clinical Value of Body Plethysmography As described above, body plethysmography offers determination of airway resistance and intrathoracic gas volume in a single testing procedure. Fairly independent from patient cooperation, the test can be repeated several times, representing a truly fast and efficient modality to measure the most important parameters of pulmonary function. The full spectrum of relevant pulmonary diagnostic information can be assessed by body plethysmography when combined with slow and forced spirometry and recording of flow–volume loops, which can be carried out while the enclosure door remains open, and with testing of other parameters, such as lung compliance or diffusion transfer factor, in case an additional diffusion assembly is built in.
Pulmonary Function Testing
Intrathoracic Gas Volume/FRC Besides FRC, intrathoracic gas volume comprises all gas compartments compressed during the shutter maneuver, also trapped air in the lungs as well as abdominal gas. This method is certainly false positive in highly obstructive patients when pressure equilibration between mouth and alveolar space cannot be attained. In contrast, the dilution and foreign gas methods will be false negative, underestimating lung volume, which tends to increase in the presence of severe obstruction. Because of its accuracy and high reproducibility, body plethysmography is considered a gold standard in lung volume assessment. Combining ERV and VC obtained during spirometry with ITGV/FRC, all volume subdivisions including RV and TLC can be determined in one sequence.
8.2.3 Diffusion Capacity
ter a deep exhalation, the patient inhales a gas mixture of air, 0.2–0.3% CO, and a low concentration of an inert gas, usually helium or methane. At full inspiration, the patient holds his breath for ≈ 10 s, allowing the gas mixture to distribute in the alveolar space. While the inert gas resides in the lung, CO will pass the alveolar–capillary membrane into the blood. After the breath-holding period, the patient exhales, and the first part of the expired air is discarded, while the center part is collected (Fig. 8.11). In more modern devices featuring fast gas analysis, the gas is analyzed continuously, and the gas concentrations of the center part are averaged. In both cases the center part is considered representative as an alveolar sample. The inert gas, not taking part in gas exchange, is diluted in the lung, characterizing the ventilatory distribution. Assuming that CO is diluted at the same rate as the inert gas, the diffusive part of the CO concentration can be estimated. The transfer factor is determined by applying an exponential decay model of alveolar CO concentration during the breath-holding period. If the initial capillary CO concentration is assumed to be zero, the transfer factor can be derived as � �� � VA FACO0 mmol · ln , TLCO = b · tv FACO min · kPa where FAX . FIX FI is the inspiratory gas concentration, FA is the alveolar concentration of the expiratory gas sample, X is an index representing the inert gas, FACO0 is the initial alveolar concentration of CO, VA is the alveolar volume, tv is the breath-holding time, and b is a constant for conversion of dimensions. Besides TLCO , the alveolar volume VA can be calculated from the dilution of the inert gas by using the same data as above, i.e., � � FIX (l) , VA = (VIN − VD ) FAX FACO0 = FICO ·
Gas exchange between alveolar space and capillary blood, i. e., the transfer of gas over the alveolar– capillary membrane, is called pulmonary diffusion. The diffusion capacity of a gas is defined by the amount of gas per unit of time exchanged over the membrane and the partial pressure difference between gas and blood phase. As the oxygen capillary partial pressure is inaccessible to noninvasive testing, the diffusion capacity of oxygen cannot be assessed. Instead, the diffusion capacity for carbon monoxide (CO) is measured. Only low concentrations of CO in the ppm range are added to the inspiratory air, as CO has high affinity to hemoglobin and patient exposure to CO should be minimized.
where VIN is the inspired volume prior to breath holding and VD is the dead space volume consisting of anatomical and apparatus dead space. All volumes are reported in BTPS. Combining spirometry with VA , RV and TLC can be derived.
Single-Breath Method For decades the single-breath method, originally developed by Cotes [8.17], has found broad acceptance. This modality does not assess diffusion capacity itself but the so-called transfer factor for CO (TLCO). Af-
Technical Characteristics of the Single-Breath Method The technical complexity of this modality should not be underestimated, as it requires a flowmeter, analyzers for CO and the inert gas, and a valve system for switching
109
Part B 8.2
Airway Resistance According to Ulmer et al. [8.12] and Matthys [8.16], airway resistance can be determined as Rtot or Reff , offering a sensitive measure of bronchial obstruction. With high sensitivity, these parameters do not only reflect reduction in cross-section but also dynamic compression of instable airways and reduced lung elasticity (loss of retraction). Shape analysis of resistance loops enables differentiation of homogeneous obstruction (e.g., bronchitis) from inhomogeneous obstruction (e.g., emphysema), therefore documentation of resistance loops is mandated.
8.2 Advanced Cardiopulmonary Function Testing
110
Part B
Functional Diagnostics Devices
Fig. 8.11 Screenshot of a single-breath test (CareFusion 234, Höchberg, Germany)
Part B 8.2 from air to the gas mixture as well as for sampling of the alveolar gas. Quality assurance programs could show that the quality of results depend – besides technical insufficiencies – mainly on correct operation and calibration. Avoiding frequently occurring errors, special care should be taken regarding:
• • • •
Correct and fast-acting valves Frequent calibration of gas analyzers with certified test gas Optimum patient instructions Performance of test according to recommendations of the European Respiratory Society [8.18].
Smokers and workers exposed to CO have higher arterial CO partial pressure, a so-called back pressure, which should be analyzed and considered in the calculation of alveolar partial pressure. If the hemoglobin content of the subject deviates from the normal range, a correction should be made when calculating the TLCO. The test should be carried out in a sitting position. In most cases, cleaning of the valve system is difficult, sometimes impossible, requiring the use of a breathing filter in compliance with hygiene standards. The technical service requirement for diffusion testing devices must not be underestimated, especially when complex breathing and analyzer valve systems are em-
ployed. The cost and supply logistics of testing and calibration gas should also be considered. A complete single-breath test including calibration will only need a few minutes. Clinical Value of the Single-Breath Test Implemented in routine clinical testing, determination of TLCO by the single-breath technique is simple and fast. When the above-mentioned errors are avoided and patients well instructed, results show acceptable accuracy and good reproducibility. The TLCO parameter does not only react to impairments of diffusion capacity in the sense of gas exchange over the alveolar– capillary membrane, but also to structural changes of lung tissue, independent from their cause, which might be either an increase or a reduction of alveolar space. A reduced TLCO cannot only be found in interstitial lung disease such as pulmonary fibrosis, sarcoidosis, alveolitis, or lung edema, but also in generalized emphysema, often characterized by loss of lung surface and increase of alveolar space. A normal or moderately reduced TLCO can also be seen in airway obstruction, while an increased TLCO may indicate obstructive hyperinflation, as attributed to asthma. Also intrapulmonary bleeding may lead to elevated TLCO levels. TLCO is well suited for follow-up studies and therapy control and may be used as an additional parameter in the assessment of pulmonary–vascular disorders. Due
Pulmonary Function Testing
Additional Methods in Diffusion Assessment During recent years, in addition to the classical modality described above, the IntraBreath method was introduced, featuring a single deep inhalation but no breath-holding before exhalation, certainly advantageous in children and dyspneic patients. Using fast infrared gas analyzers for continuous reading of lowdose CO, (inert) methane, and diffusible acetylene (soluble in blood), the capillary cardiac output can be determined in combination with the TLCO. The test can also be carried out under exercise. Due to its high patient exposure to CO, the previously used steady-state method has been abandoned. In addition to the TLCO test mentioned, a variety of other diffusion modalities exist, in particular those using the rebreathing technique. Nevertheless, their applicability in a regular laboratory and their international recognition might be limited.
8.2.4 Nitrogen-Washout Test for Determination of FRC Widely applied for decades in the English-speaking world, this modality requires a valve and gas delivery system to allow inspiratory switching from air to pure oxygen. With each inhaled breath of oxygen, nitrogen present in the lung, not participating in the gas exchange, will be replaced. Continuous gas sampling at the mouth by either a single N2 or combined O2 /CO2 analyzer allows determination of expired nitrogen volume during the N2 -washout procedure. Accumulated nitrogen volume is calculated breath by breath until the N2 concentration falls below 1%, marking the end of the washout sequence. Before the start of the washout, the N2 concentration (including rare inert gases) is 79.2%, which allows the functional residual capacity (FRC) to be derived as FRC =
VN2 (l) . 0.79
For standardization of lung volume determination by N2 washout refer to [8.4].
Technical Characteristics of the N2 -Washout Method Historically, this method required a fast N2 analyzer or a mass spectrometer, both expensive and demanding in operation and service. Nowadays, with the advent of fast-response combi-analyzers, the complementary gases O2 and CO2 can be determined instead of N2 , involving less complex and expensive technology. However, this novel approach makes synchronization of digitized gas samples necessary. As most analyzers draw a side-stream gas sample from the mouth, causing a delay between gas sample and flow, the response characteristic of the analyzer needs adjustment and correction. In a dedicated calibration routine the operator should be offered verification of the response compensation. The valve systems employed in N2 washout are similar to those used in diffusion testing, compromising hygiene unless a breathing filter is used. The test duration of FRC determination by N2 washout depends on the lung distribution of the subject, taking a few minutes in a healthy and more than 20 min in a severely obstructed individual. While classical N2 -washout devices use side-stream gas sampling, the novel ultrasound molar mass spirometry offers a less complex clinical approach with instantaneous gas analysis (Sect. 8.1.2, Fig. 8.5). The ultrasound sensor is able to determine both flow and molar mass, the specific weight of the gas, with a single transducer in the main stream of the respired gas. As molar masses of O2 and CO2 are distinctively different, the N2 concentration of the breathing gas can be assessed instantaneously and synchronous to flow and volume changes [8.19].
8.2.5 Ergospirometry Ergospirometry serves as the most prominent method to determine ventilation and gas exchange under physical exercise, in the English-speaking world often referred to as cardiopulmonary stress testing. A complete instrument (Fig. 8.12) consists of:
• • • • •
A device producing a defined level of physical stress (ergometer) A transducer for measurement of ventilation Gas analyzers for O2 and CO2 A computer for online processing of measured data, as well as A multichannel electrocardiograph (ECG).
For physical exercise, usually a bicycle or treadmill ergometer (Sect. 8.2.5) will be employed. Specialized
111
Part B 8.2
to its complexity, application of TLCO in screening may be limited to specialized studies, e.g., in workers exposed to dust. In a variation of the single-breath method using a mixture of CO, inert gas, and oxygen the diffusing capacity of the alveolar–capillary membrane, the so-called membrane component, and the capillary blood volume can be assessed, an application that might be confined to more specialized laboratories.
8.2 Advanced Cardiopulmonary Function Testing
112
Part B
Functional Diagnostics Devices
Fig. 8.12 Ergospirometry system
(Medgraphics, St. Paul, USA)
Part B 8.2 range should be within 2% of reading. For clinical purposes the range should cover at least 100 l/min, and for sports medical purposes up to 200 l/min. As the temperature in fully water-saturated expired air drops, humidity falls out and may cause erroneous reading in water-sensitive flow sensors. Supporting natural breathing through mouth and nose, a breathing mask should be used. The weight of the flowmeter should be as low as possible to allow direct docking of the flow transducer to the facemask.
Fig. 8.13 Portable ergospirometry system (CareFusion
234, Höchberg, Germany)
ergometers such as cranking or rowing ergometers will be applied in industrial and sports medicine (Fig. 8.13). Measurement of Ventilation In ergospirometry, flowmeters using varying measuring principles can be applied, including pneumotachographs, turbines, thermistor mass flowmeters, and ultrasound flowmeters. Calibration or verification of flow transducers before each test seems indispensable. The relative error of flow measurement should not exceed 3% of reading; the linearity in the measuring
Gas Analysis Historically, mass spectrometry has been referred to as the gold standard in gas analysis, as all breathing gas concentrations, namely those of O2 , CO2 , and N2 , can be measured quickly, synchronously, and with high accuracy. As this technology requires a large investment, continuous upkeep, voluminous space, and complex handling, its clinical application has become a rarity. Today, compact to mini-sized gas analyzers are integrated into one instrument together with other electronic components. As the response and delay of gas analyzers vary widely, a compensation algorithm is implemented in the ergospirometry software to allow for precise synchronization of all signals. Paramagnetic or fuel cells (zirconium oxide tube) are the prevalent principles in oxygen analysis, while CO2 is determined by means of selective infrared analyzers. The absolute error of gas analyzers should not exceed 0.1% within the measuring range; linearity should lie within 1% of reading. Before each test, the calibration of gas analyzers with certified calibrations gas at two concentration levels representing inhaled and
Pulmonary Function Testing
expired air is indispensable for assurance of highly precise results. Modern ergospirometry systems contain a software-controlled module for automatic calibration and verification.
where ks is the co-called shrinking factor given by kS =
(100 − FE O2 − FE CO2 ) , (100 − FI O2 )
where VE is the expiratory minute ventilation, and FI the inspiratory and FE the mean expiratory concentration of O2 and CO2 , respectively. Additionally a factor for the conversion from BTPS to standard temperature pressure dry (STPD) conditions has to be considered. CO2 output can be calculated accordingly. Response of gas analyzers or delay of the gas sample are of lesser importance as the gas mixing introduces a fairly high time constant. For decades, this modality has proven its clinical reliability. Due to its inability to follow physiological responses to changing exercise levels instantaneously, the mixing bag system has all but been replaced by the breath-by-breath method. Breath-by-Breath Method In the breath-by-breath (B × B) mode, flow is continuously measured at the mouthpiece or a breathing mask. A continuous gas sample is drawn as proximal as possible through thin moisture-absorbing tubing and analyzed by fast-response gas analyzers. Flow and gas concentrations need to be synchronized and precisely brought into phase. Also, the response of each analyzer needs software correction. The oxygen uptake is calculated according to � V˙ O2 = FO2 · V˙ dt (1/min) ,
where VO2 is the oxygen uptake, FO2 is the O2 concentration or fraction, and V˙ is the flow at the mouth. Additionally factors for conversion from BTPS to STPD must be applied by the software. The CO2 output is computed accordingly. As elegant as it seems, the B × B method can bring about inaccuracies and errors which need to be addressed by the operator and can only be avoided by frequent calibration and consequent verification, including precise analyzer delay adjustment. Equipment operators should demand validation and documentation of implemented algorithms from the manufacturers or suppliers of ergospirometry systems. Therefore, an open structured software showing the delay and response adjustment of the analyzers in real time, offering step-by-step procedures for calibration and verification, facilitates quality assurance. Clinical Value of Ergospirometry Modern ergospirometry is based on the work of Hollmann and Wasserman [8.20]. For clinical purposes, physical exercise is increased stepwise, e.g., using a bicycle ergometer, by increments of 25 W of 2–3 min each. This form of exercise is well suited for patients, allowing the cardiovascular system sufficient time to adapt to the exercise level, while avoiding muscular fatigue, anaerobic metabolism, and lactate production. As a valid measure of global physical performance, oxygen uptake directly relates to the interrelated organ system of heart–lung circulation, while the maximum oxygen uptake or vita maxima offers an objective assessment of the maximal performance capacity of the test subject. By visualizing the dynamics of ventilation, gas exchange, and heart rate, the latter derived from ECG, reduced capacity of each involved organ may be determined and differentiated from a limited degree of motoric efficiency [8.21]. Secondary parameters such as respiratory ratio and breathing equivalent (Table 8.4) as well as exercise-related blood gases assist in detecting compensation mechanisms and evaluating deficiencies even at submaximal stress levels. The determination of the aerobic–anaerobic metabolic transition, briefly called the anaerobic threshold, plays an important role is assessing and following the effects of training in rehabilitation and fitness centers. After addition of blood gases and blood pressure data, a conclusive report of ergospirometry test results is best given in graphical format, e.g., in the nine-field graph according to Wasserman [8.20].
113
Part B 8.2
Mixing Bag Method Reference to this method is made for didactic reasons only, as practically all presently available instruments work with the breath-by-breath method. The older mixing method separates inspiratory and expiratory air of the subject by use of a so-called Y-valve. The expiratory gas is collected in a mixing bag, from which a continuous sample is drawn and analyzed. The flowmeter is mounted on the expiratory side at the entrance port of the mixing bag, allowing determination of expiratory tidal volume and minute ventilation. Oxygen uptake VO2 can be calculated according to � � V˙ O2 = c · VE FI O2 · kS − FE O2 (1/min) ,
8.2 Advanced Cardiopulmonary Function Testing
114
Part B
Functional Diagnostics Devices
Table 8.4 Parameters in ergospirometry
Part B 8.2
Parameter
Abbreviation/definition
Unit
Load (bicycle ergometer) Speed (treadmill ergometer) Elevation (treadmill ergometer) Tidal volume Respiratory rate Minute ventilation Oxygen uptake Carbon dioxide output Heart rate Respiratory ratio Breathing equivalent (for O2 ) Breathing equivalent (for CO2 ) Oxygen pulse Alveolar-arterial difference Functional dead space
P v s VT Rf VE V O2 V CO2 HR RQ = V CO2 /V O2 E QO2 = VE /V O2 E QCO2 = VE /V CO2 V O2 Pulse = V O2 /HR AaDO2 VDf
W km/h % l /min l/min l/min l/min min−1 – – – ml/(min kg) mmHg %
For assessments in compensation claims and other rating cases, in particular in industrial medicine, ergospirometry is the tool of choice when an objective measure of reduced capacity is required. Also in the assessment of athletes, an ergospirometry system represents a valuable instrument which can be found in most sports medicine centers today. A minimum of 30 min should be considered for performing a complete stress test, including patient preparation, calibration, and evaluation of data.
8.2.6 Noninvasive Determination of Cardiac Output
and arterial content of CO2 in blood. Figure 8.14 depicts schematically the interaction of heart, lungs, and circulation. Estimation of the terms in the latter equation requires a CO2 -rebreathing module as an expansion to a regular ergospirometry system. During rest or physical exercise the subject breathes through a valve box to which a bag is attached. The bag is filled with a mixture of CO2 and oxygen gas, where the CO2 partial pressure in the bag approximates the mixed-venous partial pressure of the subject at the current exercise level. Initially, the valve box allows the subject to breathe ambient air, just like during a regular exercise test, while CO2 output is measured. Still under air breathing, a micro blood sample is
While ergospirometry allows only indirect assessment of cardiac function, oxygen uptake can be instrumental in determining cardiac output through the Fick equation
MV
V˙ O2 = Q t · avDO2 (1/min) . The arterio-venous O2 content difference, which is an effort-dependent variable, requires invasive assessment by catheterization. One of the internationally recognized noninvasive standards to determine cardiac output is the so-called CO2 -rebreathing method, an application of the Fick equation above to carbon dioxide rather than to oxygen V˙ CO2 V˙ CO2 (l/min) , = Qt = avDCO2 (Cv CO2 − Ca CO2 ) where avDCO2 is the arterio-venous content difference, and Cv CO2 and Ca CO2 are the mixed-venous
VCO2 RV pvCO2
Qt
LH
VCO2 = Qt (CvCO2 – CaCO2)
paCO2
Fig. 8.14 The Fick principle. The diagram schematically depicts the interaction of heart, lungs, and circulation (RH right ventricle, LH left ventricle, MV minute ventilation, V CO2 CO2 output, Qt cardiac output, pvCO2 mixed venous partial pressure of CO2 , paCO2 arterial partial pressure of CO2 ). For explanation refer to text
Pulmonary Function Testing
8.2.7 Metabolic Activity Monitoring Although portable ergospirometry systems have seen a lot of progress in size and versatility (Fig. 8.13), their application in normal everyday life and at the workplace is still very limited. The biggest obstacle seems a)
the restriction in testing time, as a subject cannot wear a face mask or use a mouthpiece for much more than several hours. During the last decade, improved diagnostic solutions were researched, offering assessment of physical activity over a longer period of time, up to several days, without restricting the subject in conducting a normal life. In addition the devices should be small, lightweight, and inexpensive. Even if the precision of ergospirometry is not reached with such a device, physical activity or energy expenditure in total calories spent, equivalent to oxygen uptake, should become available. Several categories of instruments based on the evaluation of heart rate (training watch), steps (pedometer), or acceleration in three axes (accelerometer) have come onto the market. Depending mostly on activity itself, these principles show good correlations with energy expenditure at moderate to high activity levels, but poor agreement in sedentary conditions in which most of our everyday life takes place. A novel multisensory device worn on the upper arm (Fig. 8.15) captures several physiological parameters, such as acceleration, and skin and ambient temperature, but also heat flux from the body and skin impedance. Employing artificial intelligence for the evaluation of raw data, energy expenditure under exercise as well as at low-level activity, rest or sleep can be assessed with reasonable to good accuracy. Data are recorded continuously for up to 3 weeks, offering a complete image of the subject’s lifestyle, documenting the activity–inactivity profile minute by minute. Particularly appreciated in medical research and drug studies, the device cannot be manipulated as it turns recording on when worn and turns off when not in skin contact. Due to its small size and low weight, the wearer will forget about the moni-
b) Galvanic skin response
Skin temperature
Heat flux
3-axis accelerometer
Fig. 8.15a,b Metabolic armband monitor for determination of physical activity (Bodymedia, Pittsburgh, USA)
115
Part B 8.2
drawn from the subject’s ear lobe and analyzed, yielding the arterial partial pressure pa CO2 . From a digital dissociation curve, the arterial CO2 content Ca CO2 is derived. If micro blood gas analysis is not available, pa CO2 can be estimated from the reading of the end-expiratory CO2 partial pressure pet CO2 , an acceptable approximation in healthy subjects. After switching the subject’s breathing to the bag at the end of an expiration, the CO2 /O2 gas mixture is inhaled. While rebreathing to and from the bag continues for several breaths, CO2 partial pressure will equilibrate between the lung and the bag as long as a constant pv CO2 is delivered from the right heart and no recirculation occurs. Only a few rebreathing breath cycles are needed to reach a CO2 equilibrium, which is monitored, and the mixed-venous partial pressure determined. Applying a digital dissociation curve, the Cv CO2 content is derived, the last component in the noninvasive determination of cardiac output. The CO2 -rebreathing method is a very elegant procedure, bearing no risk for the subject while requiring little cooperation. Its accuracy compares well with that of invasive methods [8.22]. In contrast to most of the catheter procedures, the rebreathing method will only determine pulmonary cardiac output without right-toleft shunt. While the expansion module for an existing instrument may not be very complex, the software upgrade will determine the cost.
8.2 Advanced Cardiopulmonary Function Testing
116
Part B
Functional Diagnostics Devices
tor on his arm and just pursue his daily routine. A broad literature base supports its application in different areas of pulmonary medicine, particularly severe chronic obstructive pulmonary disease (COPD) [8.23] and cystic fibrosis [8.24] where activity is an important outcome parameter.
Part B 8
8.2.8 Planning and Laboratory Space Considerations The laboratory room in which a body plethysmograph will be installed does not need to be particularly spacious but should be in a quiet location, separated from
any through traffic. Big windows adjacent to the body box may lead to pressure artifacts caused by wind gusts or sun exposure. The diffusion test can be performed in the same room as the body plethysmograph or with an add-on unit within the chamber while the box door is open. N2 -washout devices or spirometers can be placed in a laboratory room or on a trolley for mobile use. In contrast, ergospirometry requires a spacious room with good ventilation, in particular when a treadmill or ergometer, blood gas analyzer or other laboratory equipment should be placed in the same room. A changing room and a shower should be available for the test subjects.
References 8.1
8.2 8.3 8.4
8.5
8.6
8.7 8.8
M.R. Miller, J. Hankinson, V. Brusasco, F. Burgos, R. Casaburi, A. Coates, R. Crapo, P. Enright, C.P.M. van der Grinten, P. Gustafsson, R. Jensen, D.C. Johnson, N. MacIntyre, R. McKay, D. Navajas, O.F. Pedersen, R. Pellegrino, G. Viegi, J. Wanger: Standardisation of spirometry, Eur. Respir. J. 26, 319–338 (2005) European Respiratory Society: Standardized lung function testing, Eur. Respir. J. 6(Suppl 16), 3–52 (1993) C. Buess, P. Pietsch, W. Guggenbühl, E.A. Koller: A pulsed diagonal beam ultrasonic air flowmeter, J. Appl. Physiol. 61(3), 1195–1199 (1986) J. Wanger, J.L. Clausen, A. Coates, O.F. Pedersen, V. Brusasco, F. Burgos, R. Casaburi, R. Crapo, P. Enright, C.P.M. van der Grinten, P. Gustafsson, J. Hankinson, R. Jensen, D. Johnson, N. MacIntyre, R. McKay, M.R. Miller, D. Navajas, R. Pellegrino, G. Viegi: Standardisation of the measurement of lung volumes, Eur. Respir. J. 26, 511–522 (2005) R. Pellegrino, G. Viegi, V. Brusasco, R.O. Crapo, F. Burgos, R. Casaburi, A. Coates, C.P.M. van der Grinten, P. Gustafsson, J. Hankinson, R. Jensen, D.C. Johnson, N. MacIntyre, R. McKay, M.R. Miller, D. Navajas, O.F. Pedersen, J. Wanger: Interpretative strategies for lung function tests, Eur. Respir. J. 26, 948–968 (2005) T.I. Petty, D.J. Pierson, N.P. Dick, L.D. Hudson, S.H. Walker: Follow-up evaluation of a prevalence study for chronic bronchitis and chronic airway obstruction, Am. Rev. Respir. Dis. 114, 881–890 (1976) M. Gappa, C. Buess, S.I. Fuchs: Slope indices from ultrasonic tidal molar mass-volume curves, ERS Congress, Copenhagen (2005) R.L. Jensen, C. Buess, R.O. Crapo: Ultrasonic measurements of CO2 during quiet breathing may diagnose degree of airway obstruction, ATS Convention (2005)
8.9
8.10 8.11
8.12 8.13
8.14
8.15
8.16 8.17
8.18
E. Oostveen, D. MacLeod, H. Lorino, R. Farré, Z. Hantos, K. Desager, F. Marchal, ERS Task Force: The forced oscillation technique in clinical practice: Methodology, recommendations and future developments, Eur. Respir. J. 22, 1026–1041 (2003) H.J. Smith, P. Reinhold, M.D. Goldman: Forced oscillation technique and impulse oscillometry, Eur. Respir. J. 31, 72–105 (2005) J. Winkler, A. Hagert-Winkler, H. Wirtz, G. Hoheisel: Die moderne Impulsoszillometrie im Spektrum lungenfunktioneller Messmethoden, Pneumology 63, 461–469 (2009) W.T. Ulmer, D. Nolte, J. Lecheler: Die Lungenfunktion. Methodik und klinische Anwendung (Thieme, Stuttgart 2003) A.B. DuBois, S.Y. Botelho, J.H. Comroe Jr.: A new method for measuring airway resistance in man using a body plethysmograph: Values in normal subjects and in patients with respiratory disease, J. Clin. Invest. 35(3), 327–335 (1956) A.B. DuBois, S.Y. Botelho, G.N. Bedell, R. Marshall, J.H. Comroe Jr.: A rapid plethysmographic method for measuring thoracic gas volume: A comparison with a nitrogen washout method for measuring functional residual capacity in normal subjects, J. Clin. Invest. 35(3), 322–326 (1956) D.O. Rodenstein, D.C. Stanjescu: Frequency dependence of plethysmographic volume in healthy and asthmatic subjects, J. Appl. Physiol. 54, 159–165 (1983) H. Matthys: Pneumologie (Springer, Berlin, Heidelberg 1988) J.E. Cotes, A.M. Hall: The transfer factor for the lung; normal values in adults. In: Normal Values for Respiratory Function in Man, ed. by P. Arcangeli (Panminerva Medica, Torino 1970) pp. 327–343 N. MacIntyre, R.O. Crapo, G. Viegi, D.C. Johnson, C.P.M. van der Grinten, V. Brusasco, F. Burgos, R. Casaburi, A. Coates, P. Enright, P. Gustafsson,
Pulmonary Function Testing
8.19
8.21 8.22 8.23 8.24
N.L. Jones: Clinical Exercise Testing (Elsevier, Amsterdam 1997) N.L. Jones: Evaluation of a microprocessorcontrolled exercise system, J. Appl. Physiol. 57, 1312–1318 (1984) H. Watz, B. Waschki, T. Meyer, H. Magnussen: Physical activity in patients with COPD, Eur. Respir. J. 33, 262–272 (2009) T. Troosters, D. Langer, B. Vrijsen, J. Segers, K. Wouters, W. Janssens, R. Gosselink, M. Decramer, L. Dupont: Skeletal muscle weakness, exercise tolerance and physical activity in adults with cystic fibrosis, Eur. Respir. J. 33, 99–106 (2009)
117
Part B 8
8.20
J. Hankinson, R. Jensen, R. McKay, M.R. Miller, D. Navajas, O.F. Pedersen, R. Pellegrino, J. Wanger: Standardisation of the single-breath determination of carbon monoxide uptake in the lung, Eur. Respir. J. 26, 720–735 (2005) S.I. Fuchs, C. Buess, S. Lum, W. Kozlowska, J. Stocks, M. Gappa: Multiple breath washout with a sidestream ultrasonic flow sensor and mass spectrometry: A comparative study, Pediatr. Pulmol. 41, 1218–1225 (2006) K. Wasserman, J.E. Hansen, D.Y. Sue: Principles of Exercise Testing and Interpretation: Including Pathophysiology and Clinical Applications (Lippincott Raven, Philadelphia 2004)
References
http://www.springer.com/978-3-540-74657-7


![[PDF] Ruppel s Manual of Pulmonary Function Testing ... - Google Sites](https://m.moam.info/img/260x300/pdf-ruppel-s-manual-of-pulmonary-function-testing-_64784a1b097c47a9708ca962.jpg)