Sep 8, 2003 - A form of suspension for the seismic mass is designed to insure that the ... excitation, such as that from a modal hammer or an electrodynamic.
A Base Excitation Test Facility for Dynamic Testing of Microsystems
David S. Epp† , O. Burak Ozdoganlar‡ , Pavel M. Chaplya♮ , Bruce D. Hansche♯ , Thomas G. Carne‡ †
Org. 9125 Structural Dynamics Engineering ‡ Org. 9124 Structural Dynamics Research ♮ Org. 9123 Material Mechanics ♯ Org. 9122 Advanced Diagnostics and Product Testing Sandia National Laboratories, Albuquerque, New Mexico 87185
ABSTRACT Dynamic characterization of microsystems is critical for model validation and property extraction activities. Base excitation is a powerful means of non-intrusive testing of vibration characteristics. A test facility has been developed for base excitation vibration testing of micro electromechanical systems (MEMS) under variable pressure. This facility is specifically designed to test nonlinear structural dynamics and coupled-physics phenomena in MEMS with stepped-sine type excitation. The design minimizes the effect of apparatus dynamics and external noise on the MEMS devices under test. A vacuum chamber was fabricated to allow the piezo-actuator to be mounted inside rather than outside the chamber. Two piezo-actuators were evaluated to find one that minimizes the distortion of the drive signal through the particular amplifier used. Methods for mounting the piezo-actuator in the vacuum chamber were investigated to eliminate the dynamics of the mount within the frequency range of interest. The final facility allows testing of MEMS devices with no structural dynamics of the test facility and little distortion of the input due to piezo-actuator/amplifier combination within 1 kHz to 100 kHz.
1
INTRODUCTION
Micro electromechanical systems are one of the new frontiers in the engineering field. The technology exists now to create systems on the sub-micrometer scale, such as acceleration, pressure, and chemical sensors, actuators, and mirror arrays. Currently, much of the experimental work on MEMS is focused on investigating whether new designs function properly. However, as design complexity increases and reliability becomes more of an issue increasingly detailed knowledge about structural dynamics and coupled-physics phenomena that affect these structures will be necessary. Increasing this knowledge will require facilities specifically designed to test dynamics of MEMS articles under varying environmental conditions. Experience can be drawn from the knowledge available for testing macro structures, but attention must be directed towards adapting this knowledge to the micro world. Unlike macro-scale testing, the size-mismatch in micro-scale testing prohibits the use of direct excitation and measurement devices. Non-intrusive/non-contact devices must generally be used to ensure that the characteristics of the MEMS devices being tested are unaltered. Several methods for excitation of MEMS have been utilized for dynamic testing. These include electrostatic excitation[1−3] , embedded smart materials[4] , base excitation[5, 6] , and other less common techniques[7] . Various methods are also available for measuring the response of the MEMS devices, including video-imaging techniques[8, 9] , interferometry[10] , laser doppler velocimetry (LDV)[11−14] , and other less known techniques[1, 15−17] . Another factor in the design of a dynamic test facility for MEMS is nonlinear structural dynamics behavior of microsystems[18−20] . When performing modal testing, especially in the presence of system nonlinearities, it must be
Phase
180 90 0 -90 -180 8
Amplitude
6
4
2
0 0
10
20
30
40
50
60
70
80
90
100
Frequency (kHz)
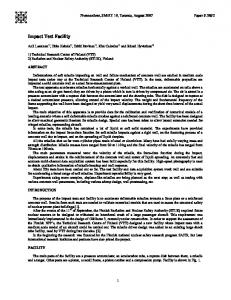
Figure 1: Photo of the facility used in previous work.
Figure 2: FRF of 800 µm beam at atmospheric pressure in the old test facility.
assured that the response arises purely from the intended input. For this reason, the system being tested must be dynamically isolated from the surrounding environment. Furthermore, to establish the intended input, the structural dynamics of the input transducer must be carefully tuned to exhibit no resonances within the frequency range of interest. Previous work by some of the authors in the area of testing nonlinear phenomena in MEMS devices showed adverse effects of resonance frequencies of the facility and environmental noise[18] . The problems encountered in that work motivated the facility redesign in this paper. This paper presents an experimental facility for testing nonlinear structural dynamics and coupled-physics phenomena in microsystems. The facility is designed to eliminate the influence of the test apparatus and external noise on the response of the MEMS article being tested. A piezo-actuator is used to excite the MEMS device with a sinusoidal base motion, and the velocity response is measured using a Laser Doppler Vibrometer (LDV) coupled with a microscope. To ensure that the response will be mostly in the intended direction , the piezo-actuator is attached onto a small seismic mass. A form of suspension for the seismic mass is designed to insure that the external noise is filtered. A vacuum chamber is designed to completely enclose the miniature shaker and test piece. Candidate designs have been evaluated within 1 kHz to 100 kHz. The final performance of the test facility is demonstrated with a comparison of modal test results for an 800 µm long cantilever beam with that from an older test facility[18] .
2 2.1
BACKGROUND Previous Work
Ozdoganlar et al.[18] presented a test facility for evaluating structural dynamic and coupled-physics phenomena in MEMS. Test were undertaken for various cantilever beam geometries, gap heights, and ambient pressures, with the specific purpose of investigating the gas damping phenomenon. As seen in Fig. 1, a commercial piezo-actuator was used to shake a vacuum chamber that contained the MEMS module being tested. An LDV was fed through a microscope to measure the response. During the preliminary testing presented, true random (white noise) excitation was used to establish an effectively linearized behavior of gas damping, which actually is a nonlinear phenomenon. It was observed that, due to the nonlinearities, the structural dynamics of the test apparatus, composed of the commercial shaker and the vacuum chamber, significantly influenced the modal test results. For instance, Fig. 2 shows the frequency response function (FRF) for the tip of a 800 µm beam in atmospheric pressure. The large noise peak at 72 kHz was attributed to the dynamics of the apparatus. Ozdoganlar et al.[18] stated that effective testing of nonlinear phenomena in MEMS necessitates a test facility design that exhibits no resonances within the frequency range of interest and effectively isolates the test article from external noise. The facility design presented here was motivated by that conclusion.
x(t) m
z(t)
k
c x0(t)
Base Figure 3: A single degree-of-freedom second-order system showing the relationship between relative and absolute coordinates
2.2
Modal Testing with Base Excitation
Modal testing typically involves a measurable excitation, such as that from a modal hammer or an electrodynamic shaker. The response is also simultaneously measured by an independent transducer. The most common combination of excitation and response measurements is that of force and acceleration. The ratio of the response to the excitation can be represented in the frequency domain as an FRF, and most modal extraction algorithms use accelerance FRFs, where the excitation is force and the response is acceleration. Due to the small size of the MEMS structures, non-intrusive excitation and response measurement is preferred over more standard methods used on macro scale structures[11, 14, 15, 24, 25] . A simple form of non-intrusive excitation is base-excitation. Base-excitation testing typically results in measurement of the motion of the base exciter (i.e., the shaker) and the motion of the structure. These measurements can be combined into a transmissibility, which is the ratio of input motion to output motion in the frequency domain. For the apparatus in this paper, the velocities of the MEMS structure and the top face of the miniature shaker have been measured. To be used with standard modal analysis techniques, this transmissibility data must be transformed into the form of an accelerance FRF.[26−28] The transformation is illustrated on the second order single degree of freedom system in Fig. 3. The motion of the mass relative to the base can be given as z(t) = x(t) − x0 (t).
(1)
Using this relative coordinate, the system dynamics can be expressed as z¨(t) + 2ζωn z(t) ˙ + ωn2 z = −¨ x0 (t),
(2)
where ωn is the natural frequency and ζ is the damping ratio. Taking the Fourier transform with zero initial conditions and rearranging leads to ω2 Z(jω) . = X0 (jω) −ω 2 + 2jζωn ω + ωn2
(3)
The right-hand-side of this equation is now in the same form as the accelerance. To finish the derivation, the left-hand-side must be expressed in terms of the base and system velocities that are measured during the baseexcitation testing by substituting the Fourier transform of Eq. (1) for Z(jω) to write µ ¶ X(jω) ω2 X(jω) − X0 (jω) = −1 = . (4) 2 X0 (jω) X0 (jω) −ω + 2jζωn ω + ωn2 This is equivalent to ¡
¶ µ ¢ ω2 V (jω) −1 = , HV T (jω) − 1 = 2 V0 (jω) −ω + 2jζωn ω + ωn2
(5)
where V (jω) and V0 (jω) are the velocity spectrums at the locations of X(jω) and X0 (jω), respectively. Thus, the accelerance form can be calculated through a simple operation on the velocity transmissibility HV T (jω). This allows modal property extraction of the velocity data collected.
3
THE SEISMIC MASS
The main purpose of the seismic mass is to direct the motion induced by the piezo-actuator in a particular direction, i.e., away from itself. For a specified motion amplitude ratio, the required mass ratio of the seismic mass and piezo actuator can be determined from the conservation of momentum expressed as msm vsm + mpa vpa = 0,
(6)
where msm and vsm are the mass and velocity of the seismic mass, and mpa and vpa are the mass and velocity of the piezo-actuator. This yields ¯ ¯ ¯ ¯ ¯ msm ¯ ¯ vpa ¯ ¯ ¯ =¯ ¯ (7) ¯ mpa ¯ ¯ vsm ¯.
For instance, if we require the velocity (motion) of the piezo-actuator to be four times larger than that of the seismic mass, we need to choose the seismic mass to be at least four times more massive than the piezo-actuator.
It is also required that the miniature shaker does not possess resonance frequencies within the frequency range of interest. The dimensions and material of the seismic mass must be selected such that its elastic resonances are above the highest frequency of interest. The first elastic resonance of the seismic mass can be calculated from f=
c , 2h
(8)
where c is the speed of sound in the material and h is the largest dimension of the prism. Based on the above considerations, a stainless steel seismic mass with 0.7×1.0×1.0 cm dimensions has been selected for the test facility. This seismic mass is more than an order of magnitude more massive than either piezoactuator under consideration, which yields a mass ratio greater than 10. This means that, from Eq. 7, at least 90% of the actuator motion will be away from the seismic mass (i.e., vertically up). Using Eq. (8), the first elastic mode is calculated as 250 kHz, which is well above the frequency range of interest.
4
THE SUSPENSION MECHANISM
One way to isolate the system being tested from external noise is to design a mechanical filter. The mechanical filter is tuned such that it has all its resonances below the frequency range of interest. Since the response rapidly diminishes after a resonance, any external noise above the resonance will be filtered. Using the seismic mass selected in the last section, a suspension system based on steel leaf-springs was designed. The steel springs are chosen as 1 cm wide, 1 cm long, and 200 µm thick. A schematic of this design is shown in Figure 4. With the selected seismic mass, these springs yield a first analytical bounce mode of the seismic mass just below 400 Hz. A prototype of this design was manufactured using wire electrical discharge machining (EDM) to machine the mass and springs monolithically from a stainless steel block. The spring-suspended seismic mass prototype was mounted on a commercial shaker to experimentally verify its natural frequencies. The shaker was a Wilcoxon combination electrodynamic and piezo-actuator with a bandwidth of 20 kHz. The shaker was driven with a true random (white noise) excitation in the range of 50 Hz to 10 kHz, and the response of the seismic mass was measured with an LDV (Polytech model OFV-302 interferometer, with OFV3000/OVD02 velocity demodulator) through a microscope. The FRF relating the input acceleration from the Wilcoxon shaker to the output velocity from the seismic mass was recorded from the four corners of the seismic mass and at the corners and center of the leaf-springs, as shown in Fig. 5. After the acceleration data was integrated, the
Spring Suspension Piezo Actuator Seismic Mass Figure 4: Schematic diagram of the spring suspended seismic mass
Phase
0 −180 −360 4 10
Magnitude
2
10
0
10
Seismic Mass
−2
10
2
10
Figure 5: Data locations on the top of the spring suspended seismic mass
3
10 Frequency (Hz)
4
10
Figure 6: Calculated accelerance FRF of one corner (node 103) of the spring suspended seismic mass
transmissibility between the Wilcoxon shaker and the spring-suspended seismic mass was formed. This data was then transformed into the accelerance FRF form using the derivation above. Figure 6 shows the accelerance FRF for one corner on the seismic mass (node 103). There are three frequencies below 1 kHz and two natural frequencies around 9 kHz. When the mode shapes were generated, the lower three resonances were identified as rigid body modes of the seismic mass, and the two higher resonances were seen to be the first bending modes of the leaf-springs. The large frequency disparity between the first two modes shown in Figure 7 is caused by different leaf-spring thicknesses resulting from manufacturing. If the thicknesses were identical, these two modes would have been at the same frequency. For the same reason, the first bending modes of the two leaf-springs were seen at different frequencies (8176 Hz and 9179 Hz). Since it violates the design constraints by having resonances above 1 kHz, the leaf-spring based suspension was deemed unacceptable. For this reason, an alternate design was considered. The new design utilizes foam as the suspension mechanism based on the configuration schematically shown in Figure 8. A 2 cm square block of 1.25 cm thick open-cell neoprene foam rubber is used. This foam is rated for 25% compression under 13.8 to 34.5 kPa and fails at 414 kPa of tension. To determine an acceptable means of attaching the seismic mass to the foam, Eastman 910 (superglue) and ordinary double-sided tape were compared. It was seen that neither altered the dynamic response of the seismic mass by introducing new resonances within the frequency range of interest. For simplicity, the latter was chosen as the method of attachment. To evaluate this design, the suspension and seismic mass assembly was connected to the same commercial Wilcoxon shaker used above and again driven with a true random (white noise) signal from 50 Hz to 10 kHz.
(a) 290 Hz
(b) 339 Hz
(c) 740 Hz
(d) 8176 Hz
(e) 9179 Hz
Figure 7: Mode shapes of the spring suspended seismic mass below 10 kHz
The data were collected from the four corners of the seismic mass. Figure 9 shows a typical response of one corner of the seismic mass and Figure 10 shows the modes extracted from this data. It can be seen that the current suspension design does not exhibit resonances between 1 kHz and 10 kHz. For this reason, the foam suspension design was chosen. The evaluation of this suspension design at higher frequencies will be completed in the next section using a piezo-actuator.
5
THE PIEZO ACTUATOR
Piezo actuators are capable of providing dynamic excitation up to very high frequencies. However, single-layer piezo actuators require very large voltages to produce sizeable displacements. For this reason, stacked piezoactuators are sometimes used. The main disadvantage of the stacked piezo-actuators is the high capacitive load they represent to the drive amplifier. Since the effective resistance of a capacitive load decreases significantly with frequency, the bandwidth of an amplifier/piezo-actuator combination needed to be determined experimentally. If the amplifier does not possess sufficient power, the output voltage from the amplifier will drop at higher frequencies. However, since we want to directly control the piezo motion with the input voltage to the amplifier, a flat frequency response is required between the input and output voltages of the amplifier through the frequency range of interest.
5.1
Single-Layer vs. Stacked Piezo Actuator
In this section, a single-layer and a stacked piezo-actuator are compared in the range of 1 kHz to 100 kHz. The stacked piezo-actuator was a model PL055 from Polytec PI, Inc. with 5×5×2 mm dimensions. This actuator is rated
Phase
0 −180 −360 2 10
1
Piezo Actuator
10 Magnitude
Seismic Mass
0
10
−1
10
Foam
−2
10
2
10
3
10 Frequency (Hz)
4
10
Figure 8: Schematic diagram of the foam suspended Figure 9: Calculated accelerance FRF of one corner of seismic mass the foam suspended seismic mass
(a) 50 Hz
(b) 106 Hz
(c) 176 Hz
Figure 10: Mode shapes of the foam suspended seismic mass below 10 kHz
for 2.3 µm displacement at 100 V. The second piezo-actuator was a single layer of PIC151, also from Polytec PI, Inc. This 10 mm square actuator with 1 mm thickness was rated to produce up to 1 µm displacement at 1000 V. Both piezo-actuators were driven with a Krohn-Hite 7500 power amplifier which has a bandwidth of 1MHz when it drives a 200 Ω load. To evaluate the effect of the capacitive load on the frequency response of the amplifier, FRFs between input and output voltages of the amplifier were collected for each piezo-actuator. Figure 11 shows the results for these tests. The amplifier was set on 10x amplification for the stacked piezo-actuator and 100x for the single layer piezo-actuator and a 0.2 V rms random signal was input to the amplifier. As seen from the roll off above 40 kHz, the amplifier does not have enough power to drive the higher capacitance of the stacked piezo-actuator through the desired 100 kHz bandwidth. If an amplifier with more power were available, this response would have been improved. The singlelayer piezo-actuator, on the other hand, caused no distortion between the input and output voltages in this frequency range. Therefore, since a more powerful amplifier was not available, the single-layer piezo-actuator is chosen for the MEMS test facility.
5.2
Effect of Boundary Conditions on Piezo-Actuator Response
During the testing of the single-layer piezo-actuator, it was observed that the corners of the actuator exhibited higher displacements than its center. It was suspected that this behavior arises from the nature of the attachment of the
0 Phase
Phase
0 −180 −360 2 10
−180 −360 3 10
Magnitude
Magnitude
2
1
10
10
1
10
0
0
10
10 4
5
10
10 Frequency (Hz)
(a)
4
5
10
10 Frequency (Hz)
(b)
Figure 11: Frequency response of the amplifier with (a)stacked piezo attached and (b)single layer piezo attached
piezo onto the seismic mass. The actuator was glued down to the seismic mass by applying Eastman 910 over the entire contacting face. This attachment essentially produced a clamped boundary condition on the lower face of the actuator and a free boundary condition on the upper face. Linear piezoelectric finite elements were used to simulate the response of a piezoelectric actuator. The model represents a 10 mm by 10 mm by 1 mm block of a PIC151 piezoelectric ceramic. The base of the actuator is rigidly attached (i.e., clamped) to a stationary foundation by specifying zero displacement and zero rotation on the nodes that belong to the bottom surface of the model. Material properties (elastic, dielectric, and piezoelectric constants) are taken from the specifications provided by Polytec PI, Inc. The model was meshed with 6900 brick elements. An electric field was applied to the model by specifying a 0 V boundary condition on the upper nodes and a 200 V boundary condition on the bottom nodes, which resulted in a 0.2 MV/m electric field. This electric field is representative of that applied during experiments. Figure 12 shows the deformed shape of the piezoelectric actuator. A positive electric field results in the material elongation in the direction of the field and contraction in both transverse directions. The clamped boundary surface generates reaction stresses that restrict the transverse contraction of the bottom, which results in larger displacement at the corners than at the center of the piezo-actuator forming a bowl shape. It can also be seen, however, that there exists a large plateau. So long as the test article is attached within this plateau, this behavior would not be of any concern.
6
VACUUM CHAMBER
One of the goals of the test facility design was the capability of testing MEMS dynamics under various levels of ambient pressure. As mentioned in the Background section, the amplitude variation observed in the older design [18] was partly due to the fixture/vacuum chamber that was attached onto the ultrasonic shaker. To minimize such distortion in the new facility, the vacuum chamber was designed to completely enclose the miniature shaker. For this purpose, a vacuum chamber 3.75 cm in diameter and 3.75 cm tall was constructed. The desired vacuum limit for the chamber was approximately 4 kPa. Figure 13 shows the assembled vacuum chamber with the seismic mass, piezo-actuator, and a test article inside. A blank flange was used as the base of the chamber. A hollow flange with a 5 cm inside diameter was placed on top of the blank flange. A viewport was than attached on the top of the hollow flange. Ports were fabricated to allow electrical and vacuum connections. Viton gaskets were used in all connections to provide a vacuum seal. All of the
1
1 DISPLACEMENT SUB =1 TIME=1 DMX =.152E-06
NODAL SOLUTION
SEP 8 2003 11:42:55 PLOT NO. 1
SEP 8 2003 11:39:04 PLOT NO. 1
SUB =1 TIME=1 UZ (AVG) RSYS=0 DMX =.152E-06 SMX =.108E-06
Y Z
X
Z Y
X
MN
MX
0
.240E-07 .120E-07
(a)
.480E-07 .360E-07
.721E-07 .601E-07
.961E-07 .841E-07
.108E-06
(b)
Figure 12: Analysis results for the piezo-actuator with a clamped base in (a)cross-section and (b) three dimensional displacement
parts used are rated for 13.3 µPa.
7 7.1
RESULTS AND DISCUSSION Final Design of the Miniature Shaker
Based on the above considerations, the final design is formed by a single layer piezo-actuator mounted on the foamsuspended seismic mass. The seismic mass and suspension combination was shown not to have any resonances in the frequency range of interest (1 kHz to 100 kHz). The choice of single-layer piezo actuator was dictated by the capacity of the available amplifier. Figure 14 shows the response of the final design configuration from the top of the piezo actuator. Since the voltage into the piezo-actuator is linearly proportional to its displacement, when all disturbances are eliminated, the FRF between the input to the amplifier and the velocity of the piezo-actuator would approximate that of a first-order derivative (i.e., a straight line of unity slope). Since the FRF in Fig. 14 approximately follows the shape of a first order derivative, it was concluded that all the design requirements have been fulfilled.
7.2
Attaching a Test Specimen
The final challenge was to determine a means of attaching the test piece onto the miniature shaker, such that the structural response of the test piece will be unaltered. Two methods of attachment were proposed: (1) wax and (2) Eastman 910. The wax allows easy attachment and removal of the test article and reuse of the seismic mass and actuator assembly. When Eastman 910 is used, the entire assembly will have to be reconstructed every time a new MEMS module is tested. To evaluate the attachment methods, a MEMS module was attached on top of the piezo-actuator using each method, and the frequency response relative to the drive voltage was recorded. Figures 15(a) and 15(b) show the response at the substrate of the MEMS test piece for wax and superglue attachments, respectively. The wax method exhibited several new resonances when it was compared to the response of the piezo-actuator shown in Figure 14. At high frequencies, the wax loses its rigidity and acts like a spring, inducing several resonances of the MEMS die attached. The response with the Eastman 910 attachment, on the other hand, is very similar to that of the piezo-actuator, indicating that the Eastman 910 is a better choice for attachment from the dynamics standpoint.
Phase
0 −180 −360 2 10
Magnitude
1
10
0
10
−1
10
4
5
10
10 Frequency (Hz)
Figure 13: Assembled vacuum chamber with seismic mass, piezo actuator, and test article inside
Figure 14: FRF of the final design showing velocity relative to actuator drive voltage. Final design combines the single layer 10 mm square by 1 mm piezo-actuator with the foam suspended seismic mass. 0 Phase
Phase
0 −180 −360 2 10
−180 −360 2 10
1
1
10 Magnitude
Magnitude
10
0
10
−1
0
10
−1
10
10
−2
−2
10
10 4
5
10
4
10 Frequency (Hz)
(a)
5
10
,
10 Frequency (Hz)
,
(b)
Figure 15: FRF of velocity at MEMS substrate relative to input voltage with attachment by (a)wax and (b)Eastman 910
7.3
Response of a MEMS Beam
To illustrate the effectiveness of the new test facility as compared to the previous one, FRF amplitudes for an 800 µm beam with a 6.3 µm nominal gap to the substrate at ambient pressure were compared in Fig. 16. It was seen that the noise peak at 72 kHz disappeared, whereas the resonances of the beam at 4.8 kHz, 31 kHz, and 85 kHz are still present. The new design also yielded lower noise levels, producing a cleaner FRF. This comparison indicates that we have successfully redesigned the MEMS test facility to remove any resonances in the range from 1 kHz to 100 kHz.
8
SUMMARY AND CONCLUSIONS
An experimental facility for testing nonlinear structural dynamics and coupled-physics phenomena for microsystems has been presented. A miniature shaker that is composed of a piezo actuator, a seismic mass, and a suspension
8
6
6
Amplitude
Amplitude
8
4
2
0 0
4
2
10
20
30
40
50
60
70
80
90
100
Frequency (kHz)
(a)
0 0
10
20
30
40
50
60
70
80
90
100
Frequency (kHz)
(b)
Figure 16: Comparison of the calculated accelerance FRF for an 800 µm long beam using (a) the old facility[18] and (b) the new facility
mechanism has been designed to excite MEMS modules using the base excitation technique. The measurements are conducted with an LDV coupled to a microscope. A vacuum chamber that encloses the miniature shaker and the test piece was also designed to allow varying ambient pressures. The main goal of the design has been to eliminate the influence of the apparatus dynamics and external noise on the modal response of the test article. For this purpose, detailed evaluations of various designs/configurations of miniature shaker components have been conducted. Different techniques of attachment between the seismic mass and the suspension, and between the piezo actuator and the seismic mass have also been investigated. The following specific conclusions can be stated for this work: • Elimination of the influence of apparatus dynamics and the external noise is of utmost importance when testing nonlinear structural dynamics and coupled-physics phenomena for MEMS. • The test facility designed here allows effective dynamic testing of MEMS components within 1kHz - 100 kHz frequency range for pressures between 101 kPa and 4 kPa.
9
ACKNOWLEDGEMENTS
The authors would like to thank following Sandians: James J. Allen and Brian R. Resor for reviewing the article and valuable suggestions, and David W. Kelton for production of the test facility components. Sandia is a multiprogram laboratory operated by Sandia Corporation, a Lockheed Martin Company, for the United States Department of Energy under contract DE-AC04-94AL85000.
REFERENCES [1] Eaton, W., Smith, N., Irwin, L. and Tanner, D., Characterization techniques for surface-micromachined devices., Proceedings of the SPIE - The International Society for Optical Engineering, Vol. 3514, pp. 431–438, 1998. [2] Ijntema, D. J. and Tilmans, H. A. C., Static and dynamic aspects of an air-gap capacitor, Sensors and Actuators, A: Physical, Vol. 35, No. 2, pp. 121 – 128, 1992. [3] Burns, D. and Helbig, H., A system for automatic electrical and optical characterization of microelectromechanical devices, Journal Of Microelectromechanical Systems, Vol. 8, No. 4, pp. 473–482, 1999.
[4] Tilmans, H. A. C., IJntema, D. J. and Fluitman, J. H. J., Single element excitation and detection of (micro)mechanical resonators., Proceedings of Int. Conf. on Solid-State Sensors and Actuators (TRANSDUCERS ’91), San Francisco, CA, pp. 533–537, 1991. [5] Temesvary, V., Wu, S., Hsieh, W. H., Tai, Y.-C. and Miu, D. K., Design fabrication and testing of silicon microgimbals for super-compact rigid disk drives, J. of Microelectromechanical Systems, Vol. 4, No. 1, pp. 18– 27, 1995. [6] Burdess, J., Harris, A., Pitcher, R., Ward, M., King, D. and Wood, D., Mechanical characterisation of a polysilicon accelerometer., Proceedings of IEE Colloquium on Silicon Fabricated Inertial Instruments, London, UK, pp. 7/1–7/7, 1996. [7] Bouwstra, S., Tilmans, H. A. C., Selvakumar, A. and Najafi, K., Base driven micromechanical resonators, Proceedings of IEEE Solid-State Sensor and Actuator Workshop, Hilton Head Island, SC, USA, pp. 148–152, 1992. [8] Rembe, C., Tibken, B. and Hofer, E., Analysis of the dynamics in microactuators using high-speed cine photomicrography, Journal Of Microelectromechanical Systems, Vol. 10, No. 1, pp. 137–145, 2001. [9] LaVigne, G. F. and Miller, S. L., A performance analysis system for MEMS using Automated Imaging Methods, Proceedings of IEEE International Testing Conference, Washington, D. C., pp. 442–447, 1998. [10] Cloud, G. L., Optical Methods of Engineering Analysis, Cambridge University Press, 1995. [11] Schnitzer, R., Ruemmler, N., Grosser, V. and Michel, B., Vibration measurement of microstructures by means of laseroptical modal analysis, Proceedings of SPIE - The International Society for Optical Engineering, Vol. 3825, pp. 72–79, 1999. [12] Ngoi, B., Venkatakrishnan, K., Tan, B., Noel, N., Shen, Z. and Chin, C., Two-axis-scanning laser Doppler vibrometer for microstructure, Optics Communications, Vol. 182, No. 1-3, pp. 175–185, 2000. [13] Burdess, J., Harris, A., Wood, D., Pitcher, R. and Glennie, D., A system for the dynamic characterization of microstructures., Journal of Microelectromechanical Systems, Vol. 6, No. 4, pp. 322–328, 1997. [14] Chou, Y.-F. and Wang, L.-C., Modal testing for microstructures, Proceedings of the International Modal Analysis Conference - IMAC, Vol. 2, pp. 1783 – 1788, 1999. [15] Zhang, P. Q., Wang, Q. M., Tang, X. O. and Huang, T. C., Experimental research on dynamic properties of mini-small object, Proceedings of the International Modal Analysis Conference - IMAC, Vol. 2, pp. 1528 – 1535, 1991. [16] Smith, N., Tanner, D., Swanson, S. and Miller, S., Non-destructive resonant frequency measurement on MEMS actuators., 2001 IEEE International Reliability Physics Symposium Proceedings. 39th Annual, 30 April3 May 2001, Orlando, FL, USA. [17] Zhang, P. Q., Wang, Q. M., Wu, X. P. and Huang, T. C., Experimental modal analysis of miniature objects by optical measurement technique, International Journal of Analytical and Experimental Modal Analysis, Vol. 7, No. 4, pp. 243 – 253, 1992. [18] Ozdoganlar, O. B., Hansche, B. D. and Carne, T. G., A Review of Experimental Modal Analysis Methods for Microelectromechanical Systems (MEMS), Proceedings of the International Modal Analysis Conference, 2002. [19] Baskaran, R. and Turner, K. L., Mechanical domain coupled paranetric resonance and amplification in a torsional mode micro electro mechanical oscillator, Journal of Micromechanics and Microengineering, Vol. 13, No. 5, pp. 701–707. [20] Zhang, W., Baskaran, R. and Turner, K. L., Effect of cubic nonlinearity on auto-parametrically amplified resonant MEMS mass sensor, Sensors and Actuators, Vol. 102, No. 1-2, pp. 139–150, 2002. [21] Maia, N. M. M. and eSilva, J. M. M. (editors), Theoretical and Experimental Modal Analysis, Research Studies Press, Taunton, Somerset, England, 1997.
[22] Silva, J. M. M. and Maia, N. M. M., Modal Analysis and Testing, Klewer Academic Publishers, 1999. [23] Nayfeh, A. H. and Mook, D. T., Nonlinear Oscillations, John Wiley and Sons, Inc., 1995. [24] Chen, J. S., Su, C. P. and Chou, Y. F., Modal Analysis for Miniature Structures, Proceedings of the International Modal Analysis Conference, pp. 969–975, 1995. [25] Zhang, P., Tang, X., Shan, B., Brandon, J. and Kwan, A., Analytical and experimental modal analysis for operational validation and calibration of a miniature silicon sensor, Journal Of Sound And Vibration, Vol. 214, No. 5, pp. 903–913, 1998. [26] Beliveau, J., Vigneron, F., Soucy, Y. and Draisey, S., Modal parameter-estimation from base excitation, Journal of Sound And Vibration, Vol. 107, No. 3, pp. 435–449, 1986. [27] Carne, T. G., R., M. D. and Nord, A. R., A comparison of fixed-base and driven-base modal testing of an electronics package, Proceedings of the International Modal Analysis Conference, Las Vegas, Nevada, pp. 672–679, 1989. [28] Lee, J.-C. and Chou, Y.-F., Driven-base modal parameter estimation for continuous structures, Proceedings of the International Modal Analysis Conference - IMAC, Vol. 1, pp. 711 – 718, 1991.