A Benchmark for Evaluating Moving Object Indexes Su Chen School of Computing National University of Singapore
Christian S. Jensen
Dan Lin
Computer Science Aalborg University
Computer Science Purdue University
[email protected]
[email protected]
[email protected]
ABSTRACT Progress in science and engineering relies on the ability to measure, reliably and in detail, pertinent properties of artifacts under design. Progress in the area of database-index design thus relies on empirical studies based on prototype implementations of indexes. This paper proposes a benchmark that targets techniques for the indexing of the current and near-future positions of moving objects. This benchmark enables the comparison of existing and future indexing techniques. It covers important aspects of such indexes that have not previously been covered by any benchmark. Notable aspects covered include update efficiency, query efficiency, concurrency control, and storage requirements. Next, the paper applies the benchmark to half a dozen notable moving-object indexes, thus demonstrating the viability of the benchmark and offering new insight into the performance properties of the indexes.
1.
INTRODUCTION
With the increasing availability of accurate geo-positioning, e.g., using GPS receivers, and the rapid deployment of mobile devices capable of communicating wirelessly with their surroundings, it is fast becoming possible to track the current locations of large populations of moving objects, e.g., individuals with mobile phones or vehicles with on-board navigation systems. This capability opens to a wide range of applications, including a variety of monitoring applications, traffic control, tourist services, and mobile commerce. Applications such as these rely on the ability to efficiently query the current and near-future locations of moving objects. Indexing techniques are needed in order to enable such efficient querying. Existing spatio-temporal indexes fall short in meeting the challenges posed by the resulting indexing problem. In particular, when indexing the e current and near-future positions of moving objects, it becomes necessary to support querying as well as very frequent updates efficiently. Thus, a number of techniques specifically designed for indexing of the current and near-future locations of moving objects have been proposed. According to the base structure used by such indexes, most recent work can be classified into three main categories: (i) R-tree-based indexes, including the RUM-tree [24], the TPR-tree [17], and the TPR*-tree [19]; (ii) B+ -tree-based Permission to make digital or hard copies of portions of this work for personal or classroom use is granted without fee provided that copies Permission to copy without fee all or part of this material is granted provided are not made or distributed for profit or commercial advantage and that the copies are not made or distributed for direct commercial advantage, that copies bear this notice and the full citation on the first page. the VLDB copyright notice and the title of the publication and its date appear, Copyright for components of this wor k owned by others than VLDB and notice is given that copying is by permission of the Very Large Data Endowment must be honored. Base Endowment. To copy otherwise, or to republish, to post on servers Abstracting with to c redit permitted. Toand/or copy otherwise, to republish, or to redistribute lists,isrequires a fee special permission from the to post onACM. servers or to redistribute to lists requires prior specific publisher, permission and/or a fee. Request permission to republish from: VLDB ‘08, August 24-30, 2008, Auckland, New Zealand Publications Dept., ACM, Inc. Fax +1 (212)869-0481 or Copyright 2008 VLDB Endowment, ACM 000-0-00000-000-0/00/00.
[email protected]. PVLDB '08, August 23-28, 2008, Auckland, New Zealand Copyright 2008 VLDB Endowment, ACM 978-1-60558-306-8/08/08
1574
indexes, including the Bx -tree [10] and the Bdual -tree [20]; and (iii) quad-tree-based indexes, including STRIPES [16]. Numerous moving-object indexes exist, and they often come with results of empirical studies that suggest that they are capable of outperforming the competition. This renders it difficult to obtain an overview of the advantages and disadvantages of the existing indexes. It is even more difficult for the potential users of the indexes to make a decision on which index is best suited for a specific application. Therefore, there is a need for a benchmark that can offer important insight into the behavior of each technique and provide guidance on index selection and improvement. While a few benchmarks [15, 12] exist that address the same indexing problem as does this paper, these man be improved with respect to the generation of datasets and workload, and they do not consider a multi-user environment. This paper aims to establish a more comprehensive benchmark than has been seen hitherto. In particular the proposed benchmark covers a series of carefully generated datasets, a broad variety of workloads, and a standard evaluation procedure. Different datasets are employed either to measure the overall index efficiency or to simulate certain real-world scenarios. The workloads generated mix updates and queries according to the settings of several parameters. The testing procedure exhaustively evaluates index performance regarding the update efficiency, query efficiency, concurrency control, and storage requirements. The paper also reports on the results of applying the benchmark to six recent indexes spanning the aforementioned three categories. No previous studies have compared this many indexes under the same standard. The experimental results elicit the characteristics of each index and offer input to future index development. The paper is organized as follows. Section 2 describes the problem setting and reviews related work, focusing on benchmarks for moving-object indexes. Section 3 introduces the state-of-the-art moving object indexes covered in this paper. Section 4 presents the details of the proposed benchmark. Section 5 reviews details of our implementations of the indexes. Section 6 then reports on the application of the benchmark to six moving object indexes. Finally, Section 7 concludes and covers topics for further research.
2. BACKGROUND We proceed to characterize the indexing problem considered in the paper and then cover related work.
2.1 Setting We assume a setting in which each moving object belonging to large population of moving objects reports its current location to a central server. The objective is to enable services to query the current and near-future locations of the moving objects. As the server needs to maintain a reasonably accurate represen-
tation of an object’s current location, updates are assumed to be relatively frequent. To reduce the update rate and to better support queries on near-future locations, the current and near-future position of an object is modeled as a linear function from time to point locations in two-dimensional space. Such linear functions are easily obtained and are compact and thus amenable to indexing. The indexing problem considered then becomes one of indexing very large and highly dynamic sets of linear functions from time to points in two-dimensional space. In this problem setting workloads consist of frequent updates and queries, e.g., range and nearestneighbor, on the current and near-future positions of the moving objects.
2.2
Related Work
Several benchmarks have been proposed for traditional spatiotemporal databases that store static objects such as buildings and roads. In early work, Werstein [23] proposed a set of queries to test the temporal and three-dimensional capabilities as well as the spatial capabilities of a database. More recently, Tzouramanis et al. [22] proposed a benchmark for evaluating the performance of access methods for time-evolving regional data. They compared four types of quadtree-based spatio-temporal indexes using raster data. These benchmarks do not apply to moving-object databases; they target different types of data, update-operation loads, and types of queries than do by moving object applications. For moving-object databases, Theodoridis [21] proposed a benchmark that includes a database description and ten non-predictive SQL-based queries without any experimental results. D¨untgen et al. [7] have recently proposed a benchmark, BerlinMOD, that uses the Secondo DBMS for generating moving-object data. A scenario is simulated where objects move within the road network of Berlin, sampled positions from such movements are used as data. A total of 17 carefully selected, SQL-based queries make up the workload. This benchmark concerns the past, historical positions of moving objects, and it targets the evaluation of complete spatio-temporal DBMSs. Several benchmarks exist that specifically target techniques for the indexing of the current and near-future positions of moving objects. Myllymaki and Kaufman [15] proposed such a benchmark, called DynaMark. Query and update performance are measured in CPU time, as indices are assumed to be main-memory resident. Queries on near-future positions of the moving objects are considered. More recently, Jensen et al. [12] proposed a benchmark, called COST. Their workload generation differs substantially from what is proposed in this paper. Notably, they assume that objects move in Euclidean space or in a complete spatial network, and they assume that updates occur when an objects actual location differs from that known by the index by a chosen threshold, thus assuming that object locations are inaccurate, but are known with guaranteed accuracies. Our benchmark uses different actual road networks for dataset generation, and it assume accurate positions. Finally, Tao et al. [20] conduct a careful study of the query performance of general primal and dual indexes, but with little focus on update performance. None of the existing benchmarks take into account concurrency control issues and report on throughput.
3.
MOVING-OBJECT INDEXES
We review six moving-object indexes to which we will later apply the proposed benchmark: the RUM-tree [24], the TPR-tree [17], the TPR*-tree [19], the Bx -tree [10], the Bdual -tree [20], and STRIPES [16]. The TPR-tree is chosen since it is the predecessor of more than a dozen proposals for moving object indexes. The other five indexes have different base structures and are recent.
1575
3.1
R-Tree With Update Memo
Traditional spatial indexes such as the R-tree [9] and the Quadtree [8] were designed mainly with query efficiency in mind and implicitly assumed relatively static datasets. However, in our problem setting, updates are very frequent due to the need of tracking continuous movements. To render indexing techniques more suitable for workloads with frequent updates, several techniques [13, 14, 4] have been proposed to improve their update performance. A recent representative of this line of work is the RUM-tree by Xiong et al. [24]. The RUM-tree introduces a main-memory memo that makes it possible to avoid disk accesses for the deleting the old entry during an update. Therefore, the cost of an update equals the cost of an insert. In particular, object updates are ordered temporally according to the processing time. By maintaining the update memo, more than one entry for an object may coexist. Obsolete entries are deleted lazily in batch mode. Garbage collection is employed to limit the percentage of obsolete entries in the tree and to control the size of the update memo. Because the RUM-tree extends the R-tree, it indexes only point locations rather than linear functions of time. For the benchmarking, we will therefore apply the memo-based update technique of the RUM-tree to the TPR*-tree described next.
3.2 TPR-Tree and TPR*-Tree Saltenis et al. [17] proposed the TPR-tree (Time-Parameterized R-tree) that augments the R*-tree [3] (a variant of the R-tree) with velocities to index linear functions of time. Specifically, an object is represented by its position as of (global) a reference time and its velocity vector. The sides of the bounding rectangles (BRs) employed are also functions of time, and the BRs are chosen so that they bound all the contained moving objects or BRs at any time in the future (including the current time). If no updates occur on a TPR-tree, its BRs will expand, and query and update performance will deteriorate. When updates occur, objects are placed in the BRs that then now fit into, and BRs that have grown too much are tightened. Tao et al. [19] have proposed the so-called TPR*-tree, which is a variant of the TPR-tree. The TPR*-tree uses the same data structure as the TPR-tree, but applies different algorithms for maintaining the index. In particular, the algorithms aim to optimize time-range queries rather than timeslice queries, as done by the TPR-tree. And while the TPR-tree makes decisions on where to insert an object on a level-by-level basis, the TPR*-tree puts more work into insertions and makes more global decisions. In addition, the TPR*-tree is more aggressive than the TPR-tree when it comes to the tightening of BRs—while tightening costs I/O, it may save I/O subsequently.
3.3 Bx -Tree and Bdual -Tree It is well-known that the R-tree, as well as structures based on the R-tree, is prone to low update efficiency when compared to structures such as the B+ -tree. The problem is that BRs tend to overlap, which results in multiple (partial) paths from the root to the leaf level being explored during the deletion that occurs in connection with an update. This, serves as motivation for exploring B+ -tree-based techniques for the indexing of moving objects. Another source of motivation is the fact that B+ -trees are already supported widely in existing DBMSs, promising easier integration into existing systems of B+ -tree-based techniques. The first B+ -tree-based index, called the Bx -tree, was proposed by Jensen et al. [10]. The Bx -tree uses a specific data transformation to map linear functions, which may be viewed as points in fourdimensional space, to points in one-dimensional space that can be
indexed by a B+ -tree. First, a linear function is mapped to the point location that it returns when given a specific near-by time as argument. Then a space-filling curve (e.g., the Peano or Hilbert curve) is applied to obtain a one-dimensional point. A partitioned B+ -tree is used where updated positions that occur at approximately the same time go into the same partition. To support queries, original queries are subjected to transformations that counter the data transformations. These transformations involve query window enlargements that depend on the velocities of the objects indexed, the number of partitions,and the query time; a transformed query is created for each partition in the B+ -tree. To reduce the adverse effects on performance of velocity skew and outliers on performance, Jensen et al. [11] equip the Bx -tree with more careful query enlargement algorithms. Yiu et al. [25] have recently proposed the Bdual -tree, which aims to utilizes velocity information to obtain better query performance. The Bdual -tree uses a four-dimensional Hilbert curve to map both location and velocity vectors to one-dimensional point. One Bdual tree is composed of two B+ -trees, and these two trees swap states every so-called maximum update interval (the maximum time duration between any pair of updates issued by any object). Each internal entry in the Bdual -tree is associated with a set of movingobject rectangles (MORs). Each MOR is square in size and has continuous Hilbert values corresponding to the keys stored in the subtrees of the entry. These MORs can be treated as BRs as used in the TPR-tree, and hence the query algorithms of the TPR-tree can be applied to the Bdual -tree with minor modifications. However, this query algorithm is not based on that of the B+ -tree and is thus more difficult to integrated into existing database systems.
3.4
STRIPES
As the Bdual -tree, STRIPES, by Patel et al. [16], is a dual index that indexes both location and velocity data. In particular, STRIPES maps two-dimensional moving objects to four-dimensional points and indexes them by a PR bucket quad-tree [18]. The arrangement promises efficient updates and less efficient queries because a node in STRIPES may contain an arbitrarily small number of entries, meaning that relatively may pages need to be accessed to obtain a query result. The low page utilization may also leads to a large space consumption. To alleviate these problems, the authors suggest to store a leaf node with occupancy at most 50% in half of a page and leaf nodes with over 50% occupancy in a full page. However, such an arrangement not only complicates the concurrency control mechanism, but also make the integration into a DBMS more difficult.
4.
BENCHMARK
The goal of the benchmark is to extensively evaluate important aspects of a moving-object index. To do so, we carefully design the datasets and workloads to be used, and we propose a standard evaluation procedure. This section presents the details of these aspects.
4.1
Datasets and Workload Generation
Our benchmark considers object locations in the space domain of 100, 000 × 100, 000 m2 , which is sufficient to simulate objects moving in various environments such as small and large cities. We generate three types of datasets: uniformly distributed, Gaussian distributed and road-network-based datasets. Uniformly Distributed Dataset. The initial locations of objects are uniformly distributed in the space domain, and their speeds and directions are randomly chosen. Specifically, an object’s speed is randomly selected from Nsp + 1 candidate speeds ranging from 0
1576
to the maximum speed vmax , i.e., {0, vmax /Nsp , 2vmax /Nsp , . . . , vmax }. An object issues updates according to an update frequency parameter fup , which indicates how many updates are issued for an object within the maximum update interval tmu . The default value of fup is 1, denoting that each object is updated once every tmu time duration. An update contains the current location of the object, a randomly generated velocity, and the time of the update. The object’s current location in an update is computed from its previously updated location so that the object moves continuously. The uniform datasets are used for investigating the overall performance of a moving object index and the effect of various factors on the index efficiency. Gaussian Distributed Dataset. The Gaussian distributed datasets aims to capture scenarios where objects (e.g., vehicles) cluster around certain locations of interest such as prominent landmarks and shopping centers. Objects tend to slow down when approaching these locations and hence their positions follow a Gaussian-like distribution. To generate such datasets, we first randomly select a set of (static) points as locations of interest, referred to as hotspots. Around each hotspot, we define multiple speed zones as rings. Each speed zone has a speed limit proportional to its distance to its hotspot, so that inner zones have lower speeds than outer ones. A speed zone also defines the update frequency, i.e., an object updates more frequently if it moves with higher speed. An object is initially placed at a position p near a randomly selected hotspot. The distance from the object to the hotspot follows a Gaussian distribution. To ensure that objects follow a Gaussian distribution as time elapses, we generate the updates as follows. First, we find the speed zone that an object is located in and obtain a speed range [vl , vh ] and the update frequency fup accordingly. Then we generate a new position pup around the same hotspot according to the same Gaussian distribution and check whether pup is within the distance range [vl · tmu /fup , vh · tmu /fup ] to p, where tmu /fup is the estimated time between two updates. If pup is not in the above range, we regenerate pup until it satisfies the constraint. Finally, we compute the speed of the object as v = (pup − p) · fup /tmu . The update is of the form hp, v, ti, where t is the current time. The next update of this object will be issued when the object reaches pup or enters a new speed zone. Subsequent updates are generated in the same way. Road-Network-Based Dataset. This type of dataset is generated based on a digital representation of a real road network. We use the network-based moving object generator of Brinkhoff [5] with some modifications in order to accommodate the needs of our benchmark. The digital road network data used derives from the TIGER/Line files [2]. Specifically, a road is a polyline, i.e., a sequence of connected line segments. An object is initially placed on a randomly selected road segment and then moves along this segment in a randomly selected direction. The speed is generated in the same way as for uniformly distributed datasets. When the object reaches the end of the segment, an update is issued, and the object continues moving along another randomly selected connected segment. Each object is required to issue at least one update within tmu . Query Workloads. The query workloads consist of predictive queries with query times that range from the current time and tmu time units into the future. Two fundamental types of queries are considered. One is the range query that retrieves all objects whose locations fall within a rectangular region at the query time (timeslice). The other is the k nearest neighbor (kNN) query that retrieves k objects for which no other objects are nearer to the query object
at the query times.
4.2
Performance Evaluation Procedure
Our benchmark evaluates both time and space efficiency of an index in single-user and multiple-user environments. Four metrics are used: (i) the number of I/Os, (ii) CPU time, (iii) the size of an index on disk, and (iv) throughput (response time). The last metric is only used in multiple-user environments. For each dataset, an index is initialized during the first tmu time units and then runs for another 2tmu time units. Considering that tmu restricts the maximum time interval between the updates of an object, all objects must have been inserted into the index after the initialization phase, i.e., the first tmu time units. Updates are issued according to the update frequency parameter fup . A batch of 100 queries are issued every tmu /10 timestamps. We record the average index size and average query and update costs during the latter 2tmu time units. For each index, we study the following aspects.
In a multi-user environment, updates and queries are intermixed according to a proportion, which is different from the single-user time units. We use environment where queries are issued every tmu 10 a multi-threaded program to simulate multiple users. The workload is first placed in a thread pool and then randomly distributed to each thread. The performance figures returned are throughput and response time. In addition to the aforementioned experiments, we examine two more aspects. A12 Update/query ratio. The ratio varies from 1:100 to 10,000:1. This wide range of ratios covers many real scenarios, from query-intensive ones to update-intensive ones. A13 Number of threads. The number of threads varies from 1 to 256. Table 1 summarizes the parameters; the values in bold denote the default values used.
A1 Data size. The number of objects varies from 100K to 1M.
5. INDEX IMPLEMENTATION
A2 Time effect. Each index runs for another 5tmu after the initialization round. The update and query costs are averaged and collected for every tmu /10 ts (“ts” is short for timestamp.).
As a precursor to applying the benchmark to the six indexing techniques described in Section 3, we cover pertinent details of our implementations of the indexes. All the indexes were implemented in C++. To be fair, they adopted the same type of block file, buffer technique, and lock manager.
A3 Maximum object speed. The maximum speed varies from 10m/ts to 100m/ts. A4 Update frequency. The update frequency fup varies from 1 to 10, which means that each object updates for 1 to 10 times during tmu . A5 Range query size. All range queries in the query workload are square-shaped with sizes varying from 1,000×1,000m2 to 10,000×10,000m2 . A6 Number of neighbors. The number of neighbors k of the kNN queries ranges from 10 to 100. A7 Predictive query length. The predictive time of the queries varies from 0 to tmu . A8 Buffer size. An LRU buffer of 50 pages are used by default. When the size of the LRU buffer is varied, it varies from 0 to 1024KB, i.e., from 0 to 256 pages when the page size is 4KB. A9 Disk page size. The page size varies from 1K to 8K, which covers the general cases of most existing operating systems.
• RUM*-tree. Since the RUM-tree does not support predictive queries, we apply its memo-based update approach to the TPR*-tree, denoted the resulting index as the RUM*-tree. Obsolete entries in a leaf node are cleared whenever the node is accessed or the node gets the token for garbage collection. There are 10 tokens in total, and after every 1000 updates, each token is passed to another leaf node. • TPR-tree. The TPR-tree is optimized for the tmu time units into the future. Each leaf node contains a set of moving objects of the form hid, x, y, vx, vyi, where id is the identity of the object, vx, vy are its velocities along the x and y-axes, and x, y are the coordinates of the object at the reference time of the index (i.e., the time when the index was born). Each entry in an internal node consists of a child pointer pt and a bounding rectangle in the form of hxmin , xmax , ymin , ymax , vxmin , vxmax , vymin , vymax i, where min and max indicates the minimum and maximum value, respectively, in the given dimension. As we can see, internal nodes store more information than leaf nodes, and hence the fan-out of the internal nodes is smaller than that of the leaf nodes.
For the road-network-based datasets, one additional experiment is introduced to observe the effect of the network size.
• TPR*-tree. The TPR*-tree is optimized for the range query with default size (1000×1000m2 ). The TPR*-tree inherits the above TPR-tree by overloading the functions of choose subtree, split, reinsertion, and deletion. This means that the TPR*-tree has the same leaf and internal node structure and fan-out as the TPR-tree. Through overloading, we also avoid any extra performance difference between the TPRtree and the TPR*-tree caused by different implementations. The implementations of the TPR-tree and the TPR*-tree are based on the one provided by the authors of the TPR*-tree [1].
A11 Road network size. The size of a road network is defined as the sum of its nodes and edges. Three real digital roan networks are used: the Oldenburg (OL) city map has 6,105 nodes and 7,035 edges; the Singapore (SG) city map has 11,414 nodes and 15,641 edges; and the San Francisco (SA) city map has 175,343 nodes and 223,308 edges.
• Bx -tree. The Bx -tree has two partitions. The order of the Hilbert curve used for space partitioning is optimized according to the findings in [6], which is dynamically selected according to the number of objects in the dataset. The maximum update interval in the Bx -tree is the same as the optimizing time interval tmu of the TPR-tree. The iterative
When Gaussian distributed datasets are used, we aim to observe the effects of the numbers of hotspots, i.e., the numbers of clusters in the datasets. The datasets are expected to be skewed when there are few hotspots and near-uniform when there are large numbers of hotspots. A10 Number of hotspots. The number of hotspots varies from 1 to 10000.
1577
Parameter Space domain Data size Maximum object speed Maximum update interval, tmu Update frequency, fup Range query size Number of neighbors, k Query Predictive Time Time duration Buffer size (number of pages) Disk page size (KB) Number of hotspots Road network Update/query ratio Number of threads
Setting 100,000×100,000m2 100K, ..., 1M 10m/ts, ..., 100m/ts 120ts 1, ..., 10 1,000×1,000m2 , ...,10,000×10,000m2 10, ..., 100 0ts, 10ts, ..., 60ts, ..., 120ts 240ts, 600ts 50, 0, 16, 32, ..., 256 1, 2, 4, 8 1, 10, 100, 1000, 10000 Oldenburg, Singapore, San Francisco 100:1, ..., 1:100, ..., 1:10,000 1, 2, 4, ..., 256
Table 1: Parameters and Their Settings expanding query algorithm in [11] is employed to avoid excessively large query region after expansion. The velocity histogram contains 1,000×1,000 cells. • Bdual -tree. The Bdual -tree uses the same B + -tree as the Bx -tree and also has two partitions. The order of the Hilbertcurve is also optimized as that of the Bx -tree, but one degree smaller since the Bdual -tree partitions two more dimensions (the velocity dimension). The MORs are updated along with the internal nodes of the B+ -tree. In particular, the MORs of an internal entry are updated if the key range of its subtree is changed by the update. The MORs are kept in main memory while the index is active. • STRIPES. STRIPES also has two partitions similar to the other two dual-tree indexes. To improve the space utilization, the two optimization techniques provided by the authors are employed [16]: each leaf node first acquires a half page and will acquire a full page when the data exceeds half of a page; non-leaf nodes are packed together to be stored in as few disk pages as possible.
6.
EXPERIMENTAL STUDY
We proceed to report on the results of applying the benchmark to the six indexes presented in Sections 3 and 5. We first offer results for uniformly distributed datasets and then consider skewed and road-network based datasets. All experiments were conducted on a PC with Intel Core 2 Duo 2.66 GHz processor, 2 GB RAM, and a 200 GB SATA disk, running the Window XP Pro OS.
6.1
Uniformly Distributed Datasets
In this round of experiments, we examine the first nine aspects of index performance using uniformly distributed datasets. Unless specified otherwise, the query performance concerns range queries. A1 Effect of Data Size: Figures 1 and 2. Figure 1 shows the average update and range query performance of each index when varying the dataset size from 100K to 1M. As expected, both the update and query cost increase linearly with increasing dataset size for all indexes. This is because more objects need to be retrieved in a given query region for a larger dataset. We also observe several differences in performance among the indexes. The reasons are detailed as follows.
1578
- The TPR-tree and the TPR*-tree have the best query performance, but also exhibit the worst update performance. The low update performance is mainly due to the overlap being followed in deletions among bounding rectangles, which result in multiple search paths. - Compared to the TPR*-tree, the RUM*-tree improves the update. However, this occurs at the expense of higher query cost. By simplifying an update to an insertion and a delayed deletion, the RUM*-tree reduces the overall update cost. On the other hand, obsolete entries left in the tree degrade the query performance. - The Bx -tree and the Bdual -tree both achieve the best update I/O performance. They benefit from their base structure, the B+ tree, in which only a single path needs to be searched during deletions (and insertions). The Bdual -tree is generally slower than the Bx -tree for updates due to the time-consuming computation of MORs. While, the Bdual -tree and the Bx -tree similar query I/O performance, the query time cost of the latter is much higher. The query performance will be considered in detail when we study aspect A5. - STRIPES has low update I/O cost that is comparable to that of the B+ -tree-based indexes. The query time is also as low as those of the R-tree based indexes. However, in comparison with the other indexes, the update time of the STRIPES increases faster, possibly because the quad-tree becomes taller and taller with increasing numbers of objects. An update then has to follow a long path to get a leaf node. The query I/O of STRIPES is the highest among all indexes due to the low space utilization, as shown in the Figure 2. The left graph in Figure 2 shows the storage requirements of the indexes with respect to data size. - The STRIPES requires the most space due to its unbalanced index structure. Although STRIPES employs several space optimization techniques, its space utilization is low in comparison with the other balanced index structures. - Except for STRIPES, all the indexes are similar in size. The size of the RUM*-tree is the second largest one because it generally contains a number of obsolete entries. The TPR-tree and the TPR*-tree require nearly the same disk space since they have the same node structure. So do the Bx -tree and the Bdual -tree.
2 STRIPES TPR
TPR* RUM*
25 Update I/O
x B dual
STRIPES TPR
B
20 15 10
250
TPR* RUM*
STRIPES TPR
x B dual
TPR* RUM*
1.5
1
150 100
0.5
50
0 100 200 300 400 500 600 700 800 900 1000 Number of Objects (K)
STRIPES TPR
B
200
5 0 100 200 300 400 500 600 700 800 900 1000 Number of Objects (K)
20
x B dual
B
Query Time (ms)
x B dual
B
Update Time (ms)
30
Query I/O
35
0 100 200 300 400 500 600 700 800 900 1000 Number of Objects (K)
TPR* RUM*
15
10
5
0 100 200 300 400 500 600 700 800 900 1000 Number of Objects (K)
Figure 1: A1 Effect of Data Size 120
x B dual
STRIPES TPR
x
16
TPR* RUM*
dual
B
STRIPES
B
TPR
TPR*
RUM*
14 Index Size (MB)
Index Size (MB)
100 B 80 60 40
12 10
20
8 6 4
0 100 200 300 400 500 600 700 800 900 1000 Number of Objects (K)
2 120
180
240
300
360
420 480 Index Life Time(ts)
540
600
660
720
Figure 2: A1-A2 Index Size 11
0.8 x
dual
B
10
STRIPES
B
TPR
TPR*
Update Time (ms)
8 7 6 5 4
STRIPES
B
B
0.7
9 Update I/O
dual
x
RUM*
TPR
TPR*
RUM*
0.6 0.5 0.4 0.3 0.2 0.1
3 2 120
180
240
300
360
420 480 Index Life Time(ts)
540
600
660
0 120
720
180
6 dual
x
70
STRIPES
B
B
TPR
TPR*
240
x
dual
B
RUM*
300
360
420 480 Index Life Time(ts)
STRIPES
B
540
TPR
600
TPR*
660
720
RUM*
5 Query Time (ms)
50 40 30
4 3 2 1
20 10 120
180
240
300
360
420 480 Index Life Time(ts)
540
600
660
720
0 120
180
240
300
360
420 480 Index Life Time(ts)
540
600
660
720
Figure 3: A2 Effect of Time 0.8
x
STRIPES TPR
B 0.7 Bdual
TPR* RUM* Update Time (ms)
Update I/O
STRIPES TPR
6 5 4 3
70
TPR* RUM*
x
0.6
0.4 0.3
20
30
40 50 60 70 Max Velocity (m/s)
80
90
100
40 30 20
0.2
10
0 10
4 x B 3.5 Bdual
TPR* RUM*
50
0.5
0.1
2
STRIPES TPR
B 60 Bdual
Query I/O
x B dual
B
7
Query Time (ms)
8
20
30
40 50 60 70 Max Velocity(m/s)
80
90
100
TPR* RUM*
2.5 2 1.5 1 0.5
0 10
STRIPES TPR
3
0 10
20
30
40 50 60 70 Max Velocity (m/s)
80
90
100
10
20
30
40 50 60 70 Max Velocity (m/s)
80
90
100
9
10
Figure 4: A3 Effect of Maximum Object Speed 0.6 STRIPES TPR
TPR* RUM* Update Time (ms)
0.5
6 5 4 3 2
x B dual
STRIPES TPR
B
TPR* RUM*
60
2
3
4 5 6 7 Update Frequency
8
9
10
STRIPES TPR
TPR* RUM*
0.4 0.3
40 30
0.2
20
0.1
10
2
3
4 5 6 7 Update Frequency
8
9
10
TPR* RUM*
2.5 2 1.5 1
0 1
2
3
4 5 6 7 Update Frequency
Figure 5: A4 Effect of Update Frequency
1579
STRIPES TPR
0.5
0 1
x B dual
3 B
50
0 1
3.5
x B dual
B
Query Time (ms)
x B dual
B
7
Query I/O
8
Update I/O
Query I/O
60
8
9
10
1
2
3
4 5 6 7 Update Frequency
8
- However, the sizes of the R-tree based indexes are slightly smaller than those of the B+ -tree-based ones. This is because the Bx -tree and the Bdual -tree need to store one more field for each object: the key value, i.e. the Hilbert value, resulting in a smaller leaf fan-out.
tmu time units increases from 1 to 10. When tmu is 120ts, for a 100K dataset, the number of updates during each timestamp varies to 100K , in increment of 100K . From the figure, we from 100K 120 12 120 can observe that all indexes to varying degrees exhibit better overall performance when updates are more frequent. The possible reasons are the following.
A2 Effect of Time: Figures 2 and 3. The right graph in Figure 2 shows the effect of time on the index size. As we can see, STRIPES is significantly affected by the passing of time. The size of STRIPES shows periodical change due to dual-tree structure. Its space utilization is best when the two trees are balanced. Actually, the Bx -tree and the Bdual -tree, both of which are also dual-tree structures, exhibit similar changes in size, but these are not as pronounced as that of STRIPES. In contrast, the size of the TPR-tree and the TPR*-tree are barely affected by the passing time. Figure 3 shows index performance as a function of time. In what follows, we only explain the behavior of each individual index. We defer the discussion on the performance differences among the indexes to the section covering A5. - The update cost (I/Os and CPU time) of the TPR-tree and the TPR*-tree keeps increasing with time for the time duration considered in the experiment. This maybe due to the increased overlaps among the BRs. Although the TPR*-tree aims to improve the TPR-tree’s performance by shrinking the BRs more often to bound the objects more tightly, frequent BR adjustments introduce additional update I/Os. However, as we can see, the overall gain in query performance is not obvious. The difference between the two indexes is not very significant. - Updates in the RUM*-tree incur the least I/O cost among all the indexes. The main reason is that the RUM*-tree eliminates the costly deletion from the update. However, the delayed deletions deteriorate the query performance. - All the dual-tree structures, i.e., the Bx -tree, the Bdual -tree, and STRIPES, demonstrate similar periodic patterns for both update and query performance. The performance is best when all objects are in one partition of the index while the other partition is empty. Regarding the update time, an update in the Bx -tree and STRIPES is too fast to make the periodic change visible. A3 Effect of Maximum Object Speed: Figure 4. Figure 4 shows the results of varying the maximum object speed from 10m/ts to 100m/ts. Increasing object speed leads to increasing query costs for all indexes but does not affect the update performance of the Bx -tree, the Bdual -tree, and STRIPES. The update costs of the R-tree based indexes increase linearly with the maximum object speed. This is because higher speeds lead to faster expansions of bounding rectangles. More updates in the workloads would reduce the expansions due to more frequent tightening. Consequently, more overlaps occur and more (partial) paths need to be accessed during updates. We also observe that the RUM*-tree incurs the least update I/O and that the growth rate is also smaller than that of the other two due to the reasons mentioned in A1. In comparison to the others, the STRIPES and the Bdual -tree are less affected by the objects’ speed, probably because both take advantage of object velocity while indexing. A4 Effect of Update Frequency: Figure 5. In Figure 5, we vary the update frequency fup from 1 to 10, which means that the number of updates issued by an object during
1580
- When updates are frequent, the BRs in the TPR-tree, TPR*-tree, and RUM*-tree are tightened frequently, and hence they bound objects more closely, which leads to better update and query performance. - The Bx -tree, the Bdual -tree, and STRIPES all exhibit a minor improvement in update I/O with more frequent updates. These improvements are mainly caused by the presence of the LRU buffer. When an object issues updates frequently, the changes in its positions are likely small, and the updated object will be stored in the same leaf node with relatively high probability. If the leaf node is already cached in the buffer, the I/O cost is reduced. In both the Bx -tree and STRIPES, the update time is extremely short , and hence we cannot see the changes for varying update frequency. Unlike the Bx -tree and STRIPES, the Bdual -tree benefits more from a high update frequency. Each update on the internal node of the B+ -tree requires recomputation of the corresponding MORs. As objects are updated more frequently, the update I/O decreases, and the time spent for recomputing MORs also decreases. Since the I/O is reduced by the LRU buffer, the savings in the computational time are more significant. A5 Effect of Range Query Size: Figure 6. In this experiment, we investigate the effect of query sizes by varying the square window from 1,000 × 1,000m2 to 10,000 × 10,000m2 . As expected, the results in Figure 6 show that the query cost of each index increases with an increasing query window size. Larger windows contain more objects and therefore lead to more node accesses. In the following, we discuss the performance difference among the indexes. - The TPR-tree and the TPR*-tree perform similarly and have the lowest I/O cost. - The query cost of the RUM*-tree is a little higher than that of the TPR*-tree mainly because of the existence of obsolete entries in the RUM*-tree. - The Bx -tree has query I/Os similar to the TPR-tree and the TPR*tree. This is because the Bx -tree uses the iterative query enlargement algorithm, which reduces the number of false hits as well as the query I/Os. However, the query time of the Bx -tree is slightly higher compared to other indexes, with the exception of the Bdual -tree. This is possibly caused by the complex computation of converting a 2-dimensional query range to a 1dimensional interval and iterative query enlargements. - Surprisingly the query I/O of the Bdual -tree is much higher than that of the Bx -tree. A possible reason could be that the partitioning in the velocity dimensions results in some nearby objects with different velocities being distributed among different leaf nodes, while in the Bx -tree, nearby objects are clustered together. The query processing time of the Bdual -tree is also higher, but is affected less than the others. This is not only because it has higher query I/Os, but also because checking the intersections between queries and large number of MORs is timeconsuming.
x B dual
STRIPES TPR
B
5
TPR* RUM*
100
x B dual
STRIPES TPR
B
60
3 2
7
TPR* RUM*
70 60 50
20
x
STRIPES TPR
B 80 Bdual
4 3 2
20
30
40
50
60
70
80
90
100
10
20
30
40
k
50
60
70
80
90
100
k
Figure 7: A6 Effect of Number of Neighbors 4 x B 3.5 Bdual
TPR* RUM* Query Time (ms)
70 Query I/O
TPR* TPR*-RUM
0 10
Figure 6: A5 Effect of Range Query Size 90
STRIPES TPR
5
1
30
20 0 1000 2000 3000 4000 5000 6000 7000 8000 9000 10000 1000 2000 3000 4000 5000 6000 7000 8000 9000 10000 Range Query Side Length (m) Range Query Side Length (m)
x B dual
6 B
40
1
40
STRIPES TPR
80 Query I/O
Query Time (ms)
80
x
B 90 Bdual
TPR* RUM*
4
100
60 50 40 30 20
STRIPES TPR
TPR* RUM*
3 2.5 2 1.5 1 0.5
10
0 20
40
60
80 100 120 140 160 180 200 Query Predictive Time(ts)
20
40
60 80 100 120 140 160 180 200 Query Predictive Time(ts)
Figure 8: A7 Effect of Query Predict Time x B dual
STRIPES TPR
B
0.7
TPR* RUM*
STRIPES TPR
TPR* RUM*
90 80
15
10
0.5 0.4 0.3 0.2
STRIPES TPR
4 x B 3.5 Bdual
TPR* RUM*
60 50 40 30
3 2.5 2 1.5 1
0 64
128 256 Buffer Size(KB)
512
1024
TPR* RUM*
0.5
10 0
STRIPES TPR
20
0.1
5
x B dual
B
70 Query I/O
Update Time (ms)
20 Update I/O
100
x B dual
0.6 B
Query Time (ms)
25
0 0
64
128 256 Buffer Size(KB)
512
1024
0
64
128 256 Buffer Size(KB)
512
1024
0
64
128 256 Buffer Size(KB)
512
1024
Figure 9: A8 Effect of Buffer Size 0.8
TPR* RUM* Update Time (ms)
14 Update I/O
x B dual
0.7 B
12 10 8 6
STRIPES TPR
180
TPR* RUM*
0.5 0.4 0.3
80 60
0.1
20
0
0
0
4
8
1
2
Page Size (KB)
4
8
x B dual
B
5
100
2 2
TPR* RUM*
120
40
1
6 STRIPES TPR
140
0.6
0.2
4
x
B 160 Bdual
Query Time (ms)
STRIPES TPR
B
16
Query I/O
x B dual
18
STRIPES TPR
TPR* RUM*
4 3 2 1 0
1
2
Page Size (KB)
4
8
1
2
Page Size (KB)
4
8
Page Size (KB)
Figure 10: A9 Effect of Disk Page Size
(a) 1 hotspots
(b) 10 hotspots (c) 100 hotspots Figure 11: Uniform and Gaussian Datasets 0.6 TPR* RUM* Update Time (ms)
8
0.5
6 4 2
x B dual
B
180 STRIPES TPR
TPR* RUM*
160
0.3 0.2
10
100 1000 Number of Hotspots
10000
STRIPES TPR
TPR* RUM*
120 100 80 60
0 1
4 x B dual
B
10
100 1000 Number of Hotspots
10000
TPR* RUM*
3
2 1.5 1
20
0.5 0 1
10
100 1000 Number of Hotspots
Figure 12: A10 Effect of Number of Hotspots
1581
STRIPES TPR
2.5
40
0 1
x B dual
3.5 B
140
0.4
0.1
0
(d) 10000 hotspots
Query Time (ms)
STRIPES TPR
B
Query I/O
x B dual
10
Update I/O
Query I/O
120
Query Time (ms)
140
10000
1
10
100 1000 Number of Hotspots
10000
- Among all the indexes, STRIPES has the highest I/O cost. The main reason is that STRIPES needs to access more nodes to find the same number of objects, which is due to its low space utilization. In addition, the low space utilization also weakens the effect of the buffer. However, due to its simple structure and query processing algorithm, the query processing of the STRIPES is even faster than that of the Bx -tree. A6 Effect of Number of Neighbors: Figure 7. Considering kNN queries, all indexes exhibit slight increases in I/O costs and query processing time. Figure 7 shows the same relative performance among the indexes as does Figure 6 (range queries). In the case of the Bx -tree, a kNN query is processed using incremental range queries. Due to the difficulty of in estimating the initial search radius, the query range may be extended several times in order to find all the neighbors. Such repeated range queries result in a an increased query processing time while the I/O cost remains unchanged due to the buffer. A7 Effect of Query Predictive Time: Figure 8. Figure 8 shows the effect of the query predictive time interval, which is varied from 0 to 120ts. It is not surprising that the query costs of all the indexes increase as the predictive query length increases. This is so because either BRs or query ranges need to be enlarged when the predictive query length increases. However, the effect on the Bx -tree is most significant. This is because only the Bx -tree processes a predictive query through query enlargement. A longer predictive time leads to a larger query region and hence a larger number of false positives in it, which introduces more I/O and longer time. Again, the Bdual -tree and STRIPES, which index objects in the dual space, are less affected by the query predictive time, since the MOR and quadrant enlargement, supervised by the velocity constraints, are relatively small. A8 Effect of Buffer Size: Figure 9. We vary the number of buffer pages from 0 to 256. As shown in Figure 9, the time cost is relatively stable since it is mainly determined by the query algorithms used by the indexes, while the I/O cost of some indexes can be reduced substantially by using a small buffer (e.g, 32 pages); after certain point, the effect of increase of the buffer is negligible. In what follows, we discuss why some indexes benefit more from a larger buffer. - The three R-tree based indexes save sub a lot of update I/Os by using the buffer. This is because they need to read and write several internal nodes for each update—the costs of accessing such nodes are saved if the nodes are already in the buffer. Moreover, an update in the TPR*-tree is always slower than that in the TPR-tree, which conforms the fact that an update in the TPR*tree is more complex than the TPR-tree. We also observe that the buffering has less of an effect on the query performance. - The Bx -tree saves much query I/Os with buffering, since some of the nodes are searched repeatedly during a query. Its update performance is almost independent of the buffer size because an insertion or a deletion only needs to access a single path in the index. A9 Effect of Disk Page Size: Figure 10. Figure 10 shows the effect of varying the disk page size from 1k to 8k. With a larger page size, fewer I/Os are required for the same operation while more time is needed to check the larger number of objects in each node.
1582
- For all indexes, both the update I/O and the query time decrease with an increasing page size. The reason is straightforward. With larger pages, the number of I/Os required for a query decreases and so does the processing time. - In terms of the update time, the TPR-tree and the TPR*-tree both benefit from a small page size, i.e, 1KB or 2KB. A larger page contains more objects that need to be accessed for each update. There is a higher probability of having to update the MBRs all the way back to the root during an update. Therefore, it takes more time. However, with the help of an LRU buffer, most internal nodes may be kept in main memory, and the update I/O does not increases. - It seems that the RUM*-tree performs best when the disk page size is 4KB. This may be due to the settings of the RUM*-tree in the experiments. As 10 tokens are used for garbage collection, the cleaning frequency may be too low for the 1K and 2K pages where there are many leaf nodes; and it may occur too often for the 8K pages (few leaf nodes). Keeping too many obsolete entries will decrease the efficiency of the index, while performing the cleaning too often will slow down the updates. Tuning the parameters of the RUM*-tree’s garbage collection may help to relieve the deterioration.
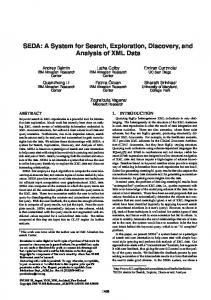
6.2 Gaussian Distributed and Road-NetworkBased Datasets In this section, we investigate index performance in Gaussian distributed and Road-network-based datasets. A10 Effect of Number of Hotspots: Figure 12. We first investigate performance while varying the number of hotspots from 1 to 10,000. Figure 11 visualizes some of the datasets used in this set of experiments, and Figure 12 shows the results. Note that in the dataset with 10,000 hotspots, objects are nearly uniformly distributed. The performance of all the indexes demonstrates similar trends as that for the uniform datasets. - The update costs of the TPR-tree and the TPR*-tree decrease with the increasing numbers of hotspots resulting in datasets that become more and more uniform. In comparison to the TPR*tree, the RUM*-tree has a more steady update performance. - The Bx -tree requires more update I/Os when the data is more skewed. As mentioned in Section 3, the granularity of space partitioning for the Bx -tree is optimized for the number of objects in the dataset. When data become more skewed, the object density around the hotspots becomes higher. Many objects are indexed in the same cell with the same indexing key, leading to overflow pages that adversely affect the performance. - In comparison with the Bx -tree, the update costs of the Bdual tree and STRIPES are affected less by the skewed data distribution. This may be because both of them consider the object velocity in partitioning, which weakens the influence of space distribution on the updates. - In terms of queries, all indexes require more query I/Os when there are less hotspots, i.e, the data becomes less uniformed. We observe that the query I/Os of the Bx -tree increases fastest among all indexes when data becomes more skewed. This is due to the fixed space partitioning of the Bx -tree. The Bdual -tree and STRIPES, both of which partitions the dual space (i.e, location and velocity), exhibit slower increases in query I/Os in comparison to that of the Bx -tree. As for the R-tree based indexes, the
(a) OL
(b) SG
(c) SA
Figure 13: Road Network 0.8
TPR* RUM*
15
10
5
0 OL
SG Road Network
x
B 0.7 Bdual
STRIPES TPR
80
TPR* RUM*
70
0.6
60
0.5
50
0.4 0.3
0.1
10
0
0 SG Road Network
SA
2.5
TPR* RUM*
x B dual
B
STRIPES TPR
TPR* RUM*
2
30 20
OL
STRIPES TPR
40
0.2
SA
x B dual
B
Query Time (ms)
STRIPES TPR
Query I/O
x B dual
B
Update Time (ms)
Update I/O
20
1.5 1 0.5 0
OL
SG Road Network
SA
OL
SG Road Network
SA
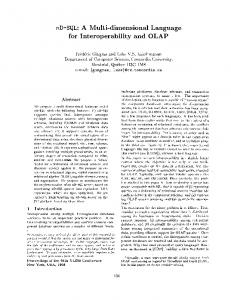
Figure 14: A11 Effect of Road Network query I/Os increases at the similar, slow rate. Since the R-tree based indexes form MBRs based on data distribution, the data skew has the relatively small influence on them. A11 Effect of Network Size: Figure 14. This experiment examines the effect of network size by using three real maps of different sizes (OL < SG < SA), as shown in Figure 13. The results are shown in Figure 14, where we can observe that the performance is not affected by the size of the network. To obtain a better understanding of this behavior, we first analyze the features of each dataset. - The OL network is the smallest. The nodes are distributed more evenly in space and hence the average length of each edge is the longest. This in turn results in less updates for each object. - The SA network contains the largest number of nodes and edges, and hence it has relatively short edges. Also, the distribution of the nodes is more skewed than for the OL and SG networks where we can see that a large number of objects concentrate in the central part of the network. Therefore, objects in the SA dataset have the highest update frequency and are very skewed. - The SG dataset has an in-between size and hence a moderate update frequency. The object distribution is close to uniform in most parts of the network. Figure 14 suggests a complex effect of the road network on the index performance. The size of the network affects the update frequency while the shape of the network determines the distribution of the objects. The index performance is affected by both factors, each of which was discussed in A4 and A10. - Considering updates, the TPR-tree and the TPR*-tree both perform the best with the OL dataset and the worst with the SA dataset. This is because of the joint effect of the update frequency and the data skew. The update cost of all the other indexes remains nearly the same for the three networks, since the object distribution barely affects the their update costs (Figure
1583
12 in A10) and since the impact of the update frequency on their update costs is also small, i.e., less than one I/O, as shown in Figure 5. - In terms of the query cost, all indexes perform the best in the SG dataset and worst in the OL dataset, which is consistent with that the SG datasets has a balance between the update frequency and the object distribution.
6.3 Concurrency Control Finally, we evaluates all the index in a multi-user environment. The performance is measured according to two metrics: throughput and response time. The throughput is defined as the average number of tasks finished in a unit time (1ts). A12 Effect of Update/Query Ratio: Figure 15. Figure 15 shows the effect of update/query ratio. We can observe that the throughput of all indexes increases when there are more updates and fewer queries. The reason is that an update usually can be executed more quickly than a query. Hence, during the same duration of time, more operations can be finished if most of these operations are updates. With the increase of the throughput, it is natural that the response time decreases a little. Next, we discuss the performance differences among all the indexes. - The Bx -tree exhibits the largest throughput. This is because it performs very fast for updates and relatively fast for queries. And also the concurrency control mechanism of the B+ -tree is more efficient than those of the R-tree and the quad-tree. - STRIPES achieves the second highest throughput since it has similar update and query performance as the Bx -tree. Moreover, the unbalanced quad-tree in STRIPES has more levels and hence concurrent operations are more likely to be performed at different levels of the tree. - The TPR-tree and TPR*-tree yield lower throughput than the Bx tree and the STRIPES mainly due to their relatively low update performance.
6000 4000 2000 0 0.01
12000
x
B dual B STRIPES TPR TPR* RUM*
20 15 10 5
400
x
B dual B STRIPES TPR TPR* RUM*
10000 8000 6000 4000 2000
1 10 100 Update/Query Ratio
1000
10000
0.01
0.1
1 10 100 Update/Query Ratio
1000
10000
250 200 150 100
0 1
Figure 15: A12 Effect of Update/Query Ratio
Update I/O Update time Range query I/O Range query time kNN query I/O kNN query time Storage space Concurrency access (response time)
300
50
0 0.1
x
B dual B STRIPES TPR TPR* RUM*
350 Response Time (ms)
8000
25
x
B dual B STRIPES TPR TPR* RUM*
Throughput
Throughput
10000
Response Time (ms)
12000
2
4
8 16 32 64 Number of Threads
128
256
1
2
4
8 16 32 64 Number of Threads
128
256
Figure 16: A13 Effect of Number of Threads
RUM*-tree 0.9-2.3 6-16 2-5 1.1-2.4 2.5-2.6 2-2.2 1.1-1.2 2-30
TPR-tree 0.7-7 8-17 1 1 1 1 1 3.5-6.5
TPR*-tree 0.7-7.7 8-18 1 1 1 1 1 5-10
Bx -tree 1 1 0.8-1.8 1.1-1.6 1.1-1.3 1.5-2 1.1-1.2 0.4-1.6
Bdual -tree 1 1.2-8 2-9 1.2-3 2.3-2.5 3.7-5.1 1.1-1.2 1.5-2.2
STRIPES 1.1-1.3 0.9-1.2 2.5-10 0.9-1.5 3.3-3.5 1.4-1.5 3.2-4 1
Table 2: Performance Summary - Although the concurrency control in the B+ -tree is efficient, the Bdual -tree has the lowest throughput. This is because the Bdual tree holds the nodes for a longer time to handle each update. - The RUM*-tree has a low throughput when queries constitute the majority of the workload. However, as the proportion of updates in the workload increases, the throughput of the RUM*tree shows the largest increase in throughput, simply because updates in the RUM*-tree are quite fast. A13 Effect of the Number of Threads: Figure 16. Figure 16 shows the performance of the indexes with various degree of concurrency when the update/query ratio is fixed at 100:1. Observe that the throughputs of all the indexes peak at about 1 or 2 threads and then decrease when there are more threads. The main reason is that an update exclusively locks the node being accessed. When the update frequency is high, multiple threads may compete for the right to access the same node, meaning that it takes more time for each thread to successfully execute an operation. Also, some time is wasted on frequent thread switching. Therefore, the increase in the number of threads will not help with the throughput, but may even degrade the overall performance. This is also the reason why the response time increases nearly exponentially with the number of threads. - The Bx -tree again achieves the highest throughput and shortest response time among the indexes for the same reason as explained in A12. - STRIPES has a moderate throughput, which is higher than that of the TPR-tree, the TPR*-tree, and the Bdual -tree. The impact of increasing number of threads on the STRIPES is less pronounced when comparing to the others. Because of the quad-tree structure, STRIPES is unbalanced. Locks are distributed among different level of the tree. - Apparently, the TPR-tree outperforms the TPR*-tree in concurrent operations. The TPR*-tree accesses more internal nodes than the TPR-tree for each insertion and deletion. Although such additional I/O cost is relieved by the buffering in a single thread environment, the problem is hard to solve in a multi-threaded
1584
environment, where the TPR*-tree locks the internal nodes more often than the TPR-tree does. - The performance of the RUM*-tree surpasses all the other indexes except the Bx -tree when there is no more than 32 threads. In addition to the internal nodes of the tree, the threads have to compete for the update memo as well. Therefore, the throughput of the RUM*-tree degrades fast with more working threads.
6.4 Result Summary Table 2 presents an overall comparison of the six indexes with respect to a total of eight different performance aspects, as listed in the leftmost column. For each row in the table, an entry with value ”1” indicates that the corresponding index usually performs the best regarding the specific aspect, while an interval “a-b” in other entries indicates that the corresponding index is a to b times more expensive than the best index. For example, the first row summarizes the update I/O performance across all experiments. We can see that the Bx -tree and Bdual -tree both have value “1”, which indicates that they generally outperform the other indexes. As for the TPR-tree, an interval “0.7 − 7” means the update cost of the TPR-tree is 70% of that of the Bx -tree in the best case and is about 7 times higher than that of the Bx -tree in the worst case. Generally speaking, in each entry, a smaller number and a smaller range of the interval indicates a better and more stable performance. To summarize, we have the following interesting findings from Table 2. - With some restriction on the storage, if an application needs to deal with a large number of updates, but relatively few queries, the Bx -tree is a good choice since it performs the best among all indexes in terms of both update I/Os and update time and it requires relatively little storage space. This is also true in the multi-user environments where we can see that the Bx -tree exhibits almost the least response time. - If an application has to handle more queries than updates, the TPR-tree is the proper one since it beats all the others with a stably efficient query performance regardless the query types. - If the composition of the workload is not unknown and the storage space is not a concern, STRIPES is a good choice since it has
relatively good, if not optimal, update and query performance in most situations.
7.
SUMMARY AND FUTURE RESEARCH
This paper proposes a benchmark for the study of important performance properties of techniques for the indexing of the current and near-future positions of moving objects. The benchmark includes a dataset and workload generator, as well as definitions of experiments. The parameters that control the datasets and workloads are varied considerably with the goal of covering a wide range of settings, the idea being to obtain a better understanding of the strengths and the weaknesses of an index under varying circumstances. The paper also reports on the application of the benchmark to six recent moving-object indexes, thus offering findings that can serve as guidelines for choosing a proper index for a specific application. The current benchmark implicitly assumes that the object positions stored in an index are accurate. This is in accord with the assumptions made by many existing indexes. In practice, however, only inaccurate current object positions can be stored in an index. It is thus of interest to take into account the inaccuracies of object positions in both indexes and benchmarks. For example, an approach may be used where it is assumed that each moving object is aware of both its actual position and the position stored in the index; the object then updates the index as needed in order to maintain an agreed-upon accuracy guarantee for the position known by the index [12]. Different objects may have different accuracy guarantees, and these may vary across time. This yields update workloads that differ from the ones currently covered. We feel that the property of index robustness is very important— a single, robust index is probably more likely to be useful in practice than a less robust index that may perform much better under certain circumstances, but that performs poorly under other circumstances. One approach to increase the focus on robustness is to identify systematically any uniformity assumptions and solution parameters employed by an index. One may then consider whether realistic datasets and workloads exist where the uniformity assumptions are not met and then consider the consequences. For each parameter, one may also consider whether realistic datasets and workloads exist that render the parameter difficult to set or even render it impossible to identify a single, good setting. Studies along these lines may yield additional benchmark datasets, workloads, and experiments aimed specifically at the study of robustness.
8.
ACKNOWLEDGMENTS
This work, as part of the SpADE project, was in part funded by ASTAR SERC under Grant 032-101-0026. Thanks to the authors of the TPR*-tree and the RUM-tree for providing us with their source code.
9.
SOURCE CODE AND DATA
Code and data used in the paper are available at http://www. comp.nus.edu.sg/∼spade/benchmark.
10.
REFERENCES
[1] TPR*-tree. http://www.rtreeportal.org/code.html. [2] U.S. Census Bureau - TIGER/Line. http://www.census.gov/geo/www/tiger/. [3] N. Beckmann, H. P. Kriegel, R. Schneider, and B. Seeger. The R*-tree: an efficient and robust access method for points and rectangles. In Proc. ACM SIGMOD, pp. 322–331, 1990.
1585
ˇ [4] L. Biveinis, S. Saltenis, and C. S. Jensen. Main-memory operation buffering for efficient r-tree update. In Proc. VLDB, pp. 591–602, 2007. [5] T. Brinkhoff. A framework for generating network-based moving objects. GeoInformatica, 6(2): 153–180, 2002. [6] S. Chen, B. C. Ooi, K. L. Tan and M. A. Nascimento. The ST2 B-tree: A Self-Tunable Spatio-Temporal B+ -tree Index for Moving Objects. Proc. ACM SIGMOD, pp. 29–42, 2008. [7] C. D¨untgen, T. Behr, and R. H. G¨uting. BerlinMOD: a benchmark for moving object databases. Technical Report 340, FernUniversit¨at Hagen, Germany, 2007. [8] R. A. Finkel and J. L. Bentley. Quadtrees: A data structure for retrieval on composite keys. Acta Inf., 4(1): 1–9, 1974. [9] A. Guttman. R-Trees: a dynamic index structure for spatial searching. In Proc. ACM SIGMOD, pp. 47–57, 1984. [10] C. S. Jensen, D. Lin, and B. C. Ooi. Query and update efficient B+ -tree based indexing of moving objects. In Proc. VLDB, pp. 768–779, 2004. [11] C. S. Jensen, D. Tieˇsyt˙e, and N. Tradiˇsauskas. Robust B+ -tree-based indexing of moving objects. In Proc. MDM, p. 12 (9 pages), 2006. [12] C. S. Jensen, D. Tieˇsyt˙e, and N. Tradiˇsauskas. The COST benchmark—comparison and evaluation of spatio-temporal indexes. In Proc. DASFAA, pp. 125–140, 2006. [13] D. Kwon, S. Lee, and S. Lee. Indexing the current positions of moving objects using the lazy update. In Proc. MDM, pp. 113–120, 2002. [14] M. L. Lee, W. Hsu, C. S. Jensen, B. Cui, and K. L. Teo. Supporting frequent updates in R-trees: a bottom-up approach. In Proc. VLDB, pp. 608–619, 2003. [15] J. Myllymaki and J. Kaufman. DynaMark: a benchmark for dynamic spatial indexing. In Proc. MDM, pp. 92–105, 2003. [16] J. M. Patel, Y. Chen, and V. P. Chakka. STRIPES: An efficient index for predicted trajectories. In Proc. ACM SIGMOD, pp. 637–646, 2004. ˇ [17] S. Saltenis, C. S. Jensen, S. T. Leutenegger, and M. A. Lopez. Indexing the positions of continuously moving objects. In Proc. ACM SIGMOD, pp. 331–342, 2000. [18] H. Samet. The design and analysis of spatial data structures. Addison-Wesley, Boston, MA, USA, 1990. [19] Y. Tao, D. Papadias, and J. Sun. The TPR*-tree: an optimized spatio-temporal access method for predictive queries. In Proc. VLDB, pp. 790–801, 2003. [20] Y. Tao and X. Xiao. Primal or dual: which promises faster spatiotemporal search?, The VLDB Journal, 18 pages, to appear. [21] Y. Theodoridis. Ten benchmark database queries for location-based services. The Computer Journal, 46(6): 713–725, 2003. [22] T. Tzouramanis, M. Vassilakopoulos, and Y. Manolopoulos. Benchmarking access methods for time-evolving regional data. Data Knowl. Eng., 49(3): 243–286, 2004. [23] P. Werstein. A performance benchmark for spatiotemporal databases. In Proc. Annual Colloquium of the Spatial Information Research Centre, pp. 365–373, 1998. [24] X. Xiong and W. G. Aref. R-trees with update memos. In Proc. ICDE, p. 22, 2006 (extended version to appear in The VLDB Journal). [25] M. L. Yiu, Y. Tao, and N. Mamoulis. The Bdual -tree: indexing moving objects by space-filling curves in the dual space. The VLDB Journal, 17(3): 379–400, 2006.