A Collaborative Framework for Annotating Energy Datasets ˆ Cao Hˆong-An
Tri Kurniawan Wijaya, Karl Aberer
Nuno Nunes
Department of Computer Science ETH Zurich, Switzerland Email:
[email protected]
Department of Computer Science EPFL, Switzerland Email: {tri-kurniawan.wijaya, karl.aberer}@epfl.ch
Madeira Interactive Technologies Institute Funchal, Portugal Email:
[email protected]
determine when and which appliances are triggered together to perform those activities. This would enable us to give energy savings recommendations at the activity level and extend the range of measures to improve energy efficiency. A user would thereafter be able to optimize their energy consumption to their own individual needs, thus, making choices that cut the energy bill without sacrificing quality of life. Learning users’ activities requires determining when humans are interacting with appliances. While static thresholding has been used in prior work [4, 5], these methods are not agnostic of the appliance type and model. Therefore, any effort to produce a learning algorithm for automatic thresholding [6] requires ground truth data, i.e., an indication of when an appliance is turned on or off by the user, for validation. However, acquiring high quality data demands efforts for planning, deploying and monitoring the experiment, and incurs considerable costs [7]. While the infrastructure installation does not involve the active participation of the households’ residents, the acquisition of ground truth data requires human efforts for the annotation of events. This task has to be carefully designed to be simple enough and should not induce user fatigue in order to guarantee the labeling quality [8, 9]. Real-world ground truth data are required for validating or inferring models in different fields that rely on machine learning. As the algorithms rely on supervised or semisupervised learning techniques, the need for ground truth data I. I NTRODUCTION has increased. Common but helpful tasks such as determining Achieving energy efficiency in households requires integrat- which email should be classified as spam benefit from sets of ing the residents in the loop. At the moment, most utility sample junk mails, but the fine tuning of the the classifier still company customers are only accustomed with the format requires the users’ participation to reduce false positives and of monthly bills as a feedback for their electricity usage. false negatives. In computer vision, object recognition relies As a result, they are often over- or under-estimating the on the segmentation of an image (similarly to performing it on consumption patterns of their appliances and are not familiar the frames of a video) to indicate what objects are present, but with energy jargon [1, 2, 3]. Confronting them with concrete also where they are located. Attempts at building large sets of information, and in particular, providing real-time feedback human annotated images involve crowdsourcing the efforts and was estimated to offer higher potential energy savings under relying on gamification [10] or a collaborative framework [11]. the best conditions [3]. Additionally, a smart home agent can CAPTCHAs [12], which are traditionally used for verifying incorporate an ambient intelligent system that monitors the that a user is human and not a robot before granting them residential consumption in real-time and control appliances access to a resource, are now diverted to extract street numbers based on usage and occupancy patterns. Understanding human for Google Street View. Research topics in computer science behaviors incurring energy consumption would allow us to are not the only ones requiring ground truth data, as the study Abstract—Targeting human activities responsible for the energy consumption instead of focusing solely on single appliance feedback for achieving energy efficiency in residential homes would link human behaviors to the resulting energy consumption. To this end, learning when appliances are in an active or idle state and the related user activity is crucial. Until smart appliances become widespread and can communicate their internal state, identifying when the residents interact with the appliances has to be determined from the available information that can be recorded from these devices. Developing and validating learning models require ground truth in the form of annotations to indicate when an appliance is active or idle. Launching data collection campaigns to incorporate these missing ground truth data involves careful planning before the roll-out of the experiment. Prohibitive costs for the hardware and time investment to monitor the deployed equipment are necessary for quality data. As such, publicly released datasets containing appliance-level data offer a basis for most researchers. This paper addresses these challenges by providing a collaborative web-based framework to retrofit labeling on existing datasets. The platform is publicly available, applies the wisdom of the crowd in the realm of energy research and leverages gamification techniques to encourage users’ active contribution. The access to the platform and furthermore to the expert manually labeled dataset intends to enable future research and foster more collaboration in this area. Index Terms—Information systems applications; Data mining; Collaborative computing, Computer-supported cooperative work; Energy disaggregation; Activity inference; Appliances states; Energy data analytics; Datasets; Ground truth acquisition
of the genome and the understanding of the function of each • We describe the design of a fetching engine to keep track gene is also adopting the strategy of crowdsourcing the efforts of single users’ and the crowd’s performance overall, in their community [13]. providing a consistent annotation flow and ensuring data In the energy domain, efforts have been deployed to offer consistency and motivating users’ contribution; toolkits for simplifying the deployment of data collections [7] • We explain how our approach fosters interaction among or the evaluation of NILM algorithms [14] on the most common researchers in the domain, leveraging the wisdom of publicly available datasets. The existing literature shows that experts, and thus contributing to the future research in in the case of the appliances, considerable progress on the this area by providing access to the annotated data. understanding of the energy signature of devices has been The remainder of this paper is organized as follows. Section made [15, 16, 17, 18]. Existing attempts at obtaining ground II presents related work. Section III introduces key components truth data for ON-OFF events depend on human supervision for of our annotation framework. Section IV describes the motithe annotation of existing energy datasets obtained through an vational techniques we include in our design to engage users’ event detection algorithm [19]. More complex annotations such participation. Section V discusses results obtained through the as acquiring human activities labels were achieved through a usage and evaluation of our platform by test users. Section web platform [9]. However, there has not yet been any initiative VI explains how the data acquired through our system can be to take advantage of the wisdom of the community on energy disseminated among the community. We conclude by discussing disaggregation to annotate existing datasets. lessons learned and future work in Section VII. “Crowdsourcing systems coordinate large groups of people II. R ELATED W ORK to solve problems that a single individual could not achieve at the same scale. Microtasking systems typically use highly- A. Home Energy Analytics controlled workflows to manage paid, non-expert workers Launching an energy data collection in residential envitoward expert-level results. While these crowdsourcing ap- ronments requires finding volunteers and efforts in planning. proaches are effective for simple independent tasks, many real- Efforts to maintain the hardware and solve failures or other world tasks such as the ones in design and engineering require anomalies that could be introduced by the faulty behavior of deep domain knowledge that is difficult to decompose into the residents are necessary to guarantee the quality of the data. independent microtasks that anyone can complete.” [20, p. 1] Some issues can be alleviated with the usage of a framework Consequently, most crowdsourcing workflows and algorithms like Piloteur [7], as it can serve as a best-practice basis for the aim to structure non-expert contributions to produce expert- deployment back-end. However, a real-life experiment involves level performance. monetary costs in terms of the measuring equipment, but also In this paper, we propose to leverage the knowledge acquired for the installation, as the complexity increases depending through NILM research to annotate the Pecan Street dataset. on the household’s setup and the appliances and circuits that This dataset was collected in the frame of an experiment should be monitored. Efforts in terms of time and costs are involving a smart grid demonstration project in Texas and thus often prohibitive and discourage the acquisition of new provides electricity, water, and natural gas and solar generation data. measurements [21]. The publicly available version of the dataset The energy community has benefited from NILM research, we use contains appliance-level data and thus, does not provide as they have collected and shared disaggregated data. The state information about the appliances, i.e., when they are active datasets vary in the number of households that were included from when they are in standby mode or off. Thus, the task in the experiment roll-out, the type of appliances and circuits consists in indicating when an appliance is powered on and that were monitored, the duration of the data collection, the being actively used to serve a human activity and when it can type of data that were collected (power, voltage, etc.) and their be considered idle. Our approach brings expert crowdsourcing granularity. REDD [22], BLUED [23], Smart* [24], Pecan to the very specific domain of labeling and annotating energy Street [21], iAWE [25] ECO [26] allow the community to events in public datasets. Unlike other domains where we benefit from the efforts of the groups and the organizations can leverage the wisdom of the crowds, here the activities that initiated those data collections, but also provides lessons require expert knowledge from the community. Regardless, we learned for prospective setups. make use of gamification techniques to promote expert user B. Other Domains participation. We attempt to provide an easy to use framework as a Data analytics techniques are applied to increasing amounts modulable plugin that can be used on existing publicly available of collected data to extract knowledge from them and are datasets to provide crowdsourced annotated data to energy assisting in the verification of models in diverse domains. experts and made freely available to the community. We Diverse applications require human input to improve the quality summarize the key contributions of this paper as follows: of a classification algorithm such as spam filtering or Internet • We describe the design of a web interface for the search [10]. NELL, the autonomous learner system requires annotation of a power trace dataset (such as the Pecan adjustments to its newly acquired categories by integrating some Street dataset) and relying on an intuitive approach, from daily human interactions [27]. Crowdsourcing has also become the users’ perspective, with simple drawing tools; popular for providing metadata for Twitter messages [28].
However, not only computer scientists, but also biologists are faced with large data amounts in their quest to understand gene functionality. There have been efforts to integrate annotations collaboratively in a structured way for the Zebrafish genome [13]. Computer vision is a field where the diversity of the concepts that should be captured by images and videos requires large collections of real-life examples to be collected. General labels can be obtained from content description in the HTML anchors for images [29]. While CAPTCHAs were at first introduced to differentiate robots from human users, by carefully embedding images in them, labels for text and image recognition can be obtained with varying degrees of accuracy [12]. However, precise segmentation of objects would require a different environment design and more focus on the task. Prior work in this domain has already considered crowdsourcing segmenting images and labeling areas of interest in images [30, 31, 32]. The integration of gamification into the labeling pipeline was already regarded by the computer vision community to reduce the tiredness incurred by the task [10]. III. F RAMEWORK We named our collaborative framework CAFED for Collaborative Annotation Framework for Energy Datasets1 . A view of the framework is available in Figure 2. The system architecture can be seen in Figure 1. The technical implementation details can be accessed as additional material on our GitHub repository.2 We discuss the key components in the following.
a real value that stores the total power consumption at the corresponding timestamp, and real numbers for all types of appliances and circuits that were monitored over the whole dataset. This means that for each row, a lot of columns are empty. We normalize the WikiEnergy database in order to optimize updates and inserts for our framework and provide a detailed Entity-Relationship Diagram on our GitHub. B. Security Since the framework consists of a web-platform, several measures have been taken to guarantee the users’ confidentiality and privacy. Prospective users are encouraged to sign up for an account, where they can choose a username and share their full name and email address. The authentication is handled by phppass4 and passwdqc,5 which are based on recommended methods for salting and hashing the passwords. The user is provided with the option to change their password at their convenience and to create a profile with additional information such as their addresses and their affiliation (only university at the moment). The relevant data are stored in two separate tables in the database. We considered using location (derived from the address, country, affiliation or IP address of the users) to offer additional gamification features based on the location of the contributors as will be discussed in Section IV. Additionally, typical measures for banning malicious IPs, session management and different attacks are implemented following the OWASP6 guidelines. C. Dispatcher
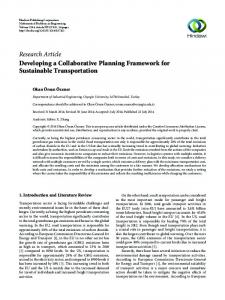
The dispatcher is handling the fetching of the curves to be annotated by the experts and guarantees a dynamic and targeted assignment of the missing labels. It relies on the use of a fetching table to keep track of how many annotators have been allotted a given power trace (pending annotations) and how many tasks were fulfilled to consolidate the result (committed annotations). The fetcher is called by a function that queries and updates the fetching table and returns the data to be annotated to the user. The data quality is enforced by the Fig. 1: CAFED architecture, based on a web server architecture use of majority voting to decide the final value to be attributed with a database for handling 3 key components: security to a given measurement in a power trace, the first objective to reach would be to obtain three annotations per curve. Once (authentication), curve dispatching and annotation. that this value is reached for all the readings, we expand the threshold to the next odd number. A. Database Architecture The dispatcher implements two modes of operations for the 1) WikiEnergy Database: CAFED uses the Pecan Street curve attribution. The user has the option to randomly display dataset,3 , which was curated and hosted by WikiEnergy. curves by letting the dispatcher choose the household and the The data were collected from January to May 2014 in 239 appliance type or circuit. The alternative allows the user to households and include 73 categories of appliances and circuits select the type of appliance for their assignment. Using this and provide 1-minute measurements. The original Pecan Street schema, the fetcher is keeping track of the available data that data are stored in a PostgreSQL database in a spreadsheet-like still need to be annotated for that specific selection and when format. Each row of the table has the following attributes: a household is identified, it will try to maintain continuity by the household id, a timestamp with time zone information, attempting to attribute power curves from the same household 1 https://cafed.inf.ethz.ch
4 http://www.openwall.com/phpass/
2 http://github.com/caoh/CAFED
5 http://www.openwall.com/passwdqc/
3 http://www.pecanstreet.org/
6 http://www.owasp.org/
Fig. 2: Annotation framework. We highlight in red the curve selection and in orange the annotation workbench. The personal performance component is highlighted in blue, while the competitive components are in purple. The badge section shown in green highlights the badges acquired by the user.
day, after day by keeping track of previously annotated data by the same user. D. Annotation The objects to be annotated consist of time series over the span of a day. This allows the user to correlate potential events arising during a day to variations in a power trace and to decide which changes can be attributed to a device or circuit being powered on. Similarly to the problem of segmenting objects in an image or a video [11], we require the annotator to highlight portions of a power trace to indicate the occurrence of an event, in our case, when the appliance is active. We integrate a toolbox with drawing features to enable the annotation of portions of the curves as can be seen in Figure 2. We binarize users’ inputs by transforming the highlighted areas into ones, while setting the rest to zeros.
IV. U SER ENGAGEMENT AND MOTIVATION Crowdsourcing has largely focused on tasks any individual can complete: many crowdsourcing platforms are built to accomplish tasks that require little training (e.g., Amazon Mechanical Turk) and recruit amateurs (e.g. FoldIt). Also, at the moment, those platforms are not suitable for more complex tasks that require an interactive interaction with the data to be annotated, in our case, time series. They are instead designed to provide content description through categorical or survey type of annotations (obtained through text fields, tick boxes or lists). Consequently, most crowdsourcing workflows and algorithms aim to structure non-expert contributions to produce expert-level performance. In the energy domain the annotation process requires experts that are capable of understanding and labeling the power events.
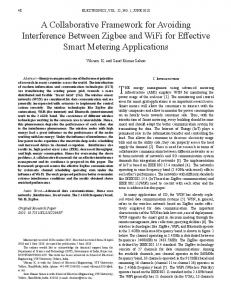
Using arbitrary set thresholds [33] does not perform satis- choose the appliance they are the most familiar with. This factorily in cases where the baseline consumption is above and might speed up the annotation progress, as the user can put will not scale with the diversity of appliances and baseline their expert knowledge into practice, while the random mode consumption profiles. In the case of circuit-level at the room allows for more diversity and surprise. The skip button allows level, the energy used by consumer electronics in standby mode to navigate between households. To minimize interactions with adds up and will vary from one household to the other, making buttons and other input interfaces and preserve the annotation the definition of a threshold difficult to scale on a large set of flow dynamics, after the user has submitted their annotations, a households. Additionally, appliances in standby-mode should new curve is automatically selected by the dispatcher based on not be considered actively in use, so the notion of baseline the user’s preference and displayed again in their workbench. also applies to them. Given the diversity of appliances and 2) Curve Annotation: We consider that the most natural way intra-categorical variances due to brand, model and production of indicating which area of a curve represents a period when year differences, deriving this information without expert an appliance is active would be to draw or highlight it with a knowledge about the expected power signature of electrical marker (similarly of locating objects in a image). The user is devices and notions about the mechanical functioning of the thus provided with a toolbox consisting of a pencil, an eraser appliances would induce the amateur annotators to label the and a loop (and their respective icons replace the cursor in the time series incorrectly. As can be seen in Figure 3, in the case of panel that contains the curve to be annotated). This enables an dishwasher1, the expert recommended highlighting the activity interaction similar to using a sheet of paper and a pen in the in one block because of his knowledge of subsequent cycles physical world for the annotations as can be seen in Figure 3. through a washing program (instead of producing segmented When selecting the drawing mode, regardless of the height of annotations as the power dropped to the baseline). Then in the the cursor (which takes the appearance of the icon representing case of livingroom1, not only is the baseline to be decided the feature currently on), clicking and dragging it to the end upon, but small peaks before 06:00 could be interpreted as an of the desired area will act as a highlighting feature. We also activity diverging from the baseline, while side information integrate the option to erase the annotation and to zoom in to such as when these arise and their frequency would indicate focus on curve portions. otherwise. We also pay attention to the layout of the information as Our design sets expert annotators at the core of the system, to facilitate the decision process for the areas to be annotated. as their contribution is essential to the building of the manually We combine a view where the user can compare the original labeled ground truth data. We discuss ways to facilitate users’ curve in blue to its binarized version in green as can be seen interaction with our system and how to acquire their loyalty. We in the workbench in Figures 2 in orange and in 3. We display consider different means of motivating the domain experts to information relating to the curve such as the household’s ID, participate. We expect two profiles of users, namely (i) experts the type of appliance or circuit that is represented and the day whose research interests can benefit from the dataset, (ii) experts on which the data were recorded. In order to have side cues on that are altruistic and wish to contribute to the community. how the data should be annotated, we add the next 6 days in the In the case of the altruistic contributor, we integrate both right panel for the same appliance and household and always intrinsic and external motivation elements [34] in the form of normalize the graph’s y-axis to the appliance’ maximum power gamification techniques to alleviate the repeatedness of the reading over all data available for the considered household annotation task. Obtaining the dataset is also considered as a to avoid scaling confusion. We preserve the chronology of the motivational tool as will be discussed in more details in Section curves by displaying the current curve in the left panel, while VI. We describe below the elements that are implemented in the next days are shown on the right side. These measures are the framework. embedded to guarantee consistence in the annotation process and to provide side information to the annotator. A. Annotation Task Simplification With such repetitive task as the annotation of data, users B. Gamification are required to familiarize themselves with the platform and to be able to interact with it efficiently. The perception of the easiness or difficulty of handling the tool will influence the contributors’ willingness and thus motivation to use it [34]. 1) Curve Selection: We decided to embed two modes for curve selection in CAFED, namely the random and appliancespecific modes as can be seen in the red area in Figure 2. Both modes can be selected by choosing the appropriate option as the user logs into the platform. The random mode allows the dispatcher to select the curves randomly as described in Section III. If the user is not comfortable with the curve they were assigned to, we embed a skip button to query for another appliance. The appliance specific mode allows the user to
In our setup, we assume that users are content contributors. In particular, we intend for the annotations to be provided through crowdsourcing by domain experts and thus, be trustworthy data, as they have the necessary knowledge to provide the appropriate labeling of the data. Since annotating energy datasets is an activity that would hardly be decomposed into independent microtasks that anyone can complete, we differentiate ourselves from the usage of other crowdsourcing platforms. In addition, using services like Mechanical Turk would imply having to monetize the effort and evaluate the quality of the workers’ contribution or even to select the appropriate workers [35]. Regardless, in an effort to motivate users’ participation, we integrate some gamification concepts to foster user engage-
(a) Single appliance: dishwasher1
(b) Circuit: livingroom1 with noticeable baseline consumption
Fig. 3: Annotation workbench in the case of a single appliance and circuit-level data
ment [36, 37]. We focus here on two intertwined techniques, in). We add information about the collaborative effort of the namely feedback through performance tracking [34] and the community in the form of progress bars in the performance usage of badges. From a socio-psychological standpoint, badges panel on the right side of the workbench as can be seen in pink offer a set of attributes, which combine educational and social solid lines in Figure 2. This information consists of the progress influences on users’ motivation [38]. in labeling the time series (distinctively for each time series 1) Performance Tracking: Performance tracking can be and in a consolidated manner, where the minimum number of twofold: allowing the user to keep track of their own progress annotators has been reached for each time series). 2) Badges: As platforms such as Stack Overflow7 provide or to position their contribution in comparison with the rest of the participants. Live feedback on the user’s performance free support for users from varying backgrounds to ask assesses the user’s past contribution and contributes to their question and contribute answers, badges were introduced to motivation [34]. We implement the latter in the performance reward contribution. This, as a consequence, also provides an panel, which is located at the left of the workbench as not to appreciation of the contributors’ knowledge by their peers and distract the user too much from their task, but still being close based on their pedigree. Carefully placing badges can steer the to the eye if the user wants to peek at the information as can user’s behavior towards targets set by the platform designer be seen in blue in Figure 2. The user’s personal performance and this effect increases as they approach the boundary to gain combines statistics about the number of data points and the them [39]. Content generation of geo-tagging data was also equivalent number of curves were submitted, the number of boosted on Foursquare by the usage and constant addition of days since signing up or the user’s best daily performance. We new badges to be acquired by users that were checking in at also display the user’s past 7-day performance in the form of places they visited. Using badges not only enforces user loyalty 7 squares that can take varying shades of green depending on or boosts and rewards performance, but also, some pedagogical the number of submission for each day (white for 0, a pastel feedback can be given to the user [37]. green for 1-2, an apple green for 3-9 and a dark green for over Our badges are awarded for different types of behaviors 10). By placing the cursor above a square, the user can view and can be grouped in different categories as can be seen in the exact number of submissions for a specific day. As will be the green area in Figure 2. In the following, we explain the explained in Section VI, the user’s contribution is rewarded by goals that should be achieved with the diverse categories of the release of the data. The historical feature can assist the user badges we intended to include. Some side effects of awarding in the scheduling of their contribution and to motivate them to some badges can be linked to performance tracking as well. provide submissions frequently, until the data are unlocked. We use an alert box in green to attract the user’s attention We introduce competition by showcasing the user’s perfor- to the acquisition of the latest badge. As we cannot expect mance against the other group members with a leader board as the user to read the information page that also provides an can be seen in pink dotted lines in Figure 2. The information overview on how badges can be obtained, the box also contains appears in the welcoming section as to be the first information an explanation as of why they obtained the badge. The badges to be displayed upon logging in. This not only should motivate are placed by categories as to facilitate the reading of the the user to improve their rate of contribution as they compare information and keeping track of the badges acquired. By themselves to others, but also provides recognition as a reward, using this design we acknowledge the user’s performance in as all annotators are faced with this information [34]. As real-time and, by incorporating an additional way of signaling mentioned in the Section III we could add more leader that a badge was acquired, we avoid that the information gets boards based on categories to value the users’ performance lost (pop ups can be distracting and as a usual habit, can be in subgroups where they would rank higher (based on their 7 http://stackoverflow.com/ affiliation, on the continent or the country they are located
TABLE I: Summary of the collected manual labels closed to prevent inconvenient alert windows, which are usually associated with advertisement). Result Value a) Submissions Badges: We differentiate badges that are Total # annotated curves 4856 permanently awarded for a particular milestone and ephemeral # curves annotated by 3 annotators 469 badges, for which a regular performance has to be provided in # curves annotated by 2 annotators 572 order to maintain them in the user’s badge collection. While # curves annotated by 1 annotators 2548 % curves annotated by 3 annotators 0.5% we provide an information page that not only describes the # users 9 purpose of the framework and the how to acquire badges, we # badges distributed 174 include some badges that are designed to positively enforce the user’s interaction with the annotation system by acknowledging their contribution. For example, we add the submission badges, ranking over the previous day and require that they top the which are received when a given number of submissions other participants on the current day to retain the badge. The is achieved. The contribution is already rewarded with one endurance badge is intended as a motivational tool that is submission and validates the user’s first interaction with the triggered once that the user has submitted 10 submissions system as being correct and successful. The submission category over the course of the current day. We also add the frequent is at the moment the only one intended to use leveling for the flyer badge, which can be obtained once that the user has same type of badges, as to reinforce a given purpose, which contributed at least once per day on five occasions over the is in our case to attract more submissions. They are relatively course of a week. This badge can be kept as long as the easily achieved as to motivate the user to contribute even on a previously explained ruled in respected in the span of 7 days. small scale already. The target number of submissions can of Finally, the champion badge rewards a contributor that have course be extended to encourage the user to contribute more. annotated all curves in the dataset, to target over-achievers. We could of course add more rules, more badges and b) Expertise Badges: We also encourage exploration by having expert badges that are awarded as a larger range of probably a continuous renewal process to integrate more badges types of appliances are annotated. Using both the random and in a similar way to Foursquare to retain users. the appliance selection modes, the succession of curves that V. R ESULTS are assigned to them or the different appliances / circuits that To the best of our knowledge, CAFED is the first system that are picked by affinity can lead the user to collect an expertise provides a dynamic attribution of time series to be annotated badge by chance. Although we could have used levels such as by expert users, while consolidating the already annotated with the submission badges, we first decide to reward curiosity, traces. Also, through the platform the results are stored and which means that once that all appliances in a group have been compiled in a ready to be deployed format. Most users have annotated once, the badge is delivered to the user. We could easily associated the annotation process with the highlighter and extend it to other expertise badges to foster relentlessness in a paper equivalent. Users have reported to require a few seconds given field or for one specific appliance or circuit. to a few minutes (in case of very segmented portions of curves We establish natural groupings of appliances / circuits and to be annotated accurately) to commit their annotations. The create the corresponding badges. For example, an expert badge first badge is awarded after one single submission and the users is awarded once that all appliances that could be found in a have recognized that it was perceived as a confirmation that group have all been submitted at least once. Concretely, the they had correctly interacted with the platform. Most users have bathroom expert badge is awarded for the appliances linked taken great care with zooming in and out to accurately indicate to the bathroom environment, while the chef badge rewards the start and the end of the task. When the users thought that curiosity in the kitchen area. The climate expert badge can be they needed to justify their annotation, they provided us with an obtained by annotating all corresponding climate regulation explanation for their reasoning. From their feedback we have appliances. The explorer badge is awarded for thinking out of the box, for submitting annotations for appliances that are realized that more features are needed to allow a comparison not so widespread across the dataset such as a wine fridge or with other users’ annotations. Some are made available in the appliances with the unknown label. The light expert badge appendix. The top three users provided the majority of the annotations can be gained by labeling all lights, while the outdoor badge with 600 annotations provided in the span of 2 weeks and relates to appliances that can be found outside of the household. devoting an average of 90 minutes per day for doing so. We The home owner badge is awarded once that all appliances in provide an overview of the data collected so far in Table I. a household have been annotated at least once and thus, this depends on the dispatcher’s selection. VI. G IVING BACK TO THE C OMMUNITY c) Ephemeral Badges: The previously presented badges Substantial progress has been enabled through the public were forever awarded badges. To influence the user’s loyalty release of datasets. Through this framework, we intend to give and thus frequent contribution, we add ephemeral badges. Daily back to the community by providing access to annotated data. attributed badges reward current performances and consistency We follow in the footsteps of platforms such as WikiEnergy8 badges and require the user to contribute more frequently 8 Now known as Pecan Street Dataport over time. Top contributor badges are awarded for the user’s
or NILMTK9 to provide a unified access to an online platform to facilitate the creation of manually labeled ground truth data and their dissemination in the community. A. Combining the Results Although we are targeting domain expert users, we envision that their annotation will not always agree. However, by relying on the wisdom of the crowd, we decided to consider majority voting to consolidate the annotations of the data points. Concretely, each curve is assigned to an odd number of annotators and the final outcome relies on the combination of the majority’s decision for each measurement. We start by requiring 3 as a minimum to be reached, which means that at least two similar annotations for a given data point are necessary and will yield its value eventually. As to increase the credibility and quality of data, as the number of converging decisions increases to reach a consensus, we decided not to stop once that the threshold of 3 annotators per curve has been reached, but to continue to the next odd number and so on. B. Downloading the Data
experienced data issues, backups allowed us to revert to previous versions and having additional data consistency constraints avoided any data loss. We launched a small user study for determining where our design was flawed. At the moment, we have tested our platform with 9 users who have provided over 4500 annotated curves. We have taken their comments into account in the design and the improvement of the platform. We realized that some features that seemed obvious and although documented in the Help section were not correctly identified or used by the users. This is why we had to incorporate a help video and help markers in the work bench to direct the users’ attention to the embedded functionalities. Also, a detail that can greatly impact the quality of the annotation consists in the y-axis scaling before displaying the curves to the user. The dynamic scaling of the y-axis to the current curve data would produce inconsistency: lower power measurements (from the noise or the baseline) that would be unnoticed in the presence of active measurements would become visible for a day without the residents’ activity and could be annotated. So, we proceeded to the scaling to the max value for all curves for the same household and appliance. After this change, users communicated that they did not necessarily notice the y-axis scale and were mostly looking at the shape of the curve and using the y-axis for confirmation.
Our goal is to share these ground truth data with the community. However, this can only be possible once that there are data to be shared. We decided to release the dataset progressively to contributors, as they reach certain levels of contributions. This can be seen as another gamification B. Future Work technique. In this perspective, we opt to reward frequent We have presented a modulable plugin that is accessible and numerous submissions. This can be represented by the to the community via a web platform and combines design combination of two badges, namely the endurance and the features to facilitate the annotation process and to engage frequent flyer badge, in the form of the download badge. This the user. We follow in the footsteps of initiatives such as means that all the data available can be downloaded as soon as WikiEnergy or NILMTK. We do not exclude a merging of all both badges are available in the user’s badge collection. The tools under the same platform to regroup the efforts to provide user could of course only provide 1 submission per day on 4 access to data and tools to the community. days over a week and provide 10 submissions on the 5th day, but To improve the experience with the tool, we intend to add this still means they should have contributed 14 submissions. the possibility to search for annotation examples from other They will need to have obtained the download badge again to users. Similarly to Stack Overflow and as explained in [37] and maintain their access to the current set of annotated data. The in [38], we intend to show the status of different contributors absolute figures in terms of available data to be downloaded by allowing them to interact with each other. This can be are subject to change as the data provided by the community enabled by allowing a user to search for similar contents are increasing. annotated by others and by displaying the user’s badges status with their username. In the case where the plugin were to be VII. C ONCLUSIONS merged with another platform like WikiEnergy, which allows A. Lessons Learned additional interactions between users, such as posting questions The curve fetching engine requires an optimized access to on a forum, we could display a summary of acquired badges the time series. This requires a clear entity-relationship model associated with the username of the poster. Also, we do not and optimized indexing and the creation of assisting tables need to restrict the labeling to binary decisions solely, but could (as table joins can be inefficient if only partial information easily adapt the platform to incorporate multi-label problems is required) for enabling the data query. Depending on the by extending the toolbox at the disposal of the users to annotate granularity of the measurements, extensive care has to be taken activities that took place during the day for example. In order to maintain the quality of the annotations and to to estimate the number of records to be stored in the database. prevent unintentional mistakes, we will add an amend option, Inadequate data types will also quickly overflow. that allows the user to correct previously submitted data. Also, Having separate but replicated development and production we could envision pre-selecting actives sections and presenting environment allowed us to experiment with framework changes, the result to the user and only require for them to validate without impacting the user’s experience too much. Having or correct the pre-computed result, similarly to the example 9 http://nilmtk.github.io/ developed by [11, 19]. Also, since we have as well annotated
an extensive amount of curves, they can be used as trusted data to verify and validate new users’ contributions and discard malicious contributors. We developed a modulable plugin that can be easily adapted to fit other datasets. By unifying the access to other datasets, we would also prevent ad-hoc solutions, where each researcher would have to build their own system and we show that the labels can be extended to encompass more events that determine when an appliance is active or idle. We plan to use these data to evaluate the automatic thresholding algorithm presented in [6]. R EFERENCES [1] W. Kempton and L. Montgomery, “Folk quantification of energy,” Energy, vol. 7, pp. 817–827, Oct. 1982. [2] J. Froehlich, “Promoting energy efficient behaviors in the home through feedback: The role of human-computer interaction,” Proc. HCIC’09, 2009. [3] K. C. Armel, A. Gupta, G. Shrimali, and A. Albert, “Is disaggregation the holy grail of energy efficiency? The case of electricity,” Energy Policy, vol. 52, pp. 213–234, 2013. [4] G.-y. Lin, S.-c. Lee, J.-J. Hsu, and W.-r. Jih, “Applying power meters for appliance recognition on the electric panel,” in Proc. ICIEA’10, (Taichung, Taiwan), pp. 2254– 2259, IEEE, June 2010. [5] N. C. Truong, L. Tran-thanh, E. Costanza, and S. D. Ramchurn, “Activity Prediction for Agent-based Home Energy Management,” in Proc. AAMAS ATES’13, (Saint Paul, MN, USA), May 2013. [6] H.-A. Cao, T. K. Wijaya, and K. Aberer, “Poster Abstract: Estimating human interactions with electrical appliances for activity-based energy savings recommendations,” in Proc. BuildSys’14, (Memphis, TN, USA), pp. 206–207, ACM, Nov. 2014. [7] J. Feminella, D. Pisharoty, and K. Whitehouse, “Piloteur: A Lightweight Platform for Pilot Studies of Smart Homes,” Proc. BuildSys’14, pp. 110–119, Nov. 2014. [8] S. Rollins, N. Banerjee, L. Choudhury, and D. Lachut, “A system for collecting activity annotations for home energy management,” Pervasive and Mobile Computing, 2014. [9] D. P. Richardson, E. Costanza, and S. D. Ramchurn, “Evaluating Semi-automatic Annotation of Domestic Energy Consumption As a Memory Aid,” in Proc. UbiComp’12, (Pittsburgh, PA, USA), pp. 613–614, ACM, Sept. 2012. [10] L. von Ahn, “Games with a Purpose,” Computer, vol. 39, pp. 92–94, June 2006. [11] I. Kavasidis, S. Palazzo, R. D. Salvo, D. Giordano, and C. Spampinato, “An innovative web-based collaborative platform for video annotation,” Multimedia Tools and Applications, vol. 70, pp. 413–432, Mar. 2013. [12] P. Faymonville, K. Wang, J. Miller, and S. Belongie, “CAPTCHA-based image labeling on the Soylent Grid,” in Proc. SIGKDD HCOMP’09, (Paris, France), pp. 46–49, ACM, June 2009.
[13] M. Singh, D. Bhartiya, J. Maini, M. Sharma, A. R. Singh, S. Kadarkaraisamy, R. Rana, A. Sabharwal, S. Nanda, A. Ramachandran, A. Mittal, S. Kapoor, P. Sehgal, Z. Asad, K. Kaushik, S. K. Vellarikkal, D. Jagga, M. Muthuswami, R. K. Chauhan, E. Leonard, R. Priyadarshini, M. Halimani, S. Malhotra, A. Patowary, H. Vishwakarma, P. Joshi, V. Bhardwaj, A. Bhaumik, B. Bhatt, A. Jha, A. Kumar, P. Budakoti, M. K. Lalwani, R. Meli, S. Jalali, K. Joshi, K. Pal, H. Dhiman, S. V. Laddha, V. Jadhav, N. Singh, V. Pandey, C. Sachidanandan, S. C. Ekker, E. W. Klee, V. Scaria, and S. Sivasubbu, “The Zebrafish GenomeWiki: a crowdsourcing approach to connect the long tail for zebrafish gene annotation.,” Database : The Journal of Biological Databases and Curation, vol. 2014, p. bau011, Jan. 2014. [14] N. Batra, J. Kelly, O. Parson, H. Dutta, W. Knottenbelt, A. Rogers, A. Singh, and M. Srivastava, “NILMTK: an open source toolkit for non-intrusive load monitoring,” in Proc. e-Energy’14, (Cambridge, UK), pp. 265–276, ACM, June 2014. [15] G. Hart, “Nonintrusive appliance load monitoring,” Proceedings of the IEEE, vol. 80, no. 12, pp. 1870–1891, 1992. [16] M. Gulati, S. S. Ram, and A. Singh, “An in depth study into using EMI signatures for appliance identification,” in Proc. BuildSys’14, (Memphis, TN, USA), pp. 70–79, ACM, Nov. 2014. [17] A. Zoha, A. Gluhak, M. A. Imran, and S. Rajasegarar, “Non-intrusive load monitoring approaches for disaggregated energy sensing: a survey.,” Sensors (Basel), vol. 12, no. 12, pp. 16838–66, 2012. [18] S. Barker, S. Kalra, D. Irwin, and P. Shenoy, “PowerPlay: Creating Virtual Power Meters Through Online Load Tracking,” in Proc. BuildSys’14, (Memphis, TN, USA), pp. 60–69, ACM, Nov. 2014. [19] L. Pereira and N. J. Nunes, “Semi-Automatic Labeling for Non-Intrusive Load Monitoring Datasets,” in Proc. SustainIT’15, (Madrid, Spain), IEEE, Apr. 2015. [20] D. Retelny, S. Robaszkiewicz, A. To, W. S. Lasecki, J. Patel, N. Rahmati, T. Doshi, M. Valentine, and M. S. Bernstein, “Expert crowdsourcing with flash teams,” in Proc UIST’14, (Honolulu, HI, USA), pp. 75–85, ACM, Oct. 2014. [21] K. Nagasawa, C. R. Upshaw, J. D. Rhodes, C. L. Holcomb, D. A. Walling, and D. M. E. Webber, “Data Management for a Large-Scale Smart Grid Demonstration Project in Austin, Texas,” in Proc. ES’12, (San Diego, CA, USA), pp. 1027–1031, ASME, July 2012. [22] J. Z. Kolter and M. J. Johnson, “Redd: A public data set for energy disaggregation research,” (San Diego, CA, USA), ACM, Aug. 2011. [23] K. Anderson, A. Ocneanu, D. Benitez, D. Carlson, A. Rowe, and M. Berges, “BLUED: A Fully Labeled Public Dataset for Event-Based Non-Intrusive Load Monitoring Research,” in Proc. SustKDD’12, (Beijing, China), ACM, Aug. 2012.
[24] S. Barker, A. Mishra, D. Irwin, and E. Cecchet, “Smart*: An open data set and tools for enabling research in sustainable homes,” in Proc. SustKDD’12, (Beijing, China), ACM, Aug. 2012. [25] N. Batra, M. Gulati, A. Singh, and M. B. Srivastava, “It’s Different: Insights into home energy consumption in India,” in Proc. BuildSys’13, (Rome, Italy), pp. 1–8, ACM, Nov. 2013. [26] C. Beckel, W. Kleiminger, R. Cicchetti, T. Staake, and S. Santini, “The ECO data set and the performance of non-intrusive load monitoring algorithms,” in Proc. BuildSys’14, (Memphis, TN, USA), pp. 80–89, ACM, Nov. 2014. [27] A. Carlson, J. Betteridge, and B. Kisiel, “Toward an Architecture for Never-Ending Language Learning.,” in Proc. AAAI’10, (Atlanta, GA, USA), AAAI, July 2010. [28] T. Finin, W. Murnane, A. Karandikar, N. Keller, J. Martineau, and M. Dredze, “Annotating Named Entities in Twitter Data with Crowdsourcing,” in Proc. NAACL HLT CSLDAMT’10, (Los Angeles, CA, USA), pp. 80–88, Association for Computational Linguistics, June 2010. [29] S. Changuel, N. Labroche, and B. Bouchon-meunier, “A General Learning Method for Automatic Title Extraction from HTML Pages,” in Proc. MLDM’09, (Leipzig, Germany), pp. 704–18, Springer, July 2009. [30] J. Yuen, B. Russell, and A. Torralba, “LabelMe video: Building a video database with human annotations,” in Proc. ICCV’09, (Kyoto, Japan), pp. 1451–1458, IEEE, Sept. 2009. [31] C. Rashtchian, P. Young, M. Hodosh, and J. Hockenmaier, “Collecting Image Annotations Using Amazon’s Mechanical Turk,” in Proc. NAACL HLT CSLDAMT’10, (Los Angeles, CA, USA), pp. 139–147, Association for Computational Linguistics, June 2010. [32] C. Vondrick, D. Patterson, and D. Ramanan, “Efficiently Scaling up Crowdsourced Video Annotation,” International Journal of Computer Vision, vol. 101, pp. 184–204, Sept. 2012. [33] B. Neupane, T. B. Pedersen, and B. Thiesson, “Towards Flexibility Detection in Device-Level Energy Consumption,” in Proc. ECML DARE ’14, (Nancy, France), pp. 1– 16, Springer, Sept. 2014. [34] J. H. Jung, C. Schneider, and J. Valacich, “Enhancing the Motivational Affordance of Information Systems: The Effects of Real-Time Performance Feedback and Goal Setting in Group Collaboration Environments,” Management Science, vol. 56, pp. 724–742, Apr. 2010. [35] H. Li, B. Zhao, and A. Fuxman, “The Wisdom of Minority: Discovering and Targeting the Right Group of Workers for Crowdsourcing,” in Proc. WWW ’14, (Seoul, South Korea), pp. 165–176, ACM, Apr. 2014. [36] S. Deterding, D. Dixon, R. Khaled, and L. Nacke, “From Game Design Elements to Gamefulness: Defining ”Gamification”,” in Proc. MindTrek’11, (Tampere, Finland), pp. 9–15, ACM, Sept. 2011. [37] G. Zichermann and C. Cunningham, Gamification by
Design: Implementing Game Mechanics in Web and Mobile Apps. O’Reilly Media, Aug. 2011. [38] J. Antin and E. F. Churchill, “Badges in Social Media: A Social Psychological Perspective,” in Proc. CHI GAMICHI’11, (Vancouver, BC, Canada), ACM, May 2011. [39] A. Anderson, D. Huttenlocher, and J. Kleinberg, “Steering User Behavior with Badges,” in Proc. WWW’13, (Rio de Janeiro, Brazil), pp. 95–106, International World Wide Web Conferences Steering Committee, May 2013. A PPENDIX The users provided us with feedback that we included in the design of the framework. The comments and our responses are listed below. 1) What is the fastest way to get familiar with the platform? • We put a quickstart video online (you can see it from the start page and within the annotation page). 2) I’ve used the zooming tool but cannot zoom out. How do I proceed? • We’ve now added tooltips (move your mouse over those tools to get some hints) and added clearly distinguishable question mark icons with some more hints. 3) For each household, how do I make sure that the bursts and peeks I see for a specific (appliance/household) pair are not singular events? • First, we scaled the graphs to the maximum value for each appliance/household pair, to get an overview of the appliance’s usage over the whole span of the data collected for this pair. • We provide additional side information (the next day following the current day to be annotated). 4) I believe that one additional day is not enough to get a feeling of whether an event happens by chance or whether there is a trend. • We now provide 7 consecutive days in total (the current day to annotate and the 6 next days). 5) I’ve made a mistake, how do I amend my annotations? • We are planning on releasing a correction tool to review past annotations. At the moment, please email the admin. 6) I do not like to use the mouse too much. What can be done to speed up the selection of the tools? • We now have added key strokes recognition. Press ”s” for selecting the pencil, ”d” for the eraser and ”f” for zooming. 7) When can I download the data? • As soon as you’ve unlocked the download badge (meaning you have obtained both the frequent flyer and the endurance badges on the current day).