FOCUS: FROM MOBILITIES
TO
PROTEOMES
A Collision Cross-Section Database of Singly-Charged Peptide Ions Lei Tao, Janel R. McLean, John A. McLean,* and David H. Russell The Laboratory for Biological Mass Spectrometry, Department of Chemistry, Texas A and M University, College Station, College Station, Texas, USA
A database of ion-neutral collision cross-sections for singly-charged peptide ions is presented. The peptides included in the database were generated by enzymatic digestion of known proteins using three different enzymes, resulting in peptides that differ in terms of amino acid composition as well as N-terminal and C-terminal residues. The ion-neutral collision crosssections were measured using ion mobility (IM) spectrometry that is directly coupled to a time-of-flight (TOF) mass spectrometer. The ions were formed by a matrix-assisted laser desorption ionization (MALDI) ion source operated at pressures (He bath gas) of 2 to 3 torr. The majority (63%) of the peptide ion collision cross-sections correlate well with structures that are best described as charge-solvated globules, but a significant number of the peptide ions exhibit collision cross-sections that are significantly larger or smaller than the average, globular mobility-mass correlation. Of the peptide ions having larger than average collision crosssections, ⬃71% are derived from trypsin digestion (C-terminal Arg or Lys residues) and most of the peptide ions that have smaller (than globular) collision cross-sections are derived from pepsin digestion (90%). (J Am Soc Mass Spectrom 2007, 18, 1232–1238) © 2007 American Society for Mass Spectrometry
I
on mobility (IM) spectrometry separates ions on the basis of ion-neutral collision cross-section or apparent surface area, and several groups have combined IM spectrometry with high-performance mass spectrometers to provide accurate mass measurements of ions exiting the IM drift cell [1]. More recently, IM-MS instruments that operate as tandem mass spectrometry instruments (IM-MS/MS) have also been developed [2–9]. Potential advantages of IM-MS and IM-MS/MS for proteomics research are postionization separation, which facilitates direct analysis of complex mixtures, increased sample throughput afforded by rapid data acquisition (s-ms), and reduction of chemical noise by separation of molecular classes owing to differences in intrinsic gas-phase packing efficiencies of the ions [10, 11]. We refer to the separation of molecular classes in the mobility-mass dimension in terms of “conformation space,” which is realized by plotting collision crosssection versus m/z ratio of the ion [1]. Several research groups have focused on developing IM-MS for biophysical studies of peptides and proteins [12–16, 1]. Our laboratory as well as Clemmer’s has focused considerable attention on developing applications of IM-MS for proteomics, i.e., high throughput Address reprint requests to Dr. D. H. Russell, The Laboratory for Biological Mass Spectrometry, Department of Chemistry, Texas A and M University, 3255 TAMU, College Station, TX 77843-3255, USA. E-mail:
[email protected] * Current address: Department of Chemistry and Vanderbilt Institute of Chemical Biology, Vanderbilt University, Nashville, TN 37235, USA.
analysis of peptides/proteins, and most of this work has utilized “bottom-up” proteomics or the identification of proteins by enzymatic digestion of the protein followed by MS analysis of the peptide fragments [1, 17]. Clemmer and coworkers have compiled a database of peptide ion collision cross-sections and suggested that the majority of small (⬍1500 m/z), singly-charged, tryptic peptides do not exhibit anhydrous secondary structure [18]. That is, most peptide ions assume a compact, charge-solvated (globular) structure in the gas phase [14, 19]; however, we showed that a few gasphase, tryptic peptides prefer extended (helical) structure in the gas phase [15, 16]. In some cases posttranslational modification results in smaller than predicted structures from the average mobility-mass correlation, which likely results from intramolecular charge-solvation and/or formation of salt-bridged type structures. We are interested in evaluating IM-MS as a screening method for identifying peptides which exhibit secondary structure or are post-translationally modified [1], which could provide an added data dimension for protein identification as well as unraveling the molecular parameters that most strongly influence higher order structure in the absence of water. A primary challenge associated with developing IM-MS for proteomics scale protein identification is the extensive molecular simulations required for crosscorrelating collision cross-sections with ion structure. The goal of this study is to establish a database of high confidence level peptide ion collision cross-sections val-
© 2007 American Society for Mass Spectrometry. Published by Elsevier Inc. 1044-0305/07/$32.00 doi:10.1016/j.jasms.2007.04.003
Published online April 15, Received December 21, Revised April 5, Accepted April 5,
2007 2006 2007 2007
J Am Soc Mass Spectrom 2007, 18, 1232–1238
CROSS-SECTION DATABASE OF PEPTIDE IONS
1233
Table 1. Compilation of selected data for peptide ions which fall within 3 % of the average mobility-mass correlation Enz.
Protein
Position
Sequence
m/z
⍀ (Å2)
Ko
% dev.
C C T C T P C P C C C C T T C T C T T P
ALBU_BOVIN HBB_HORSE ENO1_YEAST HBB_HORSE MYG_HORSE ALDOA_RABIT CYC_HORSE HBB_HORSE CYC_HORSE ALDOA_RABIT ALBU_BOVIN OVAL_CHICK MYG_HORSE HBA_HORSE HBA_HORSE LYSC_CHICK HBB_HORSE MYG_HORSE ALBU_BOVIN HBB_HORSE
147–150 38–41 234–240 142–146 57–62 357–363 1–10 33–41 37–48 31–43 435–446 19–29 119–133 17–31 35–48 116–130 13–28 1–16 508–523 63–85
CDEF TQRF AAGHDGK AHKYH ASEDLK FISNHAY* GDVEKGKKIF VVYPWTQRF* GRKTGQAPGFTY AADESTGSIAKRL* TRKVPQVSTPTL KVHHANENIFY HPGDFGADAQGAMTK VGGHAGEYGAEALER GFPTTKTYFPHFDL IVSDGNGMNAWAWR ALWDKVNEEEVGGEAL GLSDGEWQQVLNVWGK* RPCSALTPDETYVPK HGKKVLHSFGEGVHHLDNLKGTF
513.17 551.29 655.32 655.33 662.34 851.40 1120.64 1195.63 1282.65 1318.70 1326.77 1371.68 1502.67 1515.72 1670.82 1675.8 1758.85 1815.90 1823.90 2557.34
152 ⫾ 2 160 ⫾ 3 180 ⫾ 3 180 ⫾ 1 181 ⫾ 3 216 ⫾ 2 262 ⫾ 3 273 ⫾ 1 287 ⫾ 3 292 ⫾ 2 294 ⫾ 2 301 ⫾ 2 320 ⫾ 4 322 ⫾ 2 344 ⫾ 2 344 ⫾ 4 355 ⫾ 3 363 ⫾ 4 364 ⫾ 1 450 ⫾ 2
3.55 ⫾ 0.06 3.38 ⫾ 0.06 3.00 ⫾ 0.05 3.00 ⫾ 0.02 2.98 ⫾ 0.04 2.50 ⫾ 0.02 2.06 ⫾ 0.02 1.97 ⫾ 0.01 1.87 ⫾ 0.02 1.84 ⫾ 0.01 1.83 ⫾ 0.01 1.79 ⫾ 0.01 1.68 ⫾ 0.02 1.67 ⫾ 0.02 1.56 ⫾ 0.01 1.56 ⫾ 0.02 1.51 ⫾ 0.01 1.48 ⫾ 0.02 1.48 ⫾ 0.00 1.19 ⫾ 0.00
⫺0.1 0 0.1 0 0 0.1 0.1 0 ⫺0.1 ⫺0.1 0 0.1 0 0.1 0.1 0 0 0.1 0 0
The table lists the enzyme used for proteolysis (Enz., T ⫽ trypsin, C ⫽ chymotrypsin, P ⫽ pepsin, the UniProtKB protein identifier, position of peptide in the protein, amino acid sequence, monoisotopic mass-to-charge ratio (m/z), collision cross-section (⍀), reduced mobility (Ko) and percent deviation from the average mobility-mass correlation (% Dev.). Collision cross-sections and reduced mobilities are reported as the average ⫾1 for 5 replicate measurements. (ⴱ) Indicates peptide sequences were confirmed by tandem MS.
ues, which can be used to define the regions of conformation space occupied by peptide [M ⫹ H]⫹ ions over a range of values typically encountered in “bottom-up” MS based proteomics. Our working definition of “high confidence level” includes correlation of peptide ion collision cross-sections with accurate mass measurements and sequence assignments based on tandem MS data.
Experimental Sample Preparation All proteins, bovine -casein (Mr 25,091 Da), bovine serum albumin (Mr 69,248 Da), horse cytochrome c (Mr 11,694Da), horse hemoglobin ␣-chain (Mr 15,105 Da), horse hemoglobin -chain (Mr 15,998 Da), horse myoglobin (Mr 16,941 Da), chicken egg ovalbumin (Mr 42,722 Da), chicken egg lysozyme (Mr 16,228 Da), rabbit aldolase (Mr 39,187 Da), yeast enolase (Mr 46,642 Da) were purchased from Sigma (St. Louis, MO) and used without further purification. Trypsin and chymotrypsin digestions were performed using standard protocols as described elsewhere [20]. Briefly, proteins were thermally-denatured at 90 °C for 20 min, and then they were enzymatically digested with sequencing grade trypsin (Promega, Madison, WI) or chymotrypsin (Sigma) in a 1:40 (wt/ wt) enzyme to analyte ratio at 37 °C for ca. 20 h. Proteins were digested with pepsin (Sigma) using standard protocols. The pH of the protein solution was lowered to ca. 2 by adding 0.1M HCl, mixed with pepsin [1:20 protein to enzyme ratio (wt/wt)] and incubated at 37 °C for 2 h. To quench the reaction, the pH of the digest was neutralized with 0.1M NH4OH.
MALDI was performed by mixing the protein digests with re-crystallized ␣-cyano-4-hydroxycinnamic acid (Sigma) in a ca. 2000:1 matrix to analyte molar ratio. The mixture was directly deposited as a dried droplet on a stainless steel MALDI sample plate. Peptide amino acid sequences were initially assigned based on in silico protein digests generated by “PeptideMass” on the ExPASy website [21] and high-resolution MALDI-TOF mass analysis (PerSeptive Biosystems, Voyager DE STR). Sequence assignments for selected peptides (marked with ⴱ in Table 1, Table 2, and Table 3) were confirmed using MALDI-based tandem mass spectrometry (Applied Biosystems 4700 Proteomics analyzer). The MALDI-IM-TOF-MS instrument used for these studies was constructed in collaboration with Ionwerks Inc. (Houston, TX), and the basic instrument design is similar to those previously described [22]. Briefly, MALDI was performed using high repetition ratefrequency tripled (355 nm) Nd:YAG laser (CrystaLaser, Reno, NV) operated at a pulse rate of 200 to 400 Hz. The resulting ions were introduced into a 15 cm drift tube maintained at a pressure of ca. 2.5 torr He at room temperature and using IM field strengths ranging from 30 to 48 V/cm·torr. Ions were separated based on mobility with a resolution of ca. 30 to 50. The ions eluting the drift cell were extracted into an orthogonal reflectron-TOF for mass analysis (resolution, ca. 2000 to 4000). The mass spectrometer was externally calibrated using two-point calibration of the radical cations (⫹1) of C60 (Mr ⫽ 720) and C70 (Mr ⫽ 840) (Sigma) [4]. The 2D IM-MS data were acquired and processed by using custom software (Ionwerks, Inc.). All spectra were acquired under “low-field” condi-
1234
TAO ET AL.
J Am Soc Mass Spectrom 2007, 18, 1232–1238
Table 2. Compilation of selected data for peptide ions with collision cross-section that deviate by more than ⫹7% from the average mobility-mass correlation. (Notations are as same as Table1) Enz.
Protein
Position
Sequence
m/z
⍀ (Å2)
Ko
% Dev.
C T T T T T T T C C T T T T T T T T T T
MYG_HORSE MYG_HORSE ENO1_YEAST CYC_HORSE CYC_HORSE CYC_HORSE HBA_HORSE HBB_HORSE HBB_HORSE HBA_HORSE HBB_HORSE HBB_HORSE OVAL_CHICK MYG_HORSE CASB_BOVIN ENO1_YEAST CYC_HORSE MYG_HORSE ALDOA_RABIT MYG_HORSE
30–33 134–139 409–414 8–13 80–86 73–79 91–99 133–144 104–114 126–136 105–116 31–40 370–381 64–77 206–217 105–119 26–38 64–78 243–257 103–118
IRLF ALELFRⴱ LNQLLR KIFVQK MIFAGIKⴱ KYIPGTK LRVDPVNFK VVAGVANALAHK RLLGNVLVVVL DKFLSSVSTVL LLGNVLVVVLARⴱ LLVVYPWTQRⴱ HIATNAVLFFGRⴱ HGTVVLTALGGILKⴱ LLYQEPVLGPVR LGANAILGVSLAASRⴱ HKTGPNLHGLFGRⴱ HGTVVLTALGGILKKⴱ YSHEEIAMATVTALRⴱ YLEFISDAIIHVLHSKⴱ
548.36 748.44 756.47 762.49 779.45 806.48 1087.63 1149.67 1194.79 1195.66 1265.83 1274.73 1345.74 1378.84 1383.8 1412.82 1433.78 1506.94 1691.84 1885.02
173 ⫾ 1 215 ⫾ 0 215 ⫾ 2 225 ⫾ 3 223 ⫾ 4 225 ⫾ 4 280 ⫾ 2 292 ⫾ 2 304 ⫾ 0 304 ⫾ 2 343 ⫾ 2 315 ⫾ 2 327 ⫾ 3 361 ⫾ 2 330 ⫾ 2 366 ⫾ 2 338 ⫾ 3 378 ⫾ 5 400 ⫾ 1 419 ⫾ 4
3.13 ⫾ 0.02 2.50 ⫾ 0.00 2.50 ⫾ 0.02 2.39 ⫾ 0.03 2.41 ⫾ 0.04 2.39 ⫾ 0.04 1.92 ⫾ 0.01 1.84 ⫾ 0.01 1.77 ⫾ 0.00 1.77 ⫾ 0.01 1.57 ⫾ 0.01 1.71 ⫾ 0.01 1.65 ⫾ 0.01 1.49 ⫾ 0.01 1.63 ⫾ 0.01 1.47 ⫾ 0.01 1.59 ⫾ 0.02 1.43 ⫾ 0.01 1.35 ⫾ 0.00 1.28 ⫾ 0.01
8.6 9.3 8.5 12.9 10.2 8.6 9.4 9.8 11.3 11.2 20.6 10 10.1 19.6 9 19.2 8.9 17.8 15.5 12.7
tions [23–25] using five different IM field strengths to accurately estimate the mass-dependent drift time correction, to (tmeasured ⫺ to ⫽ td), which represents time the ion spends outside of the IM drift cell. Collision crosssections were calculated using the empirical drift times (td) and the hard sphere approximation [23]: 1
⍀avg ⫽
(18) 2 ze 1
冉
1
16 (kbT) 2 mI
⫹
1 mB
冊
1 2
tdE 760 L
T
1
P 273.2 N0
(1)
where z is the charge of the ion, e is elementary charge, N0 is the number density of the drift gas at STP, kb is Boltzmann’s constant, mI is the mass of the ion, mB is the mass of buffer gas, E is the IM electric field strength, L is the drift tube length, P is the buffer gas pressure, and T is the system temperature. To evaluate the accuracy of our collision cross-section measurements, we regularly measured the collision cross-section of bradykinin [M ⫹ H]⫹ions. The measured values of bradykinin [M ⫹ H]⫹ ions are always within 2% of 242 Å2, consistent with
previously reported values for bradykinin [M ⫹ H]⫹ ions [26]. Molecular dynamics calculations were performed as described elsewhere [15, 27]. Briefly, simulated annealing was performed with Cerius2 (Accelrys, San Diego, CA) using the consistent force field (CFF 1.02). During the simulation, the starting structure was gradually heated from 300 to 1000 K over a 280 ps cycle. After each annealing cycle, a minimized structure was produced. Annealing cycles were repeated 300 times for each starting structure. The collision cross-section of each structure was calculated using the trajectory method in the MOBCAL software [28]. The representative structures are the lowest energy structures within 2% of the experimental collision cross-section.
Results and Discussion The objective of this study is to build a database of IM-MS data for singly-charged peptide ions. The database is composed of a diverse set peptide sequences that
Table 3. Compilation of selected data for peptide ions that deviate by more than ⫺7% from the average mobility-mass correlation. (Notations are as same as Table1) Enz.
Protein
Position
Sequence
m/z
⍀ (Å2)
Ko
% Dev.
P P P P P P P P/C C P
CYC_HORSE ALDOA_RABIT CASB_BOVIN OVAL_CHICK OVAL_CHICK OVAL_CHICK OVAL_CHICK LYSC_CHICK ALDOA_RABIT LYSC_CHICK
44–48 54–57 16–20 84–89 112–119 135–143 184–194 57–71 44–57 36–52
PGFTY NRRF RELEEⴱ RDILNQ PILPEYLQ QTAADQAREⴱ WEKAFKDEDTQ NTQATNRNTDGSTDY QSIGTENTEENRRFⴱ DNYRGYSLGNWVCAAKF
584.27 592.33 675.33 758.42 972.54 989.46 1396.64 1657.70 1680.79 1963.91
149 ⫾ 2 153 ⫾ 1 166 ⫾ 1 184 ⫾ 1 213 ⫾ 1 214 ⫾ 1 275 ⫾ 2 306 ⫾ 3 320 ⫾ 1 351 ⫾ 2
3.62 ⫾ 0.05 3.53 ⫾ 0.03 3.26 ⫾ 0.03 2.93 ⫾ 0.01 2.52 ⫾ 0.01 2.51 ⫾ 0.01 1.96 ⫾ 0.02 1.76 ⫾ 0.02 1.68 ⫾ 0.00 1.53 ⫾ 0.01
⫺10.2 ⫺8.8 ⫺9.7 ⫺7.3 ⫺9.8 ⫺10.5 ⫺9.7 ⫺10.4 ⫺7.1 ⫺8.1
J Am Soc Mass Spectrom 2007, 18, 1232–1238
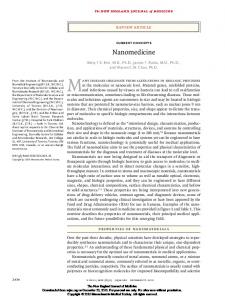
were generated by digesting nine standard proteins with three proteolytic enzymes (trypsin, chymotrypsin, and pepsin). Trypsin cleaves proteins to yield peptides having Lys and Arg at the C-terminus, chymotrypsin cleaves on the C-terminal side of Trp, Tyr, Met, Leu, or Phe, and pepsin cleaves C-terminal to Ala, Leu, Phe, or Tyr. Because each of these enzymes has very different cleavage sites, we were able to produce a diverse mixture of peptides that can be used to examine peptide “conformation space,” i.e., 2D plot of ion mobility collision cross-section versus m/z values. The peptides examined in study were characterized by three methods: (1) accurate m/z values of all peptides were obtained by using high-resolution MALDI-MS and compared to a peptide fragment list generated in silico [21], (2) peptide assignments were confirmed using MALDI-TOF/TOF-MS, and (3) the peptide ion collision cross-sections were measured using the MALDI-IM-MS. The data from these experiments are limited to singly-charged peptide ions. The compiled database (Supplementary Table, which can be found in the electronic version of this article) contains data for 607 peptides: 152 tryptic peptides, 295 chymotryptic peptides, and 139 peptic peptides, and a few redundant peptides. That is, 21 of the peptides generated by chymotrypsin were also found in the pepsin digests. The peptides included in the database do not include post-translationally modified peptides, with the exception of three oxidized peptides. Figure 1 contains a plot of conformation space for the entire peptide database. Most peptide signals are clustered along a nonlinear “trendline,” which we will refer to as the “average mobility-mass correlation” [1]. The solid line in Figure 1 is a third-order polynomial fit,
CROSS-SECTION DATABASE OF PEPTIDE IONS
1235
R2 ⫽ 0.988) to the individual data points. The majority (63%) of peptide signals correlate quite well (within 3%) to the average, globular mobility-mass correlation (Table 1). In our previous work, we used linear regression of the data to describe the correlation between collision cross-section and m/z [29, 30], but linear regression analysis is only valid over a small range of m/z values, owing to the effective surface area-to-m/z relationships for peptide conformation space. Thus, as the diameter (d) of a spherical (globular) ion increases, its volume (d3, proportional to mass) increases more quickly than the surface area (d2), which results in a nonlinear correlation between collision cross-section and m/z. The average mobility-mass correlation derived from the data shown in Figure 1 is consistent with the previous database generated by Clemmer and colleagues (a dataset of 420 singly-charged peptides generated by electrospray ionization and analyzed by IM-TOF-MS) [18]. For peptide collision cross-sections measured using both MALDI (this work) and electrospray [18], we find reasonably good correlation between the measured values, but in some cases the collision cross-sections differ by as much as 3% to 7% and in a few cases, differences of as much as 10% are observed. Although the reason for these observed differences is still unclear, more comparisons and molecular modeling studies are needed to completely resolve this issue. At this juncture apparently the differences in collision cross-sections are the result of structural differences for the ions. That is, apparently, ESI yields gas-phase ions that can differ in terms of structure or conformation from those formed by MALDI (vide infra). There are 38 (out of 607) peptide ions that have
Figure 1. Plot of ion-neutral collision cross-sections versus m/z for 607 [M ⫹ H]⫹ peptide ions. The solid line corresponds to a third-order polynomial fit to the data (R2 ⫽ 0.988) and corresponds to the average mobility-mass correlation (y ⫽ 2.81ⴱ10⫺9x3 ⫺ 3.55ⴱ10⫺5x2 ⫹ 2.32ⴱ10⫺1x ⫹ 41.91, R2 ⫽ 0.988). The dashed lines represent ⫾7% deviation from the fit.
1236
TAO ET AL.
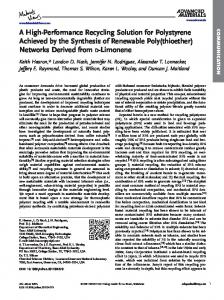
collision cross-sections that are larger than 7% from that expected for globular ions (Table 2), and most (71%) of these are tryptic peptides (C-terminal Lys or Arg residues). Jarrold showed that positively-charged peptide ions with basic residues near the C-terminus have relatively high helical propensities [14, 19, 31], and we have found similar trends for a series of model peptides specifically designed to examine the effects of C-terminal charge carriers on gas-phase ion structure. [Helical Preferences for Model Peptide Ions Containing Multiple Basic Sites: A Combined Experimental and Molecular Modeling Study; Janel R. McLean, John A. McLean, Lisa M. Peréz, C. Nick Pace, J. Martin Scholtz, and David H. Russell in preparation for submission to Journal of the American Chemical Society]. Thus, we suggest that peptide ions having larger than predicted collision cross-sections correspond to extended conformations and can be good candidates for helical structures. One particularly important issue is related to structure(s) of peptide ions formed by electrospray versus those formed by MALDI. As a specific example, Clemmer reported a collision cross-section for TGPNLHGLFGR [M ⫹ H]⫹ions of 258 Å2, but we obtained a value of 286 Å2, a difference of ⬃9%. We performed extensive analysis of the data and are convinced that the differences are outside the bounds of experimental error. Using molecular modeling and molecular orbital calculations, we identified two helical structures (Figure 2) that agree very well with the experimental collision cross-sections. Both structures appear to possess significant helical character, but the two structures differ in terms of the orientation of the side chains near the C-terminus. That is, Structure A contains a turn at the C-terminus owing to hydrogen bonding interactions between the guanidinium ion on the arginine side chain and glycine (10G), which elongates the structure. This type of interaction is absent in Structure B. The question concerning whether these differences are related to the specific details of the sample preparation, differences in the ionization processes, or the internal energies of gas-phase ions remains unanswered; however, we are continuing to explore this system as well as other ions where similar differences have been observed. Such observations underscore the effects of peptide composition, especially charge-carrying residues, on the structure(s) of gas-phase peptide ions. For example, addition of HK to the TGPNLHGLFGR peptide, residues 28 to 38 of cytochrome c, results in dramatic changes in ion structure. The helical region of TGPNLHGLFGR spans the residues GPNLHGL, whereas the residues TGPNL of HKTGPNLHGLFGR, which correspond to residues of 26 to 38 of cytochrome c, adopt a turn structure. The preference for helical versus turn conformation appears to be related to the location of charge, i.e., the principle charge site for TGPNLHGLFGR is the Cterminal arginine, whereas the preferred charge carrying region of HKTGPNLHGLFGR is potentially the N-terminal HK residues [32]. This explanation is also supported by marked differences in the fragmenta-
J Am Soc Mass Spectrom 2007, 18, 1232–1238
Figure 2. Proposed structures for TGPNLHGLFGR [M ⫹ H]⫹ions consistent with the ion-neutral collision cross-sections measured by (a) MALDI and reported for (b) ESI [18], respectively. The images are produced using VMD (UIUC, Urbana-Champaign, IL). The colors represent different types of residues; white denotes nonpolar residues, green denotes polar residues, blue denotes basic residues, and red denotes acidic residues. ␣-helical regions are given as coiled ribbons.
tion spectra of the two peptides, i.e., TGPNLHGLFGR [M ⫹ H]⫹ ions dissociate to yield a much higher abundance of yi type ions, owing to the C-terminal charge carrier, and HKTGPNLHGLFGR [M ⫹ H]⫹ ions yield almost exclusively ai and bi type fragment ions. There are a number of peptides that exhibit collision cross-sections which are ca. 7% smaller (more compact structures) than the average (10 out of 607 peptides, Table 3). The majority of these peptides are the products of pepsin digestion. We previously showed that gasphase phosphorylated peptide ions exhibit compact structures [1, 30, 33]. Although the peptides which fall below the average mobility-mass correlation in our database are not modified, many of them have multiple acidic and polar residues which could lead to formation of salt-bridged structures and/or H-bonding between acidic and basic side chains, which could significantly reduce collision cross-sections [27, 34]. Furthermore, the average number of polar residues increases across the classes of peptides listed in Tables 1, 2, and 3; for peptides that fall on or near the globular mobility-mass correlation (Table 1), ⬃48% are polar, whereas only 34%
J Am Soc Mass Spectrom 2007, 18, 1232–1238
of the residues of the peptides which occur above the globular trendline (Table 2) are polar. The compact peptide ions which fall below the globular mobilitymass correlation (Table 3) are 59% polar. Thus, apparently the number of polar residues can be related to the conformations of peptide ions. That is, the presence of amino acids that can form a salt-bridge and/or H-bond interactions increases the packing efficiency of the peptide ions and reduces the collision cross-section. Attributing compact conformations to peptide ions that contain hydrophilic side chains is indirectly supported by data for peptide ions that contain nonpolar residues. The presence of nonpolar amino acids appears to contribute more significantly to collision cross-sections than do polar groups, because nonpolar side chains do not contribute to charge solvation or participate in charge– dipole or dipole– dipole interactions [34], or cation– interactions.
Conclusions Ion-neutral collision cross-sections for 607 [M ⫹ H]⫹ peptide ions are compiled into a dataset containing structure and mass information. More importantly, the average mobility-mass correlation has been determined for singlycharged peptides up to ca. 5000 m/z. MALDI-IM-MS separations can be used to screen peptide libraries for peptides with specific gas-phase structure and aid in deciphering important trends in sequence space which dictate anhydrous structure. We are currently focusing our efforts on mining the database for structural information that may have utility for both proteomics applications, i.e., protein identification, as well as biophysical studies. For example, the collision cross-sections for GRKTGQAPGFTY (287 Å2) and HPEYAVSVLLR (309 Å2) are quite different (⬃10%) even though the m/z values of these ions differ by only 1.06 Da (0.08%). Extensive molecular dynamics simulations are underway to better understand the complex effects of amino acid sequence on anhydrous structure.
Acknowledgments Funding for this work was provided by U.S. Department of Energy, Basic Energy Sciences (BES) program, National Institutes of Health (RR019587), and the Robert A. Welch Foundation (A-1176). The authors thank Lisa M. Peréz (Laboratory for Molecular Simulation, TAMU) for helpful discussions.
References 1. McLean, J. A.; Ruotolo, B. T.; Gillig, K. J.; Russell, D. H. Ion MobilityMass Spectrometry: A New Paradigm for Proteomics. Int. J. Mass Spectrom. 2005, 240, 301–315. 2. Hoaglund-Hyzer, C. S.; Li, J.; Clemmer, D. E. Mobility Labeling for Parallel CID of Ion Mixtures. Anal. Chem. 2000, 72, 2737–2740. 3. Lee, Y. J.; Hoaglund-Hyzer, C. S.; Taraszka, J. A.; Zientara, G. A.; Counterman, A. E.; Clemmer, D. E. Collision-Induced Dissociation of Mobility-Separated Ions Using an Orifice-Skimmer Cone at the Back of a Drift Tube. Anal. Chem. 2001, 73, 3549 –3555.
CROSS-SECTION DATABASE OF PEPTIDE IONS
1237
4. Stone, E.; Gillig, K. J.; Ruotolo, B.; Fuhrer, K.; Gonin, M.; Schultz, A.; Russell, D. H. Surface-Induced Dissociation on a MALDI-Ion Mobility-Orthogonal Time-of-Flight Mass Spectrometer: Sequencing Peptides from an “In-Solution” Protein Digest. Anal. Chem. 2001, 73, 2233–2238. 5. Stone, E. G.; Gillig, K. J.; Ruotolo, B. T.; Russell, D. H. Optimization of a Matrix-Assisted Laser Desorption Ionization-Ion Mobility-SurfaceInduced Dissociation-Orthogonal-Time-of-Flight Mass Spectrometer: Simultaneous Acquisition of Multiple Correlated MS1 and MS2 Spectra. Int. J. Mass Spectrom. 2001, 212, 519 –533. 6. Badman, E. R.; Myung, S.; Clemmer, D. E. Gas-Phase Separations of Protein and Peptide Ion Fragments Generated by Collision-Induced Dissociation in an Ion Trap. Anal. Chem. 2002, 74, 4889 – 4894. 7. Hoaglund-Hyzer, C. S.; Lee, Y. J.; Counterman, A. E.; Clemmer, D. E. Coupling Ion Mobility Separations, Collisional Activation Techniques, and Multiple Stages of MS for Analysis of Complex Peptide Mixtures. Anal. Chem. 2002, 74, 992–1006. 8. Hilderbrand, A. E.; Myung, S.; Srebalus Barnes, C. A.; Clemmer, D. E. Development of LC-IMS-CID-TOF-MS Techniques: Analysis of a 256 Component Tetrapeptide Combinatorial Library. J. Am. Soc. Mass Spectrom. 2003, 14, 1424 –1436. 9. Clowers, B. H.; Hill, H. H. Influence of Cation Adduction on the Separation Characteristics of Flavonoid Diglycoside Isomers Using Dual Gate-Ion Mobility-Quadrupole Ion Trap Mass Spectrometry. J. Mass Spectrom. 2006, 41, 339 –351. 10. Koomen, J. M.; Ruotolo, B. T.; Gillig, K. J.; McLean, J. A.; Russell, D. H.; Kang, M.; Dunbar, K. R.; Fuhrer, K.; Gonin, M.; Schultz, J. A. Oligonucleotide Analysis with MALDI-Ion-Mobility-TOF-MS. Anal. Bioanal. Chem. 2002, 373, 612– 617. 11. Woods, A. S.; Ugarov, M. V.; Egan, T.; Koomen, J. M.; Gillig, K. J.; Fuhrer, K.; Gonin, M.; Schultz, J. A. Lipid/Peptide/Nucleotide Separation with MALDI-Ion Mobility-TOF-MS. Anal. Chem. 2004, 76, 2187– 2195. 12. Clemmer, D. E.; Hudgins, R. R.; Jarrold, M. F. Naked Protein Conformations: Cytochrome c in the Gas Phase. J. Am. Chem. Soc. 1995, 117, 10141–10142. 13. Shelimov, K. B.; Jarrold, M. F. Conformations, Unfolding, and Refolding of Apomyoglobin in Vacuum: An Activation Barrier for Gas-Phase Protein Folding. J. Am. Chem. Soc. 1997, 119, 2987–2994. 14. Hudgins, R. R.; Ratner, M. A.; Jarrold, M. F. Design of Helices That Are Stable in Vacuo. J. Am. Chem. Soc. 1998, 120, 12974 –12975. 15. Ruotolo, B. T.; Verbeck, G. F.; Thomson, L. M.; Gillig, K. J.; Russell, D. H. Observation of Conserved Solution-Phase Secondary Structure in GasPhase Tryptic Peptides. J. Am. Chem. Soc. 2002, 124, 4214 – 4215. 16. Ruotolo, B. T.; Russell, D. H. Gas-Phase Conformations of Proteolytically Derived Protein Fragments: Influence of Solvent on Peptide Conformation. J. Phys. Chem. B 2004, 108, 15321–15331. 17. Valentine, S. J.; Plasencia, M. D.; Liu, X.; Krishnan, M.; Naylor, S.; Udseth, H. R.; Smith, R. D.; Clemmer, D. E. Toward Plasma Proteome Profiling with Ion Mobility-Mass Spectrometry. J. Proteome Res. 2006, 5, 2977–2984. 18. Valentine, S. J.; Counterman, A. E.; Clemmer, D. E. A Database of 660 Peptide Ion Cross-Sections: Use of Intrinsic Size Parameters for Bona Fide Predictions of Cross-Sections. J. Am. Soc. Mass Spectrom. 1999, 10, 1188 –1211. 19. Hudgins, R. R.; Mao, Y.; Ratner, M. A.; Jarrold, M. F. Conformations of GlynH⫹ and AlanH⫹ Peptides in the Gas Phase. Biophys. J. 1999, 76, 1591–1597. 20. Park, Z. Y.; Russell, D. H. Thermal Denaturation: A Useful Technique in Peptide Mass Mapping. Anal. Chem. 2000, 72, 2667–2670. 21. Wilkins, M. R.; Lindskog, I.; Gasteiger, E.; Bairoch, A.; Sanchez, J.-C.; Hochstrasser, D. F.; Appel, R. D. Central Clinical Chemistry Laboratory, Geneva University Hospital, Geneva, Switzerland. Detailed Peptide Characterization Using PEPTIDEMASS—A World-Wide-Web-accessible tool. Electrophoresis 1997, 18, 403– 408. 22. Gillig, K. J.; Ruotolo, B. T.; Stone, E. G.; Russell, D. H.; Fuhrer, K.; Gonin, M.; Schultz, J. A. Coupling High-Pressure MALDI with Ion Mobility/ Orthogonal Time-of-Flight Mass Spectrometry. Anal. Chem. 2000, 72, 3965–3971. 23. Mason, E. A.; McDaniel, E. W. Transport Properties of Ions in Gases; Wiley: New York, 1988; pp 1–29. 24. Verbeck, G. F.; Ruotolo, B. T.; Gillig, K. J.; Russell, D. H. Resolution Equations for High-Field Ion Mobility. J. Am. Soc. Mass Spectrom. 2004, 15, 1320 –1324. 25. Ruotolo, B. T.; McLean, J. A.; Gillig, K. J.; Russell, D. H. The Influence and Utility of Varying Field Strength for the Separation of Tryptic Peptides by Ion Mobility-Mass Spectrometry. J. Am. Soc. Mass Spectrom. 2005, 16, 158 –165. 26. Wyttenbach, T.; von Helden, G.; Bowers, M. T. Gas-Phase Conformation of Biological Molecules: Bradykinin. 1996, 118, 8355– 8364. 27. Sawyer, H. A.; Marini, J. T.; Stone, E. G.; Ruotolo, B. T.; Gillig, K. J.; Russell, D. H. The Structure of Gas-Phase Bradykinin Fragment 1-5 (RPPGF) Ions: An ion mobility spectrometry and H/D exchange ion-molecule reaction chemistry study. J. Am. Soc. Mass Spectrom. 2005, 16, 893–905. 28. http://nano.chem.indiana.edu/software.html. 29. Ruotolo, B. T.; Gillig, K. J.; Stone, E. G.; Russell, D. H. Peak Capacity of Ion Mobility Mass Spectrometry: Separation of Peptides in Helium Buffer Gas. J. Chromatogr. B 2002, 782, 385–392. 30. Ruotolo, B. T.; Gillig, K. J.; Woods, A. S.; Egan, T. F.; Ugarov, M. V.; Schultz, J. A.; Russell, D. H. Analysis of Phosphorylated Peptides
1238
TAO ET AL.
by Ion Mobility-Mass Spectrometry. Anal. Chem. 2004, 76, 6727– 6733. 31. Hudgins, R. R.; Jarrold, M. F. Helix Formation in Unsolvated AlanineBased Peptides: Helical Monomers and Helical Dimers. J. Am. Chem. Soc. 1999, 121, 3494 –3501. 32. Slaton,, J. G., Russell,, W. K., Russell,, D. H. Factors Affecting Gas-Phase Peptide Ion Fragmentation: N-Terminal Residue, Charge Carrier, and Conformation. J. Am. Soc. Mass Spectrom., in press.
J Am Soc Mass Spectrom 2007, 18, 1232–1238
33. Ruotolo, B. T.; Verbeck, G. F.; Thomson, L. M.; Woods, A. S.; Gillig, K. J.; Russell, D. H. Distinguishing Between Phosphorylated and Nonphosphorylated Peptides with Ion Mobility-Mass Spectrometry. J. Proteome Res. 2002, 1, 303–306. 34. Henderson, S. C.; Li, J.; Counterman, A. E.; Clemmer, D. E. Intrinsic Size Parameters for Val, Ile, Leu, Gln, Thr, Phe, and Trp Residues from Ion Mobility Measurements of Polyamino Acid Ions. J. Phys. Chem. B 1999, 103, 8780 – 8785.