Tukey estimation (BT) [6], auto regressive (AR) [7][8], and. Wavelets processing using Haar and db10 wavelets [10]. In this paper we used three window sizes ...
Proceedings of the 28th IEEE EMBS Annual International Conference New York City, USA, Aug 30-Sept 3, 2006
ThEP3.1
A Comparison of Real-Time Performance of Signal Processing Algorithms for Minimum Latency Detection of Hypovolemic States Emil Jovanov1, Paul Cox2, J. Philip Saul3, Jose Salinas4, Kathy L. Ryan4, Victor A. Convertino4 1
Electrical and Computer Engineering, University of Alabama in Huntsville, Huntsville, Alabama, U.S.A. 2 PERL Research LLC, Huntsville, Alabama, U.S.A. 3 MUSC Children’s Hospital, Charleston, South Carolina, U.S.A. 4 U.S. Army Institute of Surgical Research, Fort Sam Houston, Texas, U.S.A.
Abstract—Algorithms
for real-time ambulatory monitoring of physiological signals often run on platforms which have very limited processing power and memory. Therefore, in addition to functionality, it is necessary to carefully consider real-time performance requirements. This is particularly important for physiological monitoring of life threatening conditions such as hemorrhage. In this paper we present a comparison of several algorithms as candidates for implementation on a prehospital ambulatory monitor of hypovolemic states. The algorithms were tested on data from lower body negative pressure (LBNP) experiments that were used to simulate hypovolemic states. We also present a promising real-time wavelet algorithm for heart rate variability (HRV) processing in prehospital ambulatory monitoring applications.
Keywords—Real-time processing, Heart Rate Variability,
Performance, Hemorrhage, Hypovolemic states. I. INTRODUCTION Reliable real-time processing of physiological signals in ambulatory settings is a very challenging task. Signals are often corrupted and require additional filtering for noise removal and estimation of missed events [1]. In addition, wearable monitors typically have severe resource constraints, such as processing power, limited battery capacity, small memories, etc. [2]. Furthermore, expected use of monitoring systems in austere environments creates additional systematic issues which both increase reliability requirements and necessitate robust and fault tolerant processing algorithms. Depending on the application, the availability of sensors and sensor streams may also create a significant problem. Multiple sensors (respiration, heart rate, continuous blood pressure) increase reliability of the detection algorithms but may not be available in the ambulatory settings or the battlefield. Therefore, it is necessary to carefully design a target application for the minimum set of required sensors and limited resources. By decreasing system requirements of a given application, system designers can reduce size and weight of the target system and significantly improve a user’s acceptance and in-field performance. We are developing algorithms for portable physiological monitoring that could be used for 1-4244-0033-3/06/$20.00 ©2006 IEEE.
assessing severity of hemorrhage. Potential applications include battlefield monitoring and triage, emergency room monitoring, and other ambulatory applications [3][4]. Physiological changes during reduction of central blood volume have been modeled using: a) animal studies, b) application of Lower Body Negative Pressure (LBNP) in human subjects [5], c) blood donation experiments, and d) data obtained from trauma patients [4]. LBNP experiments are widely accepted as satisfactory simulation of human hypovolemic states. Parameters of heart rate variability (HRV) and multivariate analysis have been successfully used for analysis of hypovolemic states [6][7][8]. However, all these algorithms fail to provide a real time decision-support tool since they are generated from off-line, non real-time processing. Initial physiological changes are usually too subtle for standard monitoring equipment, but could be critical for triage and life saving efforts. Sophisticated signal processing algorithms usually involve significant latency that is not critical for off-line analysis, but can be very important for ambulatory or battlefield monitoring. Therefore, a careful trade-off between performance and system requirement is necessary for successful application. In this paper we present a performance comparison of some candidate algorithms and preliminary analysis of three records from LBNP experiments using only HRV data. II. METHODS IRB approval was obtained for testing of hypovolemia responses using an LBNP model on healthy subject volunteers. Application of negative pressure on the lower extremities causes the redistribution of fluid from the central and upper body to the lower body allowing for the study of hemodynamic issues and responses as fluid leaves the central circulation. Previous studies have suggested that this model may be a useful surrogate for simulation of hemorrhage effects on the cardiovascular system for both civilian and military environments [5]. For this study, volunteer subjects were instrumented for continuous and synchronized recording of vital signs at 500 Hz through several stages of progressive negative pressure. Data were captured and digitized through a single digital acquisition system which provided a centralized data recording and management system of all instrument data
1674
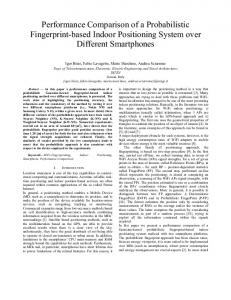
streams. ECG recordings were obtained using a 3-lead ECG amplifier and signal conditioner using standard lead-II placements. We used our custom program for R peak detection based on the traditional Pan and Thompkins algorithm [9]. All signals were visually checked for errors, but we didn’t have any missed beats due to excellent signal quality and controlled experimental settings. A cubic spline interpolation was implemented to generate interbeat intervals at 1 KHz (1 ms precision). Increased sampling rate provided better signal resolution for spectral and HRV analysis. Changes in interbeat intervals (RRint) during a LBNP experiment are presented in Figure 1. Triangular markers on the plot represent changes in LBNP pressure, while the dotted line represents LBNP. Spectral estimates were calculated on a splineinterpolated RR series sampled with interpolation frequency Fi = 3 Hz. Candidate spectral processing algorithms included Fast Fourier Transform (FFT) with BlackmanTukey estimation (BT) [6], auto regressive (AR) [7][8], and Wavelets processing using Haar and db10 wavelets [10]. In this paper we used three window sizes (256, 512, and 1024 points) for BT analysis. Smaller windows were not acceptable due to very small number of real heart beats, but they also proved useless in our analysis as well. We determined that even a window of 256 samples was not sufficient for our analysis. That is logical since the window of 256 samples covered less than 6 cycles of the lowest frequency in the frequency band of interest. In order to support real-time wavelet analysis with minimum overhead, we selected interpolation frequency for RR intervals to generate wavelet detail in the middle of the frequency band of interest. Since we monitored changes in the LF band of HRV centered around 0.1 Hz [6], we
selected interpolation frequency of Fi = 2.133 Hz, which generated detail 4 (D4) centered at 0.1 Hz. According to wavelet theory, the frequency band covered by D4 coefficients was [0.0667 – 0.1333 Hz]. We monitored instantaneous change of power in D4 by applying a moving average filter of different lengths (10, 15, and 20 samples). The analysis of execution times of selected algorithms was performed using Matlab’s Profiler, which is a standard tool for performance measurement of Matlab programs. The execution time of each method was obtained as an average of five runs. All algorithms were processing actual LBNP records, as the one represented in Fig. 1. III. RESULTS We observed a trend of increased heart rate and decreased HRV during advanced stages of the LBNP protocol (Fig. 1). It was difficult to detect changes during the initial application of LBNP (period t = 5 to 11 min, or LBNP = -15 to -30 mmHg). A trend of decreased values of HRV power in the LF band can be seen in Fig. 2. Therefore, we applied different spectral estimation algorithms and different window lengths to test reliability of detection of this trend during initial LBNP changes that correlated with initial and mild hypovolemic changes. Different window lengths (512 and 1024 samples) will have different initial latency necessary to collect full window of samples, as represented in Fig. 2. It is important to emphasize that for the FFT length (NFFT) = 1024 samples even the first epoch contains some samples after change of LBNP. At the same time, we compared the execution time and latency as important factors for real-time system implementation.
RRint [ms] 15
1400
30
45
60
70
80
Recovery
1200
1000
800
600
400
5
10
15
t [min]
20
25
30
35
Fig. 1. RR intervals during LBNP experiment (subject A106); Real-time measurement of LBNP represented as dashed line (0 to -80 mmHg).
1675
LFpower [ms2]
15
700
30
500
300 NFFT=512 NFFT=1024 100
0
1
2
3
4
5
6
7
8
9
10
11
Fig. 2. Comparison of variability of spectral estimates for different FFT lengths (1024, 512, and 256 samples); Relative change of spectral power in LF HRV band for subject A107 during LBNP experiment. Marks represent LBNP change (-15 and -30 mmHg). 200 150 100 50 0
2
4
6
8
10
12
14
800 600 400 200 0
2 4 6 8 10 12 14 Fig. 3. A comparison of instantaneous spectral estimates using wavelets and FFT spectrum. Upper plot: moving average of coefficients of detail 4 of Haar wavelet (moving average filter length 15 points), axes: time [min] and absolute value of filtered D4 coefficients. Lower plot: FFT spectral power (Fs=3Hz, NFFT=512, NFFT_Shift=24points) in LF band, axes time [min] and spectral power [ms2] in LF band covered by D4 of wavelet transform (0.067-0.133 Hz). Subject A106; Arrows represent change of LBNP to -15 and -30mmHg.
The results of performance analysis of the selected algorithms are presented in Table I. All execution times are represented as relative to Blackman-Tukey estimate with 256 sample window. The absolute execution time of BT_256 algorithm was 2.1 sec for 836 one-second epochs on a Pentium IV PC running at 2.4 GHz and 512 MB of RAM. The performance of AR algorithms is data dependent, but it is interesting to note that the execution time was not significantly influenced by the AR order. We varied the order between 20 and 40, with only minor changes in performance. Wavelet processing requires significantly less processing power and features very low latency. However, reliable estimates of certain frequency components could be achieved only by collecting and averaging a sufficient number of wavelet details, which increases latency of the algorithm.
IV. DISCUSSION AND CONCLUSIONS An illustration of typical problems of real-time signal processing is presented in Fig. 2. It can be seen that spectral estimation using longer windows introduce additional latency. In the case of a 1024-point window, the processing introduced a latency of estimated spectrum of NFFT/2/Fi = 170 seconds, a result consistent with the first estimated spectral values starting at t | 3 min (Fig. 2). Moreover, the result of spectral processing averages changes in the whole window (~ 6 minutes), and mostly represents estimates in the middle of the window. However, the result is very smooth. The estimated slope of relative change of spectral power in custom (wavelet determined) LF band in Fig. 2 for the 1024-point window was -9.8%/min.
1676
An example comparison of the results of wavelet and equivalent FFT spectral processing is given in Fig. 3. These results demonstrate that wavelet processing using the simplest Haar filter (length 2), with moving average filter of 15 samples (upper plot) provides comparable spectral estimation performance with BT spectrum estimate of 512 points (lower plot). However, the BT processing required more than 36 times longer execution time (Table I, ratio of execution time in rows 2 and 7). The latency of wavelet processing was 56 seconds compared with 85 seconds for FFT spectral estimation. This means that for the given application, a wavelet algorithm can generate comparable spectral estimates 35% earlier, which may be significant for estimation of hypovolemic state. In this paper we presented preliminary performance evaluation of candidate algorithms for real-time detection of hypovolemic states using spectral analysis of HRV. We demonstrated that different candidate algorithms can have up to two orders of magnitude difference in execution time, and more than several minutes of latency. Any real-time system design must take these performance issues into account. In our application, we are developing a real-time, minimum latency algorithm for early detection of hypovolemic changes as an indication of hemorrhage and injury severity. We demonstrated that our wavelet processing algorithm may represent a very promising approach for real-time estimation of blood loss. REFERENCES [1]
[2]
P. Albrecht, R.J. Cohen, “Estimation of heart rate power spectrum bands from real-world data: dealing with ectopic beats and noisy data,” Proc. Computers in Cardiology, pp. 311-314, Sep. 25-28, 1988. D. Raskovic, T. Martin, E. Jovanov, “Medical monitoring applications for wearable computing,” The Computer Journal, vol. 47, No. 4, pp. 495-504, July 2004.
TABLE I PERFORMANCE COMPARISON OF CANDIDATE ALGORITHMS Algorithm BT_256 BT_512 BT_1024 AR_256 AR_512 AR_1024 Haar Wavelet db10 Wavelet [3]
Relative execution time 1 1.26 2.06 1.85 2.08 2.64 0.03 0.06
V.A. Convertino, J.B. Holcomb. “Advanced diagnostics for the combat medic,” Army Medical Department Journal, PB 8-03, pp. 4248, July-Sep. 2003. [4] W.H. Cooke, J. Salinas, V.A. Convertino, D.A. Ludwig, D. Hinds, J.H. Duke, F.A. Moore, J.B. Holcomb, “Heart rate variability and its association with mortality in prehospital trauma patients,” J. Trauma, vol. 60, No. 2, pp. 363-370, Feb. 2006. [5] W.H. Cooke, K.L. Ryan, V.A. Convertino, “Lower body negative pressure as a model to study progression to acute hemorrhagic shock in humans,” J. Appl. Physiol., vol. 96, No. 4, pp. 1249–1261, Apr. 2004. [6] J.K. Triedman, R.J. Cohen, J.P. Saul, “Mild hypovolemic stress alters autonomic modulation of heart rate,” Hypertension, vol. 21, pp. 236247, 1993. [7] J.P. Saul, R.D. Berger, M.H. Chen, R.J. Cohen, “Transfer function analysis of autonomic regulation. II. Respiratory sinus arrhythmia,” Am. J. Physiol. Heart Circ. Physiol., vol. 256, pp. H153–H161, 1989. [8] R. Barbieri, A.M. Bianchi, J.K. Triedman, L.T. Mainardi, S. Cerutti, J.P. Saul, “Model dependency of multivariate autoregressive spectral analysis: quantifying cardiovascular control using bivariate and trivariate models,” IEEE Eng. Med. Biol., vol. 16, No. 5, pp. 74-85, 1997. [9] T. Martin, E. Jovanov, D. Raskovic, “Issues in wearable computing for medical monitoring applications: a case study of a aearable ECG monitoring device,” Proc. International Symposium on Wearable Computers, Atlanta, pp. 43-50, Oct. 2000. [10] A. Cohen, J. Kovacevic, “Wavelets: the mathematical background,” Proc. IEEE, vol. 84, pp. 514–522, Apr. 1996.
1677