... color image segmentation. PUC-Rio - Certificação Digital Nº 1213412/CA ... (2000), Maxwell & Zhang (2005), Zhong et al. (2005) and Happ et al. (2013). The.
2 STATE OF THE ART
This chapter presents the most relevant works in the field of image segmentation, emphasizing the ones most related to remote sensing applications. They are classified as high-level and low-level. Related works following similar approaches are mentioned too. Also, a classification of metrics for segmentation quality is presented. Finally, the proposed approach is presented.
PUC-Rio - Certificação Digital Nº 1213412/CA
2.1. Image Segmentation in Remote Sensing As described in the previous chapter, image segmentation aims to subdivide an image into its constituent regions or objects (Gonzales et al., 2008). In this section, a representative set of existing segmentation algorithms is examined and a brief description of some of them is provided. The purpose of this section is to give the reader an overview of the state-of-the-art in image segmentation, especially the ones related to remote sensing. The literature contains several excellent surveys about image segmentation strategies proposed in the last decades. Among the earliest ones that have been widely popular are the studies reported by Fu & Mui (1981) and Pal & Pal (1993). The first categorized segmentation approaches, developed during the 1970s and early 1980s for gray scale images, into three classes: clustering, edge detection and region extraction. The second reviewed more complex segmentation techniques introduced in the late 1980s and early 1990s that involved fuzzy/nonfuzzy mechanisms, Markov Random Fields (MRFs) probabilistic models, color information as well as neural networks – all of them were still in their early stages of development. The surveys done by Lucchese & Mitra (2001) and Cheng et al. (2001) were among the first that exclusively provided an in-depth overview of algorithms targeted at segmenting color images. Furthermore, Vantaram & Saber (2012) presented a comprehensive overview of image segmentation investigation occurred from 2001 to 2012. In their work, they group color image segmentation
CHAPTER 2. STATE OF THE ART
21
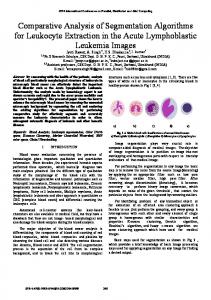
algorithms based on their technical foundation (low level taxonomy). So, image segmentation techniques can be broadly classified (see Figure 1) based on: 1. the image type, 2. the extent of human interaction, 3. the manner in which the image is represented for processing, 4. the number and type of attributes used and 5. the basic principle of operation. The last one discriminates segmentation algorithms as being either spatially blind or spatially guided, depending on whether or not spatial information is exploited. Further, a low-level taxonomy was proposed (see Figure 2), which
PUC-Rio - Certificação Digital Nº 1213412/CA
specifically groups segmentation procedures based on their technical components.
Figure 1: High level taxonomy of image segmentation algorithms (taken from Vantaram & Saber (2012)).
The selection of a segmentation algorithm usually is based on the envisaged application. For instance, Histogram Thresholding-based segmentation is a good option for gray-scale images such as medical images (tomography, X rays, etc.). However, it is not so popular in remote sensing areas especially in urban remote sensing applications due to the high degree of variability of spectral features. As the target of this study is remote sensing applications, this work focuses on segmentation approaches applicable to this field. One of the recent studies developed to categorize remote sensing image segmentation was conducted by Dey et al. (2010). This work provides an insight into the main technological aspects of image segmentation of optical remote sensing images. Based on them, the common segmentation approaches in remote sensing are highlighted in Figure 2 (blue rectangles). In consequence, this study does not cover all classes of algorithms but only the ones represented in red rectangles in Figure 2. In the
CHAPTER 2. STATE OF THE ART
22
following paragraphs, related works to the selected segmentation algorithms are
PUC-Rio - Certificação Digital Nº 1213412/CA
going to be reviewed.
Figure 2: Classification of segmentation algorithms based on a low-level taxonomy. The blue rectangles represent common segmentation algorithms applied in remote sensing while the red ones represent the selected algorithms for this dissertation (modified from Vantaram & Saber (2012)).
CHAPTER 2. STATE OF THE ART
23
Clustering-based segmentation algorithms are spatially blind techniques wherein the image data is viewed as a point cloud on a one-dimensional (1-D) gray scale axis or in a multidimensional color space depending on the image type. The biggest advantage of clustering approaches is their inherent simplicity and ease of implementation. However, the main problem is to define an appropriate number of clusters, especially when the dimensionality of the feature space is high. Some examples of clustering-based approaches are Mean-Shift segmentation (Comaniciu et al., 2002), Self-Organizing Map (SOM) Neural Networks (Visa et al., 1991), Fuzzy-based (Bandyopadhyay, 2005), among others. SOMs have not captured much attention in remote sensing. However, they have wide applications in medical imagery, (cf. Petersen et al., 2002), with other types of Artificial Neural Networks (ANN) such as Multilayer Perceptron (MLP) and Hopfield Network. PUC-Rio - Certificação Digital Nº 1213412/CA
Region-based approaches typically employ protocols involving growing, splitting and merging, individually or in suitable combinations. Region growing implies a process that starts from a single pixel or small predefined labeled set of pixels called “seed” and, based on a certain homogeneity criterion, iteratively aggregates pixels around it. Region splitting is a technique that is initiated with an inhomogeneous segmentation of an image, which is repetitively split until segments satisfying a particular homogeneity criterion are obtained. Region merging is a process in which sub-regions – potentially part of a large identifiable region – are fused together to yield a reduced set of segments that are spatially meaningful with respect to the input image content. Examples of region-based approaches applied to remote sensing have been developed by Baatz & Schäpe (2000), Maxwell & Zhang (2005), Zhong et al. (2005) and Happ et al. (2013). The first one is incorporated in eCognition/Definiens Developer, a commercial software product. This software revolutionized the field of remote sensing image segmentation with its immense possibility to provide GIS ready information (Blaschke, 2010). Bayesian-based approaches are a class of energy-based segmentation techniques that have maintained continued interest over the past few years among researchers of the probability theory field. These approaches take into account the neighborhood relationships which make them attractive for modelling texture and spatial context in the images. There are different probabilistic models such as
CHAPTER 2. STATE OF THE ART
24
Markov Random Fields (MRF), Gauss MRFs, Conditional Random Fields (CRF), and Gibbs Random Fields (GRF) among others. The primary advantage of Bayesian-based segmentation is the solid underlying theoretical foundation. They rely on statistical inference and a priori information about the underlying data. Consequently, it is extensively favored for segmenting images that contain nondeterministic content such as textures and statistical noise, which represents a challenging task for traditional segmentation approaches. One of the seminal papers about MRF in segmentation was done by Hansen & Elliot (1982). In remote sensing, related works have been developed by Jeon & Landgrebe (1992), Li et al. (2004) and Yang et al. (2010) among others. With the introduction of CRFs, as in the last example, the use of discriminative models for segmentation and classification tasks has become popular (Kuma, et al., 2003). CRFs directly model the conditional probability which can incorporate a rich set of arbitrary PUC-Rio - Certificação Digital Nº 1213412/CA
non-independent overlapping features of the observations. Graph-based approaches are a prominent category of energy-driven approaches that employ graph representations for image segmentation. An image can be represented as an undirected graph
(
), where every node
corresponds to an individual pixel and every edge component ( pairwise connects neighboring pixels elements in , represented as vertices . Additionally, each edge is assigned a weight (
) and
) based on the amount of
similarity between the two neighboring elements. Thus, for this representation, the ultimate goal from a segmentation viewpoint is to partition it utilizing metrics that yield a set of disconnected sub-graphs exemplifying meaningful regions that concur with scene content. There are many approaches based on graph representation for image segmentation such as Minimum Cut (Wu & Leahy, 1993), Normalized Cut (Shi & Mallik, 2000), Grab Cut (Rother et al., 2004) and Efficient Graph Segmentation (Felzenszwalb & Huttenlocher, 2004) among others. These kinds of approaches have not been extensively used in remote sensing so far. For that reason, it was chosen as one of the segmentation algorithms to be evaluated in this study.
CHAPTER 2. STATE OF THE ART
25
2.2. Segmentation Evaluation The qualitative and quantitative assessment of segmentation results is very important for further image processing as well as for choosing the appropriate approach for a given segmentation task. There are many studies on this field. Some of them either intends to compare various segmentation approaches (e.g. Estrada & Jepson, 2005) or different parameterizations of one algorithm (e.g. Palus & Kotyczka, 2001)). Moreover, the number of studies related to remote sensing has been increasing (e.g. Neubert & Meinel (2003), Carleer & Debeir
PUC-Rio - Certificação Digital Nº 1213412/CA
(2005), Neubert et al. (2006,2008) and Marpu et al. (2010) among others).
Figure 3: Classification of methods for evaluation of segmentation quality according to Zhang (modified from Zhang (2001)).
Similar to the segmentation theory itself, there is no established standard procedure for the evaluation of its results. A general classification of evaluation methods has been proposed by Zhang (1996). According to Zhang, segmentation algorithms can be evaluated analytically or empirically. The analytical methods directly examine and assess the segmentation algorithms themselves by analyzing their principles and properties. The empirical methods indirectly judge the segmentation algorithms based on their outcomes. It could be done by the comparison of the segmentation results with a reference segmentation (empirical discrepancy methods) or by measuring some desirable properties of segmented images (empirical goodness method). In Figure 3, a general scheme for image
CHAPTER 2. STATE OF THE ART
26
segmentation and evaluation is presented. In other words, analytical methods operate directly to the segmentation algorithm and discrepancy and goodness methods assess the segmentation result. The first one is a supervised method due to the necessity of a reference image to perform the comparison between it and the input image. On the other hand, goodness methods are not supervised because do not need a reference image. As this study is focused on an automated parameter tuning for image segmentation, quantitative measures are to be considered for the role of objective or fitness function. Most existing approaches are supervised methods using discrepancy measures between a reference and the segmentation. These approaches analyze the number of not-considered pixels in relation to the reference or directly address over- and under-segmentation by considering the number of segments. Examples of such metrics proposed for this purpose are the Fragmentation Index PUC-Rio - Certificação Digital Nº 1213412/CA
(Strasters & Gerbrands, 1991), the Are-Fit-Index
(Lucieer, 2004), the Hoover
metric (Hoover et al., 1996), etc. In Yang et al. (1995) and Neubert & Meinel (2003), shape is used as features to quantify the differences between the segmentation outcome and the reference regions. An extensive study is presented in Jiang et al. (2006) about distance measures and classified them by counting parts, set matching and information-theoretic distances. In Arbeláez et al. (2011), the overlap between regions is considered to define a quality score, called Segmentation Covering. In Zhang et al. (2004), a new entropy based evaluation approach is introduced, which leads to a very stable assessment measure using different segmentation outcomes. A mixed approach that combines analytical and empirical criteria is presented in Everingham et al. (2002). In this work, a multidimensional fitnesscost-space is defined instead of a single discrepancy-parameter-space. In Zhang et al (2005), a co-evaluation framework is proposed where different effectiveness measures judge the performance of the segmentation in different ways, and their associated values are combined by a machine learning approach which coalesces the results. A natural question arises in this context: how good is goodness metric? Thus, meta-measures have been defined for this purpose. Pont-Tuset & Marques (2013) proposed two new meta-measures and evaluate the performance of many segmentation quality metrics.
CHAPTER 2. STATE OF THE ART
27
2.3. Methodology According to the aforementioned objectives, the proposed approach is
PUC-Rio - Certificação Digital Nº 1213412/CA
represented in the flowchart of Figure 4:
Figure 4: Methodology followed for the development of this study.
Firstly, an input image and a set of parameters for initialization, which correspond to the segmentation algorithm, are given. Then, the segmentation is executed. This result, the segmentation outcome, is evaluated according to a selected metric. If this metric reaches its minimum value, the current set of parameters will be the optimal parameters. Otherwise, the optimization algorithm provides another set of parameters and the former steps are repeated. This loop stops when a global minimum of the metric is reached or a stopping criterion is attained. The segmentation algorithms selected for this dissertation are: Mean-Shift (Comaniciu & Meer, 2002), Graph-based segmentation (Felzenszwalb & Huttenlocher, 2004), Region merging-based (Happ et al., 2013) and CRF-based (Domke, 2013). They were selected for this study to include different approaches
CHAPTER 2. STATE OF THE ART
28
for image segmentation. Furthermore, on this set of algorithms, there is a wellknown approach (Mean-Shift), and a not very common approach used for remote sensing (Graph-based). The remainder algorithms are state-of-the-art approaches for image segmentation (Region Merging-based and CRF-based). For the optimization step, it was taken the Nelder-Mead algorithm (Nelder & Mead, 1965). It was selected based on the study performed by Ayma (2013). The metrics for segmentation evaluation are: Hoover metric (Hoover et al., 1996), Area-Fit-Index (Lucieer, 2004), Shape Index (Neubert & Meinel, 2003), Rand Index (Rand, 1971), Precision and Recall (Van Rijsbergen, 1979), Segmentation Covering (Arbeláez et al., 2011) and Reference Bounded Segments Booster (Feitosa et al., 2006). These quality metrics were selected to include
PUC-Rio - Certificação Digital Nº 1213412/CA
different approaches for segmentation assessment.