International Journal of Big Data (ISSN 2326-442X)
Vol. 2, No. 3, November 2015
1
A COMPREHENSIVE OVERVIEW OF OPEN SOURCE BIG DATA PLATFORMS AND FRAMEWORKS Pedro Almeida1, Jorge Bernardino1,2 1ISEC – Polytechnic of Coimbra , Portugal 2CISUC – Centre for Informatics and Systems of the University of Coimbra, Portugal
[email protected] ,
[email protected]
Abstract Big Data is the paradigm that represents the ability to analyze and cross-reference large amounts of data generated by computational systems and turn them into useful knowledge. This potential is one solution organizations can use to answer the challenge of getting closer to their users. Organization managers face the challenge of understanding the Big Data concept and the business strategies inherent to its use. The high number of challenges that need to be addressed creates a high number of proposed technical solutions that most times only overlap existing ones. Frequently managers face these issues as their organizations race against the competitors for a market share, without having resources to embrace not only Big Data but also other options that can give competitive advantage. Therefore, organization owners and managers must be educated on deployed platforms that can make them understand the benefits that can be achieved on short term. In this paper we aim to provide an overview of using Big Data with Open Source tools. We explain the Big Data concept, the potential value and the organizational strategies that must be studied in order to determine which benefits organizations can win from it. We analyze the strengths and drawbacks of five open source frameworks for distributed data programming – Hadoop, Spark, Storm, Flink and H2O – and seven open source platforms for Big Data Analytics – Mahout, MOA, R Project, Vowpal Wabbit, Pegasus, GraphLab Create and MLLib. There is no single platform that truly embodies a one size fits all solution, so this paper aims to help decision makers by providing as much information as possible and quantifying some tradeoffs. Keywords: Big Data, Open Source, Data Mining, Data Analysis
__________________________________________________________________________________________________________________
1. INTRODUCTION In a globalized world where competition between organizations is more aggressive, they need to be as close in time and accuracy as possible to the needs of their users. There is huge potential and value inside data waiting to be used by all individuals and organizations. The exploration of Big Data paves the way for everyone to extract insight and value from data generated both inside and outside their organizations or areas of interest (Assunção et al., 2015). Therefore, in corporate environment managers are going to have a better overview over their business and competitive advantages such as enhanced productivity, greater innovation and a consolidated position in the global market. However, the reality shows that very few managers are educated for the importance of data. In 2014 the
OECD (Organization for Economic Co-operation and Development) registered that 95% of enterprises are Small and Medium Enterprises (OECD, 2014). These companies do not have a large budget to accommodate the necessary resources to explore the power of data. Organizations, their leaders and managers need to know about the potential of Big Data and this has to be done by showing practical solutions that allow them not only to see results and value in the moment but also to see potential profits to be obtained in a short amount of time. The key lesson people have to understand about Big Data is that we can take advantage of it with minimal cost by using the vast myriad of Open Source Big Data Platforms. These platforms are the combination of hardware infrastructures and software tools used to acquire, store and analyze data. Data has value during a period of time. This window of opportunity is variable depending on the environment where data is being used. In business environments
International Journal of Big Data (ISSN 2326-442X) where costumer behavior and necessities change at a fast pace data only has value for a short period of time (Christofferson, 2014). This makes processing speed one of the key features of Big Data platforms. Integrity of data is also an important aspect the platforms must consider because corrupted data not only has no value but can lead managers to make wrong decisions based on erroneous facts. To complicate the work of data scientists trying to explain Big Data there are a number of issues that make it hard to have one or at least a small group of solutions ready to be presented to managers. It is not recommended that technical solutions are shown without giving an introduction on what the Big Data model is. It is also important to know ahead what the needs of the enterprise are so the chosen computational system can extract value that suits such needs. Working with Big Data is a complex process where the data analysis steps may require repetition until acceptable results are generated. This creates a vast amount of challenges that practical implementations have to address. There is a large amount of conceptual but also technical challenges that lie within exploring Big Data. This leads to the existence of a high number of different platforms where most don’t do more than overlapping what already exists in previous solutions. An important idea to retain is that the study and choice of what systems to use has to be done within a short period of time because of two problems – this field of research is constantly evolving and solutions deployed today may not be useful tomorrow. This happens for various reasons but the most important one is that the growth of data is exponential and solutions may stop being able to handle such large quantities of data in a near future making the investment worthless before it can give return on the investment. Enterprises wanting to optimize their scarce resources cannot afford to waste time with exploring all the available platforms and need help in finding the most suitable solution for their specific needs. For most of them it does not even come as a matter of wanting or not to explore the potential of Big Data but just as a matter of absolute impossibility due to lack of resources and know-how. Another essential lesson to be retained is that it is impossible to name one definitive platform that can be named as the best one for the needs of every individual, enterprise or organization. A great deal of research has already been done about Big Data and Big Data Platforms (MayerSchnberger et al., 2013), (O’Reilly Media, 2012), (Barata et al., 2014a), (Barata et al., 2014b). This research is usually done in two ways. The first is to
Vol. 2, No. 3, November 2015
2
study the requirements of one organization and create a set of tools that fulfills their specific needs. This approach requires a large amount of investment and time that only big enterprises are able to afford. The second is by studying the existing platforms and choosing the one that is closer to the requirements of the enterprise. This approach is preferred for Small and Medium Enterprises because it requires no further investment or development. Nevertheless, proprietary solutions require a significant investment. Open Source platforms offer solutions that are free but also easier to adapt to the specific requirements of each enterprise. In this paper we give a comprehensive overview of the use of Big Data with Open Source platforms. We begin by explaining the concept and the organizational strategies that need to be studied before moving forward for the choice of technical solutions. After that we study and compare five frameworks for distributed data processing (Hadoop, Spark, Storm, Flink and H2O) and seven Big Data Open Source Platforms (Mahout, MOA, R Project, Vowpal Wabbit, Pegasus, GraphLab Create and MLLib). We compare not only their technical characteristics but most important their capabilities for insertion in the segment of Small and Medium Enterprises. We compare this capability through analysis of parameters such as the ease of use of the interfaces and availability of programmers to manage the platform. This paper is a revised and extended version of our Big Data Congress 2015 paper (Almeida et al., 2015). New materials include (i) a new section describing five distributed programming frameworks (Section 4), (ii) a new section comparing these five frameworks (Section 5) (iii) and the addition of a new platform to the list of analyzed open source platforms (Section 6). The remainder of this paper is structured as follows. Section 2 explains the Big Data model and the Big Data Strategy. Section 3 overviews the features and requirements involved into Big Data Open Source Platforms and the Map Reduce programming paradigm. Section 4 describes the five distributed data processing frameworks. Section 5 compares the frameworks and provides an analysis on relevant characteristics for organizations needs, such as development maturity, modularity and integration. Section 6 describes the seven Big Data Open Source Platforms. Section 7 compares the platforms and studies if their features are helpful to fix the needs of enterprises. Finally, Section 8 presents concluding remarks and points out some future work.
International Journal of Big Data (ISSN 2326-442X)
Vol. 2, No. 3, November 2015
3
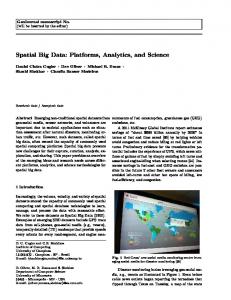
2. THE BIG DATA MODEL EXPLAINED There is not one final definition about what exactly is Big Data. In a very simple way Big Data can be defined just as a volume of data that is so large that it is difficult to process using traditional database and software techniques (Greer Jr., 2013). One of the first definitions was the 3V’s concept that considered Volume, Velocity and Variety (Laney, 2012), (Fayyad, 2012). This concept has evolved to 4V’s with the addition of Veracity (Vossen, 2013). The concept has further grown to include properties such as Variability, Viability and Volatility. It is important to mention that the most important V for business environment is Value (Marchand-Maillet et al., 2014). For our study we use the 6V’s definition that includes Value, Variability, Veracity, Volume, Velocity and Variety as can be seen in Figure 1: • Volume in Big Data refers to amounts of data in the terabyte level or higher. Data this size presents new challenges when it comes to tasks such as retrieving, indexing and processing. These issues cannot be handled by traditional RDBMS and thus new tools are required; • Velocity is the speed at which new data is generated and processed. High speed brings constraints to operations with data. The main concern for data scientists about velocity is the high cost of retrieving data that can be left behind if a stream is not processed fast enough; • Variety refers to the mix of available data types that can present various levels of structure. Most data today is semi-structured and unstructured and not supported by RDBMS. Variety can also refer to the different sources data is generated from – both inside and outside the organization; • Value is the knowledge extracted from a large amount of data. It can be perceived as the understanding of the behavior of a user under a certain context; • Variability refers to data whose meaning is uncertain. Data isn’t always accurate and sometimes presents out of the ordinary values that require additional study to decide if they should be considered or discarded; • Veracity addresses the confidentiality, integrity, and availability of the data. This includes questions such as if the data is trustable; The aforementioned characteristics are important because they should be ever present in the process of developing technologies and platforms whether they act upon one or more steps of the Big Data value chain. There are different versions of the Big Data value chain described in the literature.
Figure 1: The 6V’s of Big Data
One is proposed by Miller et al., (2013) but for this paper we will use the one proposed by Hu et al., (2014). The value chain divides the lifetime of data into four different phases - Data Generation, Data Acquisition, Data Storage and Data Analysis. Data Generation represents several aspects related to how data is generated such as its sources and its domain-specific values. Data Acquisition represents the process of obtaining the information that is subdivided into three smaller processes that are data collection, data transmission and data pre-processing. Data Storage concerns the persistent storage and managing of large-scale datasets. Finally, Data Analysis aggregates the analytical methods to inspect, transform and model data for knowledge extraction (Hu et al., 2014). Any individual or group user wanting to put a Big Data Platform should have in mind that before the platform itself is chosen and deployed it is advisable to study and implement a Big Data Strategy, that helps managers understand exactly what they want from the eventual platform they are going to use. According to Huddar et al., (2013) a Big Data Strategy consists mainly of three different areas: 1) Big Data Basics that usually represent the acknowledgment of the diverse types of data available such as social data, preprocessed data or unstructured data. 2) Big Data Assessment evaluates several data aspects such as the source, the potential uses, volumes, estimated future growth and privacy regulations. 3) Big Data Strategy in itself that studies the impacts of Big Data in the organization,
International Journal of Big Data (ISSN 2326-442X) opportunities to be taken and business cases where Big Data can be of use. It also reports economic impacts such as the potential return of investment. Only after that strategy is documented and thoroughly analyzed are organizations and managers able to effective chose what functionalities they will have to look for in a Big Data Platform.
3. OPEN SOURCE BIG DATA PLATFORMS OVERVIEW AND THE MAPREDUCE PARADIGM A platform capable of supporting the large kind of datasets that are not manageable by traditional database tools can be considered a Big Data Platform (Gupta et al., 2014a). A generic goal of such platforms can be formulated as to grant the abilities to integrate privately acquired and publicly available Big Data with data generated within an enterprise and to analyze the combined set for value extraction (Dijcks, 2014). This can be translated into a group of features that platforms should include such as - easy scalability and extensibility, being comprehensive and ready for enterprise use, robustness and faulttolerance support, data updates with low latency and last low maintenance requirements. Nevertheless Big Data Platforms are not just features, but also hardware and software technologies. And they do not exactly need to be composed of the newest and most powerful technologies. A Big Data Platform could be deployed by just making a new configuration of the existing technologic infrastructures. Unfortunately this solution is not viable and therefore not widely used because modifying decades of old systems for the needs of the present comes with a very high price that few are able to pay for. However, this is an unnecessary cost because newer platforms are constantly being developed to answer these new requirements. Those requirements can be divided into three main phases – Data Acquisition, Data Integration and Data Analysis (Dijcks, 2014). In the Data Acquisition phase systems are being asked to provide lower latency on data capture, shorter execution on data queries, support for distributed environments and for most types of data structures. NoSQL databases are currently the solution that is closer to such specifications because they prioritize data capture over data categorization thus eliminating the overhead caused by the existence of a data scheme (Abramova et al., 2013), (Lourenço et al., 2015). When it comes to Data Integration the preferred solution of organizing all the data at one
Vol. 2, No. 3, November 2015
4
single location is not possible anymore in the Big Data era. Moving around significant amounts of data while keeping its integrity is mandatory for big companies. To support Big Data frameworks and platforms, hardware must provide some requirements. The systems must have the capacity for either vertical or horizontal scaling or in the best case both. Vertical systems are systems that work with a single node composed of several components of powerful and expensive hardware. Horizontal systems on other hand are systems that are composed of multiple nodes of commodity hardware connected through some sort of network. Big Data frameworks should also provide capacity for distributed data programming, high throughput and support for both structured and unstructured data (Singh et al., 2014). Systems that scale vertically are systems that grow by adding more processors, more memory and other hardware within the same server. This has obvious advantages such as easier setup, management and inexistent communication cost but it also has major drawbacks. At all times a system needs to be scaled vertically, an investment has to be made in the purchase of new hardware and most times the investment represents an upgrade in processing power that is unnecessary. It is also important to say that scaling vertically becomes an impossibility after a certain limit because of physical limitations and because current operating systems are restricted to handling a certain amount of hardware. All of the aforementioned issues of vertical scaled systems do not make them the first choice for Big Data but just a resource for specific tasks such as processing of intermediate results generated by horizontal scaled system. Horizontal scaled systems are better because both data analysis and data integration require the use of distributed environments to realize the tasks of deep analytics and statistics on a broad variety of data types. These systems have to comply with facts such as data being stored in different systems and constantly scaling up in terms of volume. They need to be faster at delivering answers and reacting to changes in data behavior. They also have to embrace the fact that data moving from one place to the other raises not only privacy concerns but also prohibitive costs for organizations to support. Data mining and analysis tasks are carried out in multiple locations with intermediate results being sent to a central location. At this central location results are grouped back together for another process of final analysis. This two-step process brings even more complexity especially for the development of algorithms because the analysis of intermediate results will be not as precise as the analysis of raw data. Not only are intermediate results an average of the raw data results and also noise and arbitrariness can be introduced for
International Journal of Big Data (ISSN 2326-442X) privacy maintenance (Wu et al., 2014). To sum up, while vertical scaled systems are important and useful for some complementary tasks, the key for Big Data is in the frameworks that support horizontal scaling. Frameworks that scale horizontally are superior because they are better at providing the three main features we mentioned before – distributed data programming, high throughput of data and support for all types of data. All practical implementations of software frameworks for distributed storage and processing that are used for Big Data are based on a programming model. One of the most used and developed programming models is MapReduce (MR). MR is a programming model that was proposed by Jeffrey Dean and Sanjay Ghemawat at Google in 2004 (Dean et al., 2008). MR is a batch process oriented paradigm that provides algorithms for problems too big and complex to be run on a single machine and that can be processed in parallel in a cluster of nodes (Lee et al., 2011). The basic flow of a MR process is composed of two procedures – the Map procedure that processes a small chunk of the dataset and generates intermediate results and the Reduce procedure that groups the intermediate results and processes them to generate the final output. The strong point of MapReduce is that if the algorithm is developed in a way where the various operations are independent from each other then they will be able to be run in parallel allowing a considerable saving in processing time. Tasks are distributed to the nodes in the network with nodes being forced to report periodically with either work or status report. The master node keeps track of which tasks where given to which nodes and if one node fails, it is considered inactive and the tasks given to it are sent for other nodes to perform and the whole network is automatically configured accordingly. Nevertheless it has also some weak points. Distributing the work through a large number of machines has a communication and data transfer cost that sometimes may not be compensated by the gain in computational speed or throughput. Also MR tasks are acyclic data flows where all mappers are performed before all reducers accordingly to a schedule made by a batch job scheduler. This imposes serious limitations to areas such as Machine Learning (ML). Almost all algorithms in ML are iterative and revisit the same data a few times. Reasons such as, the high relying on slow I/O operations, lack of use of in-memory and the change of paradigm from batch processing to streaming processing are among the reasons why MR is being phased out in favor of new models and implementations such as Spark (www. spark.apache.org/), Storm (www.storm.apache.org/), or Kafka (www.kafka.apache.org/). MapReduce and
Vol. 2, No. 3, November 2015
5
its open source implementation Hadoop are at the moment the data programming model with most implementations in place for the treatment of large sets of data (Dörre et al., 2015). Big Data Platforms still have a long path to walk through as not only do they need to come up with new solutions for the issues we explained before but also for new challenges that arise as Big Data raises in volume and importance.
4. OPEN SOURCE DISTRIBUTED PROCESSING FRAMEWORKS In this section we describe five open source distributed processing frameworks – Hadoop, Spark, Storm, Flink and H2O.
4.1 Hadoop
Apache Hadoop (www.hadoop.apache.org/) is a software framework created in 2005 by Doug Cutting and Mike Cafarella as an open source implementation of MapReduce. Written mainly in Java (with some C and Shell script code) it aims at being a framework for both distributed storage and processing of large data sets in computer clusters composed of commodity hardware but also on cloud platforms. The core of the framework is composed of the Hadoop Distributed File System (HDFS) for storage management (but other file systems are supported) and the MapReduce implementation to manage the processing. The remaining of the base framework includes two other components. The first one is Hadoop Yarn (www.hadoop.apache.org/docs/current/hadoopyarn/hadoop-yarn-site/), a platform responsible for the management of the available resources in the system. The other one is Hadoop Common, a set of libraries and utilities that provide abstraction of the file systems and operating systems among other necessary features to aid the others modules in their tasks. Additional packages that can be integrated in the Hadoop ecosystem include Pig (www.pig.apache.org/), Hive (www. hive.apache.org/), Spark and HBase (www.hbase.apache.org/) that is an open source implementation of the BigTable distributed storage system proposed by Chang et al., (2008). An example of the Hadoop Ecosystem is shown in Figure 2. In terms of cluster or grid, a Hadoop system will include one master node and several slave (worker) nodes (Olson, 2014). The master node configuration is variable and can vary
International Journal of Big Data (ISSN 2326-442X)
Figure 2: The Hadoop Ecosystem (Gupta, 2015b). from two to four different components explained next and illustrated in Figure 3. The first component is the Job Tracker. It is responsible for accepting the MR tasks, distribute them to the Task Trackers in the slave nodes and keep track of what is being done and where. Next are the Task Trackers that are responsible for processing the data received and also to report periodically to the Job Tracker. Ideally they would only exist in slave nodes but in small clusters where all resources need to be used they will also exist in the master node. After that comes the Name Node, which represents the indexing of the data stored in the cluster. That data consists of the Data Nodes that are stored, replicated and moved around the various nodes of the cluster during the execution of the processing. Ideally (usually in large clusters) the Job Tracker will be placed alone on one node that will become the node responsible for all the job scheduling. Also on its own machines should be the Name Node and a secondary Name Node. The secondary Name Node makes regular copies of the main Name Node directory structure so that when the
Figure 3: Architecture of a Hadoop system (Bappalige, 2015).
Vol. 2, No. 3, November 2015
6
main Name Node fails and is restarted it can skip the file system journaling task and get active in a faster way. The basic flow of an algorithm run on Hadoop starts with the split of data stored in HDFS into large blocks and their distribution among the nodes in the cluster. MapReduce will then transfer to the nodes the necessary code for the data belonging to that node to be processed. This will take advantage of data locality and reduce communication costs. This work distribution can only be achieved if the file system provides location awareness. If one algorithm is well designed then the various processing tasks will be independent from each other and able to be run in parallel (Ullman, 2012). But Hadoop will still inherit the limitations associated to MapReduce when it comes to iterative algorithms. To fix this, Bu et al., (2010) has presented a modified version of Hadoop called HaLoop that is designed to serve iterative algorithms and applications. Also the file system will guarantee that several copies of the data are placed in different nodes of the cluster in order to guarantee redundancy in case one of the nodes has a failure. All the fundamental modules of Hadoop designed based on the assumption that commodity hardware is likely to suffer from hardware failures and that such failures should be treated by the software.
4.2 Spark
Apache Spark (Spark, 2015) is an open source new generation platform for computation in memory originally developed at the University of Berkeley and now in development as one of Apache’s Top Level Projects (Apache Software Foundation, 2014). Unlike the previous generation platforms such as Hadoop, Spark is not oriented for batch processing but rather streaming processing. By giving the user access to in-memory, Spark through its direct acyclic graph (DAG) engine allows the loading of data to such memory and the possibility for processing various queries in it. This makes Spark roughly 100 times faster than its competitors in some types of applications and makes it very good for the implementation of machine learning and data analytics algorithms. Spark is the name of both the framework but also the processing module of the framework. This means the framework still needs a cluster manager module and a distributed storage module. For cluster management it supports not only its own standalone native cluster but also Hadoop Yarn and Apache Mesos (www. mesos.apache.org/). When it comes to distributed storage Spark includes support for HDFS, Cassandra, OpenStack Swift and online storage services such as Amazon S3. The
International Journal of Big Data (ISSN 2326-442X) Spark project consists of five major components. The first one is the Spark Core. Spark Core provides methods for task dispatching and scheduling in distributed systems along with basic input and output functionalities. Next is Spark SQL a component on top of the core that provides data abstraction called DataFrame and support for both structured and semistructured types of data. Then comes Spark Streaming. Spark Streaming improves on the natural capacity of the Core to schedule jobs in a fast manner making it suitable for streaming analytics. In a more simple way it basically serves as a translator of code of batch processing applications for the streaming paradigm. Remaining modules include GraphX (Gonzalez et al., 2014), a framework for distributed processing of data in the form of graphs and MLLib (www.spark.apache.org/mllib/), a framework for distributed machine learning that we will explore in detail in section 6.7. An illustration of the Spark ecosystem can be seen in Figure 4. Spark is known to operate at clusters as large as eight thousand nodes and as of November 2014 holds the world record on large-scale sorting for sorting 100TB of data in 23 minutes in the Daytona GraySort Contest (Xin, 2014).
4.3 Storm
Apache Storm (www.storm.apache.org/) is another of the new generation frameworks for distributed streaming processing. Originally created by Nathan Marz at BackType it was then acquired by Twitter who immediately transformed it in an open source project (Cheredar, 2011). It is a cross-platform framework written in both Java and Clojure programming languages. It has a wide range of use cases that go from real time data analytics to online machine learning but also include distributed remote procedure calls and data extraction, transforming and load (ETL). Storm applications are designed with a custom topology that makes the distributed processing of streaming data look like it is in fact batch processing thus making the change of paradigm easier for developers and managers to understand and eventually implement. Storm aims at having the same
Figure 4: Spark Ecosystem (Spark, 2015).
Vol. 2, No. 3, November 2015
7
success with stream processing that Hadoop had with batch processing. We can see the topology of a Storm application in Figure 5. The topology has the shape of a direct acyclic graph where the vertices are the data sources (known in Storm as spouts) and the data manipulation nodes (known in Storm as bolts). The edges of the graph are the pieces of data (known in Storm as tuples). Both spouts and bolts can accept a multiple number of input sources and generate many output sources. The output of a bolt doesn’t necessarily have to be placed in a spout but can be the input of another bolt that will process the data in a different way than the previous one. Processed data can be stored in spouts after every step, at the end of the whole processing or never stored at all with the final output being just visualized along the way. The structure of a Storm job is very similar to the one of a MapReduce job differing in only two essential points. First, data is processed in a real-time continuous manner instead of as individual batches (even though in a very simple way we can interpret a tuple as a batch of data). Secondly, MR jobs have a starting point and an ending point - Storm jobs run indefinitely until killed. Storm most distinguishable feature is the easy way it can be integrated with the queueing database technologies already in use.
4.4 Flink
Apache Flink (www. flink.apache.org/) is a new generation framework for distributed data processing. This framework created in 2010 by three German universities under the research project “Stratosphere: Information Management on the Cloud” (Alexandrov et al., 2014) is designed specifically for Big Data Analytics. While Spark eludes the user into thinking it is a stream processing oriented platform when in fact it is just a platform that processes small pieces of data in batch in a fast way, Flink is a framework genuinely built for streaming processing (Pointer, 2015). In most cases this does not make a difference. Although in
Figure 5: Storm Topology (Bertran, 2015). environments such as the financial system or real
International Journal of Big Data (ISSN 2326-442X) time auction every millisecond delay makes a difference. This causes Flink a better alternative to Spark. While Spark uses the resources of Storm to solve the low latency issues, Flink provides solutions for all scenarios in a single framework. Flink wants to be a system that fills the gap that exists between the MapReduce two step systems and the sharednothing parallel database systems. It executes random dataflow processes in both data parallel and pipeline manner. This way it enables the execution of both batch and streaming applications along with the execution of iterative machine learning algorithms natively. Written in Java and Scala languages, the applications for it are automatically optimized into dataflow programs. This makes it possible for them to perform well in both batch and stream processing scenarios. Flink is just a processing module that unlike others does not have a storage component. For that it uses HDFS or HBase for batch processing and Kafka for data stream processing. Flink includes API’s for applications that use static data sources, applications that use unbounded data streams and for applications that use data in form of database tables. Additional pieces of the bundle are libraries for Machine Learning and for graph processing. An illustration of the Flink stack can be seen in Figure 6. Main characteristics include exploiting of the capacities of in-memory use and of data streaming, ability to make safe well written applications, easy to use and quickness of deployment because of the low number of required settings, good scalability proved in clusters of hundreds of machines and compatibility with more developed systems like Hadoop (Apache Flink).
4.5 H2O
H2O (www.h2o.ai/) is a new generation open source framework for parallel processing that like Flink was created specifically for the Big Data Analytics area
Figure 6: Flink Stack (Tzoumas, 2015).
Vol. 2, No. 3, November 2015
8
(Kurzyniec et all., 2003). Along with the engine itself it contains its own Machine Learning Platform and other components such as tools for data preprocessing and for evaluation of data after processing. The H2O architecture structure is shown in Figure 7. H2O has different processing methods depending on the needs of the algorithm at hand. All of these processes share the common characteristic of running completely in-memory. Besides its own native engine, H2O integrates with Spark and efforts are in place to allow integration with Storm too. The basic approach of H2O consists in breaking processing tasks into parts as small as possible. This allows the exploiting of the capabilities of parallel processing in the best way possible on jobs that are batch type like MR, streaming or even processing of graph data. One of the most appealing features of H2O is that not only it has its own web-based Graphical User Interface but also integrates well with the known environments for programming, thus allowing for analysts with no programming background and for programmers that are new to H2O to start developing and deploying applications in a fast and easy way.
5. PROCESSING FRAMEWORKS COMPARISON In this section we compare the five processing frameworks – Hadoop, Spark, Storm, Flink, H2O using a group of eight characteristics that have been considered relevant by previous work – Fan et al., (2013), Singh et al., (2014) and Hu et al., (2014) - for business managers to look for when trying to choose a distributed processing framework. This structure will be the base over which a Big Data Platform will
Figure 7: H2O Architecture (Hillebrand, 2015).
International Journal of Big Data (ISSN 2326-442X) be deployed. The eight characteristics are divided in two groups. First, in Table 1 we list the processing model(s), the software requirements, the programming language(s) and the existence or not of native Machine Learning Tools. Secondly, in Table 2 we make an analysis on characteristics such as development maturity, modularity and finally integration. We also address the hardware requirements for each framework. The processing model is important because the distinction between batch and streaming is directly entangled with the needs of the enterprise. Batch processing is so far the best way to handle large quantities of that but streaming is the best way to obtain speed. A platform that can provide both is obviously the best of both worlds. Hardware and software requirements must always be taken in consideration. An open source framework does not give any benefit if it requires the acquisition of payed hardware and software. Programming languages are always an important characteristic because the enterprise will need human resources to manage the system and it is always more recommended to choose platforms with languages that are widely known and have a good availability of programmers for hire rather than a platform that uses more infrequent languages that have shortage of people who know how to code them. Knowing if a framework has its own associated Machine Learning Tool and/or if it integrates well with other tools is also important because having to add a tool on top of the framework can be a process that can add management complexity and push managers away from a platform that needs that. Again with the Machine Learning tools characteristic is hard to give a best choice. All frameworks have
Vol. 2, No. 3, November 2015
9
their own one or integrate well with others. The weakest one here is likely Storm because it integrates with SAMOA that is not a tool developed and distributed with Storm like the other ML tools are distributed with their own frameworks. Analyzing Table 1 we can now extract the following conclusions – When it comes to the processing model, Spark and Flink are obviously the best choices because they provide processing in both the batch and streaming model. Unless the manager knows well that s/he only needs one of these models not just now but also in the future, a framework that gives both options is at first sight a better choice. On software requirements all frameworks require Java Development Kit (JDK). Hadoop and Flink also require Secure Shell (SSH). Flink does not run natively on Windows and so Windows users will need Cygwin to be able to use it on that operating system. When it comes to the programming languages it is hard to name a better choice above the others. All of them support Java which is one of the most used languages nowadays and have no shortage of available programmers. Still, Storm, Spark and H2O can be highlighted for providing more freedom of developing as they support a higher number of languages than the others. None of the frameworks have strict hardware requirements. Such requirements are variable depending on both the algorithm to be run and size of data to be processed. All frameworks function accordingly to the parallel processing paradigm and are designed to run on clusters where each node may have different hardware specifications. The only framework that sets minimum hardware requirements is Spark that asks for 8GB of RAM, between 8 and 16 CPU cores per node and a network connection of 10 Gigabit or higher.
Hadoop
Spark
Storm
Flink
H2O
Processing Model(s)
Batch
Batch, Streaming
Streaming
Batch, Streaming
Batch
Software Requirements
JDK 1.7, SSH
JDK 1.6
None
Cygwin (for Windows), JDK 1.7.x, SSH
JDK 1.7
Programming Language(s)
Java
Java, Python, R, Scala
Any
Java, Scala
Java, Python, R, Scala
Machine Learning Tool(s)
Mahout
MLLib, Mahout, H2O
SAMOA
Flink-ML, SAMOA
H2O, Mahout, MLLib
Table 1: Processing Frameworks Comparison
Vol. 2, No. 3, November 2015 10
International Journal of Big Data (ISSN 2326-442X)
Hadoop
Spark
Storm
Flink
H2O
Development Maturity
⋆⋆⋆⋆
⋆⋆⋆
⋆⋆⋆
⋆⋆⋆
⋆⋆⋆⋆
Modularity
⋆⋆⋆⋆⋆
⋆⋆⋆⋆⋆
⋆⋆
⋆⋆⋆⋆
⋆⋆⋆⋆
Integration
⋆⋆⋆
⋆⋆⋆⋆
⋆⋆⋆⋆
⋆⋆⋆
⋆⋆⋆
Table 2: Processing Frameworks Comparison The next three characteristics – Development Maturity, Modularity and Integration – are analyzed in the form of a one to five stars rating with one star being the lowest evaluation possible and five starts being the best. Development Maturity is the level of growth and deployment the framework has obtained. In this area just like in many others is hard to consider that a tool is completely developed and thus we do not give five starts to any of the analyzed frameworks. Modularity is an important feature because it represents how well the framework has its various features divided in different modules. The more modular a framework is, the easier it is to adapt it to specific needs and to exchange some modules for others that may perform better at specific tasks. Integration is a characteristic that is quite interconnected with modularity because then again the more modular it is the easier it is to integrate with other frameworks in its totality or just with some modules without much technical complexity. Examining Table 2 we can conclude that when it comes to development maturity Hadoop and H2O are by far the best platforms as they are the ones that exist for the longest time, are more deployed and have the biggest number of released versions. This is not necessarily a good thing because they work only with batch processing. The reality is that batch processing is being phased out in favor of streaming processing. A manager looking at this characteristic has to consider the choice between a robust system for the needs of the present and a younger system that can adapt well to needs of the future. When it comes to modularity, Hadoop and Spark are the ones that have their functions more divided. But they do not have much difference to either Flink or H2O. Storm gets a lower rating here because of all the frameworks analyzed it is the one that is closer to be just a processing framework. Because it has a more specific function it is not as modular as others. But this is not necessarily a disadvantage. With integration Spark and Storm take the advantage. They integrate better on top of other frameworks, aside them and with just some modules interchanging. As global conclusions we can say that – Spark and Flink are the best choices. They give the power of both batch and streaming processing, they offer
different possibilities within the programming languages and got their own ML tools. They are mature enough to provide stability of use, have a good modularity and integrate well enough with other tools. Hadoop and H2O are also good choices if the manager wants a framework that is mature enough, thoroughly debugged and able to provide the best results for the present while s/he waits for newer frameworks to improve.
6. BIG DATA OPEN SOURCE PLATFORMS Based on the work of (Bifet, 2013) we chose the following Big Data Open Source Platforms: Apache Mahout, MOA, R Project, Vowpal Wabbit, PEGASUS and GraphLab Create. Additionally we chose MLLib because we find useful compare a newer platform with older ones. In this section we describe these tools in some detail.
6.1 APACHE MAHOUT Apache Mahout (www. mahout.apache.org) is an open source project aiming to build a comprehensive library of machine learning and data mining algorithms. The main feature of Mahout is that all the algorithms in its library are highly scalable and able to perform well on both standalone machines and distributed environments. It runs on top of the Hadoop environment and make use of such technologies such as HDFS and MapReduce. Mahout currently has implementations and support for most of the machine learning tasks of supervised and unsupervised nature such as Recommendation Mining, Clustering and Classification. Recommendation Mining is the algorithm that mines and analyzes user behavior and builds recommendations on similar items the user might like. Clustering is characterized as the set of algorithms aimed at analyzing text documents and group them into topic related groups of texts. Classification comprises the set of algorithms that use previously obtained information from already categorized
Vol. 2, No. 3, November 2015 11
International Journal of Big Data (ISSN 2326-442X) documents to assign new ones into the most suitable category. Other tasks available are Collaborative Filtering, Dimension Reduction, Topic Models and Frequent Pattern Mining. It is important to refer that Mahout is only a library. Mahout presents a few drawbacks that need to be considered when considering the choice of a platform: • High processing overhead caused by the multiple I/O disk operations required by iterative learning algorithms (Fernández et al., 2014); • Lack of own server and user interface that requires the use of an external programming IDE with Java support; • Lack of documentation (Maharjan et al., 2014); • System requirements are highly dependent on what algorithm needs to be executed; It has gained a lot of popularity among Data Mining developers because of the freedom of implementation.
framework for the user to insert new types of streams, algorithms and methods. It also permits the storage of previously run benchmark results thus providing the creation of scenarios to be used against the newer algorithms (Bifet et al., 2010). The current version of MOA provides collections able to perform such tasks as Classification, Regression, Clustering, Outlier
6.2 MASSIVE ONLINE ANALYSIS (MOA)
Massive Online Analysis (MOA, 2015) is an open source software oriented toward mining of data streams that present conceptual drift. It allows both building and experimentation on machine learning and data mining algorithms to provide fast answers to the evolution of the nature of the data streams. It is a very user-friendly platform – having its own Graphical User Interface (GUI) as seen in Figure 8 – command line and also making use of the Java API, which makes it suitable for users with distinct levels of experience. One of most recognized abilities is its modularity. Besides the core program one user can choose to expand only to modules of interest thus saving time and effort in exploring features not relevant to her/his work. The main goal of MOA is to provide a framework for benchmarking of existing machine learning algorithms that operate on real-time big data streams. This allows the community to easily identify algorithms that are less efficient and abandon their development at an early stage. This allows for the development resources to be optimized as they are always placed in the solutions that have prospect of being most efficient and useful. Unlike the WEKA (WEKA, www.cs.waikato.ac.nz/ml/weka/) platform from where MOA has derived it does not work with batch-processing. To perform such tasks it provides a set of essential tools such as real and synthetic examples of data streams for testing, a library of existing algorithms and measures of comparison between them. It does not only allow working with content given in the platform but it provides
Figure 8: MOA Graphical User Interface (MOA, 2015). Detection, Recommender Systems, Frequent Pattern Mining and Change Detection. The drawbacks of MOA are as follow: • Memory allocation limit of 400Mb is too small to handle Big Data; • No support for parallel processing.
6.3 R PROJECT R Project (www.r-project.org) is the combination of a programming language and an environment for statistical and graphics computing. It has been designed with influence taken from the programming languages S and Scheme but unlike these two it is completely open-source (Hornik, 2015). So far R Project provides a variety of graphical and statistical techniques that include linear and non-linear modelling, classic statistic tests, time-series analysis or more traditional features like classification and clustering. It intends to be a fully planned ahead system built with coherency rather than a basic suite where different tools are simply added for extension of functionalities (Morandat et al., 2012). Because R is in itself a programming language it allows users who feel comfortable with coding to add new functionalities to the suite. It is an integrated suite of software that allows performing a full circle of data treatment including manipulation, calculation and finally display. Besides including effective
Vol. 2, No. 3, November 2015 12
International Journal of Big Data (ISSN 2326-442X) methods for data storing and handling it includes a group of operators to provide calculation with arrays and matrices. Other features include an integrated collection of tools for intermediate data analysis and graphical facilities to facilitate visualization. R Project has so much popularity among the community working with statistical data analysis that it has led to the creation of several tools to make it more user-friendly and appealing. One of them is RStudio (www.rstudio.com/products/rstudio). RStudio Desktop is an IDE specifically aimed at working with R and developed by the company of the same name. An example of the RStudio interface is shown in Figure 9. The R Project presents two major drawbacks that condition mostly the required skills for programmers that will use the platform: • There is a learning curve associated with the R language. R is not a common programming language that is not part of the education process of most programmers; • Requires knowledge about different programming languages such as C, C++ and Fortran to use the full potential of the platform.
6.4 VOWPAL WABBIT Vowpal Wabbit (www.github.com/JohnLangford/vowpal_wabbit/wik i) is a project sponsored by Microsoft Research with the goal of developing a single machine learning algorithm that is inherently fast, able of being run in both standalone machines and in parallel processing environments and capable of handling datasets in the scale of terabytes. The creators and developers of Wabbit have decided from the very beginning focus on building a single strong multi-purpose algorithm rather than a library with many algorithms. The development of the algorithm is encouraged to take advantage of four main features that when used in combination can achieve better results – input
Figure 9: Interface of R Studio (RStudio, 2015).
formats of data, speed of learning, scalability of the data sets and feature pairing (feeding of data to subtasks in pairs rather than one by one). Wabbit presents a group of features that are so far unique to its system. It is optimized by default to support online learning rather than batch learning through a series of modifications made to the stochastic gradient descent methods that allow a more robust analysis on data sets of considerable size. It presents Feature Hashing, a method that reduces the necessary pre-processing of data making the analysis process not only faster but more accurate. The combination of the aforementioned two features allows Wabbit to make effective learning from any size of information made available to the algorithm no matter how small or big it is. The implementation of a reduction stack within its core also allows it to provide a solution for large scale advanced problems. Wabbit has a few drawbacks that come from the aspects we analyzed before: • The existence of a single algorithm makes Wabbit have a good performance for few tasks but a poor performance for most of them; • Low optimization on basic aspects such as the speed of input/output operations. Wabbit runs mainly as a library or a standalone daemon service but it is fully ready to be deployed in Cloud environments.
6.5 PEGASUS PEGASUS (www.cs.cmu.edu/~pegasus) is an open source platform developed by the data mining group at the Carnegie Mellon University and designed specifically for data mining in graph structures of sizes ranging from a few gigabytes to petabytes. Because datasets of such size are no longer able of being processed in single node machines, PEGASUS works with resort to parallel programming by being implemented on top of Hadoop. It is a more specific data mining platform than others because it works with data that comes in form or graphs and networks with billions of nodes and connections. This is a considerable leap against previous systems that can only work in the size of the millions. Graph structures are suffering a rise in number and importance coming from such various fields as mobile networks, social networks or medical fields such as protein regulation (Kang et al., 2009). PEGASUS unifies a vast number of graph mining
Vol. 2, No. 3, November 2015 13
International Journal of Big Data (ISSN 2326-442X) tasks such as the computing of the graph diameter, computing the radius of each node or finding connections between the graph nodes by making a generalization of matrix-vector multiplication called GIM-V (Kang et al., 2009). GIM-V is carefully implemented and optimized with built-in graph mining operations such as Page Rank, Random Walk with Restart and diameter estimation (Kang et al., 2009). It provides linear scaling as to the number of edges to analyze making it suitable to work on any number of machines available. PEGASUS is one of the platforms that present the most drawbacks, such as: • It is not fully developed yet. The library of machine learning algorithms is very incomplete. • Operations such as the indexing of graphs are still poorly optimized; • Works only with data that comes in the form of graphs with no support at all for other types of data; • Very heavy software requirements.
6.6 GRAPHLAB CREATE GraphLab Create (www.dato.com/products/create) formerly known only has GraphLab it was rebranded into Dato Incorporation (Wolpe, 2015). It is a platform for development of machine learning applications working at various scales of dataset sizes. It aims at providing means for applications to have all the necessary iterative steps to make predictions based in data mining results. The main goal is to design and implement machine learning algorithms that are efficient, accurate and able to keep data consistency while taking the most advantage from parallel processing (Low et al., 2014). Some of the already developed algorithms are belief propagation, Gibbs sampling or Co-EM. All of these algorithms have been optimized from their previous versions to now perform better with parallel processing. The platform works mainly with three areas of data processing – Data Engineering, Data Intelligence and Data Deployment. One of its strengths is the ease of use for both beginner and experts in the area of data mining. Its main components are scalable data structures, machine learning modules, methods for data visualization and capacity to easily integrate with many data sources of different types. In the field of data engineering it provides an easy way to run the ETL (Extract, Transform and Load) process on data as a means to clean data and save time during the
analysis process. For this it provides tools to perform basic tasks such as data sort, slice and dice in a fast way on datasets with terabytes of size. It also provides intuitive visualization of the generated tables and graphs through the auxiliary tool GraphLab Canvas whose example of interface can be seen in Figure 10. For data intelligence there are tools to build recommenders with Python code, make data analysis in images through deep learning techniques that take advantage of powerful computing GPU capabilities. There are also tools for analysis of unstructured text, graph analysis and supervised learning for outcome prediction. For data deployment it provides tools to deploy easily coded services for prediction of various types. The drawbacks of GraphLab Create are: • Small algorithm library that is restricted to the most common tasks; • Very complete platform that covers the whole cycle of data treatment and takes time to master before use.
6.7 MLLIB MLLib (www.spark.apache.org/mllib/) is a machine learning library that runs on top of the Apache Spark framework and is thus released in the Spark bundle whose current stable release is 1.4.1. dated of July 2015. Taking advantage of Spark’s distributed inmemory based architecture it claims to be nine to ten times faster than Mahout running on the disk-based framework Hadoop and to have better scalability than Vowpal Wabbit (Talwalkar et al., 2015). MLLib implements most of the common algorithms for machine learning and statistical analysis. For machine learning it includes algorithms for classification and regression, collaborative filtering, clustering, dimensionality reduction, feature extraction and transformation and optimization primitives.
Figure 10: GraphLab Canvas Interface (Gu, 2015).
Vol. 2, No. 3, November 2015 14
International Journal of Big Data (ISSN 2326-442X) In statistical analysis it has methods for summary of statistics, correlations, stratified sampling, hypothesis testing and random data generation. With support for applications written in languages such as Java, Scala and Python, MLLib not only fits well in the Spark API but also integrates well with NumPy, the Python package for scientific computing. When it comes to data sources, MLLib is fed by the data sources supported by Spark such as HDFS, Cassandra or cloud services like Amazon S3. MLLib presents two major drawbacks: • It is a recent platform and therefore is not fully developed yet. Because of this it does not have the same robustness as all the previously mentioned platforms. • Being released along with the Spark framework makes it somewhat limited as it
7. OPEN SOURCE BIG DATA PLATFORMS COMPARISON To perform our comparison on the previously detailed platforms we chose nine parameters that literature such as – Liu et al., (2014), Fernández et al., (2014), Jović et al., (2014) and Hasim et al., (2015) considers relevant for business managers to analyze when choosing an open source Big Data Platform. These characteristics are – Programming Paradigm, Hardware Requirements, Operating Systems, Software Requirements, Programming Language(s), User Interface, Data Types, Available Algorithms and Scale of Supported Datasets. These parameters are a mix of technical characteristics but also other defining characteristics to follow when finding out if a platform is or not
Mahout
MOA
Wabbit
R Project
PEGASUS
GraphLab
MLLib
Programming Paradigm
Parallel Computing
Serial Computing
Parallel Computing
Serial Computing
Parallel Computing
Parallel Computing
Parallel Computing
Operating Systems
Windows, Linux, Mac OS X
Windows, Linux, Mac OS X
Windows, Linux, Mac OS X
Windows, Linux, Mac OS X
Windows, Linux, Mac OS X
Windows, Linux, Mac OS X
None
None
Windows, Linux, Mac OS X Hadoop, Apache Ant 1.7.0, JDK 1.6.x, Python 2.4.x, GnuPlot 4.2,x
64bit Operating System
Spark
Software Requirements
Hadoop/Spark, JDK 1.6.x, Maven 3.x
Programming Language(s)
Java
Java
C, C++
R, S, C, C++, Fortran
Java
C++, Python
Java, Scala, Python
User Interface
N/A
GUI, command line, Java API
N/A
N/A (but RStudio GUI exists)
N/A
GUI through GraphLab Canvas
N/A
Data Types
All
All
All
All
Graphs
Graphs
All
Available Algorithms
Recommendati on Mining, Classification, Clustering and others
Classification Regression Clustering and others
Own Single Algorithm
Undefined
Page Rank, Random Walk With Restart and others
Belief propagation, Gibbs sampling or Co-EM and others
Classification, Regression, Clustering and others
Scale of Supported Datasets
Up to Petabytes
Up to Terabytes
Up to Gigabytes
Up to Petabytes
Up to Petabytes
Up to Petabytes
JDK 1.6
Few Megabytes
Table 3: Open Source Big Data Platforms Comparison cannot be used with other frameworks.
suitable for environments.
Small
and
Medium
Enterprise
Vol. 2, No. 3, November 2015 15
International Journal of Big Data (ISSN 2326-442X) We start with the programming paradigm - this is directly related to the size of the company and size of the computer infrastructure where the system may eventually be installed. The same applies for another set of characteristics we are analyzing – the hardware requirements, the operating systems, the software requirements and the supported sizes of datasets. Next we analyze the required programming languages because we consider important for a manager to know what kind of programmers will be necessary to run the systems. To this end we also provide comparison on the user interface each platform provides as we consider the level of experience of the programmers and ease of use and adoption of the platform can be related to the kind of less or more user friendly interfaces available. We also compare the types of data supported as a means to categorize platforms as more generic or more specific. Last but not the least, we compare the variety of algorithms available as a way to say which platforms are more complete than the others. In Table 3 we show the detailed listing of these characteristics for each platform. Analyzing all the characteristics present in Table 3 we can draw the following conclusions – both MOA and R Project are the best tools for Serial Computing running in a single node machine. The others are best for companies with larger infrastructures that that allow parallel computing. All platforms are Cross Platform. This means they will run on all the three main Operating Systems – Windows (XP or higher), Linux and Mac OS X. On software requirements things are more diverse. Wabbit and R Project do not have additional software required. The ones with lower requirements are MOA that only needs the Java Development Kit (JDK), GraphLab that only requires a 64bit Operating System and lastly MLLib that only requires Spark (even though it can run over Hadoop). Heavier on software requirements are Mahout and Pegasus. Both require Hadoop (or Spark) and JDK. Mahout will also need Maven while Pegasus requires Apache Ant, Python and GnuPlot. All of this software is open source and thus free of any additional costs to the users. Most of the platforms, except for R Project, make use of common languages that have no lack of programmers available. MOA, R Project and GraphLab can be considered the most user friendly as they provide Graphical User Interfaces where the remaining ones do not, which makes working on them considerably harder and with a bigger learning curve, at least for less experienced users. PEGASUS and GraphLab are graph oriented where others platforms are made to work with all generic types of datasets. It is important to note that MLLib does not
directly process graph data. This is done by a complementary module of the Spark bundle called GraphX. Working with graphs only is not a limitation in itself as this type of data structure is very common these days. It is up to the companies to make this evaluation accordingly to their own needs. Lastly, when comparing available algorithms it is complicated to make clear conclusions about the platforms. Mahout and R Project are the ones with more participation from the community and therefore the ones with more diverse algorithms provided. GraphLab, PEGASUS, MOA and MLLib also have a significant number of algorithms ready to be used. Here is where Wabbit is the weakest because as we already explained it only works with a single algorithm that can be powerful under specific conditions but useless for most cases. Mahout, PEGASUS, GraphLab and MLLib are the ones who support bigger data sets while MOA is the weaker one on this field supporting only datasets with a size of a few megabytes. In summary, MOA is definitely the best platform for small companies with minimal computer infrastructures and that work with lesser amounts of data. For larger companies with bigger infrastructures that require parallel computing it is hard to decide between Mahout, MLLib and GraphLab. While the two first have the advantage of being broader in terms of data types supported, the second provides more ease of use due to the existence of a GUI that helps track the work being done. None of the platforms but GraphLab have defined hardware requirements. GraphLab requires a minimum of 4 GB RAM and 2 GB free disk space. Some of the platforms will require the same hardware required by the framework they are installed with (for example, MLLib will have the same requirements as the Spark framework). For the others the requirements will be dependable on the needs of the task they want to run.
8. CONCLUSIONS AND FUTURE WORK With the rise of Big Data and with more individuals and organizations gaining awareness of the potential and opportunities it brings, the number of Big Data frameworks and Platforms of both open source and proprietary nature are supposed to increase exponentially over the next years. Implementing a framework and/or a platform that solves all the questions inherent to Big Data is too heavy, expensive if not impossible at all. So the path being more commonly followed is for each organization to invest in developing its own set of technologies that are close to its specific needs, inwards or by calling to the community. This creates
International Journal of Big Data (ISSN 2326-442X) a high number of available solutions which not only brings difficult choices for people wanting to select a platform for their enterprise but also create a high level of redundancy and overlapping in the solutions presented. Educating not only business managers but also people in general to the potential of Big Data is crucial to guarantee the future of research and platform deployment. In this paper we study five distributed processing frameworks and conclude that Spark and Flink are the best ones because they provide the benefits of both batch and streaming processing models. They are followed closely by Hadoop and H2O that although limited to batch processing, are more matured, better tested and more widely deployed those providing more robustness. Also we study and analyze six Big Data Open Source Platforms and conclude that the best platform for small companies with minimal computer infrastructures is MOA, while Mahout, MLLib and GraphLab are the best for companies with larger computer infrastructures that require the use of parallel computing. Mahout and MLLib have more types of data supported but GraphLab is more user friendly because it has a GUI and Mahout does not. We can also give advice as to what the best combinations of framework/platform are to build your own data centric system. We advise for the use of the native Machine Learning tools of each platform as shown on Table 1. These are the combinations that are easier to deploy and will also be the ones that will perform better because the platform is developed to best take advantage of its framework partner features. As future work we pretend to analyze the frameworks and the tools in real environments and explore other available Big Data tools.
9. REFERENCES Abramova, V., & Bernardino, J. (2013). NoSQL databases: MongoDB vs Cassandra. Sixth International C* Conference on Computer Science & Software Engineering C3S2E, 14-22. Almeida, P., Bernardino J. (2015). Big Data Open Source Platforms. IEEE International Congress on Big Data (BigData Congress), 268-275. Alexandrov, A., Bergmann, R., Ewen, S., Freytag, J., Hueske, F., Heise A., Kao, O., Leich, M., Leser, U., Markl, V., Naumann, F., Peters, M., Rheinlander, A., Sax, M. J., Schelter, S., Hoger, M., Tzoumas, K., &
Vol. 2, No. 3, November 2015 16 Warneke, D. (2014). The Stratosphere platform for big data analytics. The VLDB Journal, 23,6, 939-964. Apache Software Foundation (2014). The Apache Software Foundation Announces Apache™ Spark™ as a Top-Level Project. Retrieved August 26, 2015 from https://blogs.apache.org/foundation/entry/the_apache _software_foundation_announces50. Assunção, M., Calheiros, R., Bianchi, S., Netto, M., & Buyya, R. (2015). Big Data computing and clouds: Trends and future directions. Journal of Parallel and Distributed Computing, 79-80, 3-15. Bappalige, S, P. An introduction to Apache Hadoop for big data. Retrieved December 29, 2015 from https://opensource.com/life/14/8/intro-apachehadoop-big-data Barata, M., Bernardino, J., & Furtado, P. (2014). YCSB and TPC-H: Big Data and Decision Support Benchmarks. BigData Congress 2014, 800-801. Barata, M., Bernardino, J., & Furtado, P. (2014). Survey on Big Data and Decision Support Benchmarks. Database and Expert Systems Applications - 25th International Conference, DEXA 2014, 174-182. Bertran, P, F. A practical Storm’s Trident API Overview. Retrieved December 29, 2015 from http://www.datasalt.com/2013/04/an-storms-tridentapi-overview/ Bifet, A. (2013). Mining Big Data in Real Time. Informatica, 37, 15-20. Bifet, A., Holmes G., Pfahringer B., Kranen, P., Kremer, H., Jansen, T., & Seidl, T. (2010). MOA: Massive Online Analysis, a Framework for Stream Classification and Clustering. Journal of Machine Learning Research (JMLR) Workshop and Conference Proceedings, 11. Bu, Y., Howe, B., Balazinska, M., & Ernst, M. (2010). HaLoop: efficient iterative data processing on large clusters. PVLDB, 3, 1, 285-296. Chang, F., Dean, J., Ghemawat, S., Hsieh, W. C., Wallach, D. A., Burrows, M., Chandra, T., Fikes, A.,
International Journal of Big Data (ISSN 2326-442X) & Gruber, R. E. (2008). Bigtable: A Distributed Storage System for Structured Data. Journal ACM Transactions on Computer Systems (TOCS), 26,2. Cheredar, T. (2011). Twitter acquires BackType for improved analytics. Retrieved August 26, 2015 from http://venturebeat.com/2011/07/05/twitter-buysbacktype/ Christofferson, F. (2014) Time Value of Data: Creating an active archive strategy to address both archive and backup in the midst of data explosion. Retrieved 14 September 2015 from https://www.sgi.com/pdfs/4229.pdf. Dean, J., & Ghemawat, S. (2008). MapReduce: simplified data processing on large clusters. Magazine Communications of the ACM - 50th anniversary issue: 1958 – 2008, 51, 1, 107-113. Dijcks, J. (2014). Big Data for the Enterprise. An Oracle White Paper. Retrieved August 8, 2015 from http://www.oracle.com/us/products/database/bigdata-for-enterprise-519135.pdf. Dörre, J., Apel, S., & Lengauger, C. (2015). Modeling and Optimizing MapReduce Programs. Journal Concurrency and Computation: Practice & Experience, 27(7), 1734-1766. Fan, W., Bifet, A. (2013). Mining big data: current status, and forecast to the future. ACM SIGKDD Explorations Newsletter, 14, 2, 1-5. Fayyad, U. (2012) Big Data Analytics: Applications and Opportunities in On-line Predictive Modeling. Retrieved 14 September 2015 from http://pt.slideshare.net/BigDataMining/big-dataanalytics-applications-and-opportunities-in-onlinepredictive-modeling-by-usama-fayyad. Fernández, A., Río, S., López, V., Bawakid, A., Jesus, M. J., Benítez, J. M., & Herrera, F. (2014). Big Data with Cloud Computing: an insight on the computing environment, MapReduce, and programming frameworks. WIREs Data Mining Knowledge Discovery, 4, 380-409. Gonzalez, J., Xin, R., Crankshaw, D., Dave, A., Franklin, M., & Stoica, I. (2014). GraphX: Graph Processing in a Distributed Dataflow Framework.
Vol. 2, No. 3, November 2015 17 Proc. of the 11th USENIX Symposium on Operating Systems Design and Implementation, 599-613. Greer Jr., M. B. (2013). 21st Century Leadership: Harnessing Innovation, Accelerating Business Success. iUniverse. Gupta, L. Hadoop – Big Data Tutorial. Retrieved December 29, 2015 from http://howtodoinjava.com/2015/07/08/hadoop-bigdata-tutorial/. Gupta, R., Gupta, S., & Singhal, A. (2014). Big Data: Overview. International Journal of Computer Trends and Technology, 9,5, 266-268. Gu, J. Using Gradient Boosted Trees to Predict Bike Sharing Demand. Retrieved December 29, 2015 from http://blog.dato.com/using-gradient-boosted-trees-topredict-bike-sharing-demand. Hasim, N., Haris, A. N. (2015). A study of opensource data mining tools for forecasting. IMCOM '15 Proceedings of the 9th International Conference on Ubiquitous Information Management and Communication, Article nº79. Hillebrand, J. Predict Social Network Influence with R and H2O Ensemble Learning. Retrieved December 29, 2015 from http://thinktostart.com/predict-socialnetwork-influence-with-r-and-h2o-ensemblelearning/ Hornik K. (2015). K. Retrieved August 8, 2015 from http://cran.r-project.org/doc/FAQ/R-FAQ. Hu, H., Wen, Y., Chua, T., & Li, X. (2014). Toward Scalable Systems for Big Data Analytics: A Technology Tutorial. IEEE Access, 2, 652-687. Huddar, M., & Ramannavar, M. (2013). A Survey on Big Data Analytical Tools. International Journal of Latest Trends in Engineering and Technology, 85-91. Jović, A., Brkić, K,. Bogunović, N. (2014). An overview of free software tools for general data mining. International Convention on Information and Communication Technology, Electronics and Microelectronics (MIPRO), 1112-1117.
International Journal of Big Data (ISSN 2326-442X) Kang, U., Tsourakakis, C., & Faloutsos, C. (2009). PEGASUS: A Peta-Scale Graph Mining System Implementation and Observations. ICDM '09. Ninth IEEE International Conference on Data Mining, 2009, 229-238. Kurzyniec, D., Wrzosek, T., Drzewiecki, D., & Sunderam, V. (2003). Towards Self-Organizing Distributed Computing Frameworks: The H2O Approach. Parallel Processing Letters, 13,2, 273-289.
Vol. 2, No. 3, November 2015 18 Live, Work and Think. United Kingdom: John Murray Publishers. Miller, H.G., & Mork, P. (2013). From Data to Decisions: A Value Chain for Big Data. IT Professional, 15(1), 57-59. MOA. MOA (Massive Online Analysis). Retrieved December 29, 2015 from http://moa.cs.waikato.ac.nz/.
Laney D. (2012). 3D Data Management: Controlling Data Volume, Velocity and Variety. File 494. Gartner.
Morandat F., Hill, B., Osvald L., & Vitek, J. (2012). Evaluating the design of the R language: objects and functions for data analysis. ECOOP'12 Proceedings of the 26th European conference on Object-Oriented Programming, 104-131.
Lee, K., Lee, Y., Choi, H., Chung, Y., & Moon, B. (2011). Parallel data processing with MapReduce: a survey. Newsletter ACM SIGMOD Record, 40,4, 1120.
OECD, http://www.oecd.org/ (2014). Small and medium-sized enterprises. OECD Factbook 2014: Economic, Environmental and Social Statistics.
Liu, X., Iftikhar, N., Xie, X. (2014). Survey of realtime processing systems for big data. IDEAS '14 Proceedings of the 18th International Database Engineering & Applications Symposium, 356-361.
Olson, M. HADOOP: Scalable, Flexible Data Storage and Analysis. Retrieved July 27, 2014 from https://www.cloudera.com/content/dam/cloudera/Res ources/PDF/Olson_IQT_Quarterly_Spring_2010.pdf.
Lourenço, J., Abramova, V., Vieira, M., Cabral, B., & Bernardino, J. (2015) Nosql Databases: A Software Engineering Perspective. WorldCIST'15 3rd World Conference on Information Systems and Technologies.
O’Reilly Media. (2012). Big Data Now: 2012 Edition. O’Reilly Media Inc.
Low, Y., Gonzalez, J., Kyrola, A., Bickson, D., Guestrin, C., & Hellerstein, J. (2014). GraphLab: A New Framework For Parallel Machine Learning. Proceedings of the Twenty-Sixth Conference on Uncertainty in Artificial Intelligence. Maharjan, S., Shrestha, P., Solorio, T., Hasan, R. (2014). A Straightforward Author Profiling Approach in MapReduce. In Ana L. C. Bazzan, Advances in Artificial Intelligence -- IBERAMIA 2014, 95-107. Santiago do Chile, Springer International Publishing. Marchand-Maillet, S., Hofreiter, B. (2014) Big Data Management and Analysis for Business Informatics. Enterprise Modelling and Information Systems Architectures (EMISA), 9(1), 90-105. Mayer-Schnberger, V., & Cukier, K. (2013). Big Data: A Revolution That Will Transform How We
Pointer. I. Apache Flink: New Hadoop contender squares off against Spark. Retrieved August 8, 2015 from http://www.infoworld.com/article/2919602/hadoop/fl fli-hadoops-new-contender-for-mapreducespark.html. RStudio. Open Source and enterprise-ready professional software for R. Retrieved December 29, 2015 from https://www.rstudio.com/products/rstudio/features/. Singh, D., & Reddy, C. (2014). A survey on platforms for big data analytics. Journal of Big Data, 2, 8, 1-20. Spark. Lightning-fast cluster computing. Retrieved December 29, 2015 from http://spark.apache.org/. Talwalkar, A., Sparks, E., Smith, V., Pan, X., Venkataraman, S., Zaharia, M., Griffith, R., Duchi, J., Gonzalez, J., Franklin, M., Jordan, M. I., & Kraska T. MLlib: Scalable Machine Learning on Spark.
International Journal of Big Data (ISSN 2326-442X) Retrieved August 4, 2015 from http://stanford.edu/~rezab/sparkworkshop/slides/xian xian.pdf. Tzoumas, K. Flink internals. Retrieved December 29, 2015 from http://www.slideshare.net/KostasTzoumas/flinkinternals-web Ullman, J. (2012). Designing good MapReduce algorithms. XRDS: Crossroads, The ACM Magazine for Students - Big Data, 19,1, 30-34. Vossen, G. (2014) Big data as the new enabler in business and other intelligence. Vietnam Journal of Computer Science, 1(1), 3-14. Wolpe, T. Machine-learning GraphLab raises $18.5m and rebrands as Dato. Retrieved August 30, 2015 from http://www.zdnet.com/article/machine-learninggraphlab-raises-18-5m-and-rebrands-as-dato/. Wu, X., Zhu, X., Wu, G., & Ding, W. (2014). Data Mining with Big Data. IEEE Transactions on Knowledge & Data Engineering, 26, 97-107. Xin, R. (2014). Spark officially sets a new record in large-scale sorting. Retrieved August 26, 2015 from https://databricks.com/blog/2014/11/05/sparkofficially-sets-a-new-record-in-large-scalesorting.html.
Authors Pedro Almeida is a final year student of computer engineering at ISEC (Instituto Superior de Engenharia de Coimbra) of Polytechnic of Coimbra, Portugal. His main research fields are big data, data mining and open source tools in which he has authored various papers in international conferences and journals.
!
Jorge Bernardino received the degree in computer engineering in 1987, the masters degree in systems and information technologies in 1994, and the PhD degree in computer science from the
Vol. 2, No. 3, November 2015 19 University of Coimbra in 2002. He is a Coordinator Professor at ISEC (Instituto Superior de Engenharia de Coimbra) of the Polytechnic of Coimbra, Portugal. His main research fields are big data, data warehousing, business intelligence, and open source tools, subjects in which he has authored or coauthored dozens of papers in refereed conferences and journals. He has served on program committees of many conferences and acted as a referee for many international conferences and journals in data warehousing and databases. He was President of ISEC from 2005 to 2010. During 2014 he was Visiting Professor at CMU – Carnegie Mellon University. Currently, he is the President of Scientific Council of ISEC.