Colour naming is the process done by human be- ings when they assign linguistic terms to objects to describe their colour. In computer vision, several.
New Trends and Challenges in Computer Vision
A Computational Colour Naming Model Trained on Real-Life Images Hany M. SalahEldeen, Robert Benavente and Maria Vanrell Computer Science Department, Computer Vision Center
Computer Vision Center Edifici O - Campus UAB, 08193 Bellaterra, Spain E-mail:{ hsalah, robert, maria.vanrell } @cvc.uab.es
Abstract Colour naming is the process done by human beings when they assign linguistic terms to objects to describe their colour. In computer vision, several colour naming models were developed and each has its own advantages and drawbacks. Models based on psychophysical data have a robust perceptual basis and obtain good results in ideal laboratory conditions, but they lack precision when applied to real images. On the other hand, models fitted using image data sets achieve better results when applied to real-life images, but they are not directly related to human perception. Thus, the goal of this paper is to merge two of these approaches to obtain a new model which includes the advantages of both methodologies. This modified model was tested against a data set of real-world uncalibrated images and the results exceeded the original model.
(a)
(b)
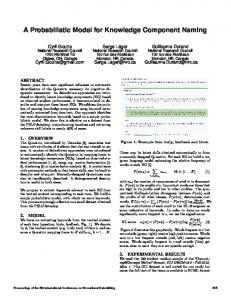
Figure 1: The Result of Color naming a picture of a car.
is the process of making a decision (in linguistic terms) about which colour best describes a given region of homogeneous hue. It is the last step in human colour-processing and it is performed in the visual cortex [8]. The aim of studying colour naming is to try to reduce the semantic gap in the task of giving names to colours in images. The semantic gap is the lack of a direct link between the low-level colour features extracted by Keywords: Colour Naming, Context-Based, Para- machines and high-level semantics humans use. This gap is even more significant in applications metric/Perceptual Model, Uncalibrated Data Set. like image retrieval where users require systems to support queries in natural languages [6]. Given so, an urgent need evolved to automate the pro1 Introduction cess of colour naming and accurately imitating huColour naming is one of the several visual tasks man perception in assigning colours. An autocommonly done by humans involving colour. It mated colour naming model is a model that can
46
4th CVC Research & Development Workshop
correctly assign a colour term to a specific pixel. Provided by any given image, a colour naming model is supposed to have the ability of analyzing each pixel in the image and successfully decide to which colour category it belongs (red, green,...etc). Several models were created to solve this problem of colour naming; some of these models will be shown shortly[7][5].
2
which is a variant of the one-dimensional sigmoid function as follows: S 1 (x, β) =
1 , 1 + exp(−βx)
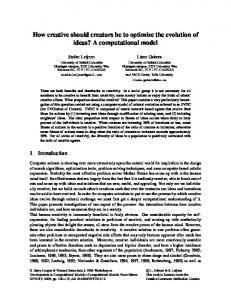
where β controls the slope of the transition from 0 to 1. Each of the chromatics are represented by a Triple Sigmoid function with an elliptical centre (TSE) (see figure 2).
Related Work
On the way of shaping the current understanding of the colour naming process nowadays, a lot of experiments were done and several models were developed. Some of which are Psychophysical, Neuropsychological or Computational [1, chap. 2]. Benavente et al.[2] developed a parametric model to fit data samples based on psychophysical experiments. These samples were fitted using a Triple Sigmoid function in six lightness layers. The idea behind creating this model is to find a suitable function capable of presenting the shape of each colour in the CIELab space1 . Given a point in the colour space, it is possible to decide the membership of this point to each of the 11 basic colour terms of Berlin and Kay2 [3]. 8 μC = T SE(p, parL1 ) > > > > < μC = T SE(p, parL2 ) . μC (p, I) = > > > . > : μC = T SE(p, parLN )
(a)
(b)
Figure 2: The TSE function fitting the chromatics.
T SE(p, β, α, e, φ, t) = DS(p, β, α, t)· ES(p, e, φ, t),
where DS is the Double Sigmoid function determining the separating boundaries between chromatics as follows: DS(p, β, α, t) = S1 (p, βx , αx , t)S2 (p, βy , αy , t),
if I ≤ I1 , if I1 < I ≤ I2 ,
γ1 = (x − tx)cos(α) + (y − ty)sin(α), 1 , S1 (p, β, α, t) = 1 + exp(−βγ1 ) γ2 = (x − tx)(−sin(α)) + (y − ty)cos(α), 1 , S2 (p, β, α, t) = 1 + exp(−βγ2 )
if IN < I,
μC is the membership of p to the chromatic3 category C, I is the intensity level range and N is the number of lightness levels defined in the model while parLx are the parameters of level x. TSE Vector α determines the axis in which the function stands for Triple Sigmoid with Elliptical center is oriented, p is the (x,y) point investigated and t is 1 The CIELab colour space is an approximately uniform where the origin was translated to. colour space generated by optimal colour stimuli with respect to CIE standard illuminant D65 2 Pink, Red, Orange, Brown, Yellow, Green, Blue, Purple, Gray, Black and White 3 Chromatics are colours Pink, Red, Orange, Brown, Yellow, Green, Blue and Purple
Another type of sigmoid function is used to define the middle part in each layer where the achromatic colours4 reside in the CIELab space. This 4
47
Achromatics are colours Gray, Black and White
New Trends and Challenges in Computer Vision
part takes an elliptical form and the function defining it is called the elliptic sigmoid function and it is illustrated as folows: (x − tx)cosφ + (y − ty)sinφ ), ex (x − tx)(−sinφ) + (y − ty)cosφ ), γ2 = ( ey 1 , ES(p, e, φ, t) = 1 + exp(−βe (γ1 + γ2 )) γ1 = (
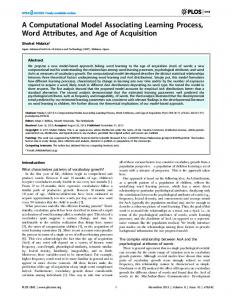
where e is the length of the axes of the central ellipse and φ is the rotation of this ellipse. Furthermore, within the elliptical sigmoid centre, the Figure 4: The PLSA color-naming model three achromatic colours reside and are separated by lightness through a one-Dimensional Sigmoid proaches in solving the problem of colour naming function. automation some conclusions were drawn. Firstly, each of the two models possesses several advantages and suffers from other drawbacks. The TSE model is a parametric model, thus it is compact and easy to analyze. The compactness feature comes from the ability to fully describe a certain colour in few parameters. The ease of analysis and comparison comes from the ability of comparing different versions of the model, different colours and different intensity levels with each other by examining the corresponding parameters (see [1, chap. 4]). The PLSA model is a probabilistic model based (a) (b) on uncalibrated images from real-world. Thus, Figure 3: The Triple Sigmoid Elliptical centre this model is more capable of correctly naming colours in images where acquisition conditions are model in one of the 6 intensity levels. unknown. The data set in which the model was The Probabilistic Latent Color Naming Model trained contains built-in information about context was developed by van de Weijer et al.[10] based on as well. Secondly, the parametric model is powthe same concept of the latent aspect models. One erful but lacks the ability of labelling uncalibrated of the most interesting characteristics of this model images from real-world with high accuracy. These is that it was fitted using a data set of real-world un- images are characterized by the variety of acquisicalibrated images. This data set was obtained from tion conditions from illuminant colour, angle of acGoogle images search engine and it is character- quisition, shadows, reflectance...etc. on contrary to ized by being weakly labelled. These weakly la- the psychophysical data obtained in an ideal conbelled Google images are represented by their nor- trolled environment. malized Lab histograms. These histograms form Given so, it is desired to create a model that enthe columns of the image specific word distribujoys both of the advantages of the two approaches. tion p(w|d). See figure 4. This model is required to be parametric and at the After analyzing two of the most interesting ap- same time trained on context-based data from real-
48
4th CVC Research & Development Workshop
world uncalibrated images. The steps of develop- the data provided as expected with some confusion ing this model will be illustrated in the next sec- areas. Fitted to the new data set, the fitting error tion. of the model was calculated with acceptable error margin as demonstrated in table 1. The error is calculated using Mean Absolute Error (MAE).
3
A Parametric Colour Naming Model for Uncalibrated RealWorld Images
M ethod name Original TSE T SEuncal
N um of samples 1617 32768
M AE f itting 1.68% 3.94%
% of well f itted samples 96.60% 85.92%
In the end of the previous section, it was concluded that it is needed to create a context-based parametric model. In order to achieve this goal, the para- Table 1: Statistics on the TSE model fitted to unmetric model of Benavente et al will be fitted us- calibrated data. ing the context-based data set utilized in the probwhere T SEuncal is the original TSE model fitabilistic semantic model of van de Weijer et al. ted to the uncalibrated data set alone.
3.1
Training the TSE model on Uncali3.2 brated Data
Bi-Elliptic Triple Sigmoid Model
It was proved that the model can represent contextbased data from uncalibrated images. After analyzing the fitting error and backtracking the misfitted samples it was noted that the colour brown achieves a high misfitting error which required a further analysis. A hypothesis was proposed that the brown colour exhibits a different behaviour than the rest of the chromatics and it is better fitted by another function due to the high error rate that it produce. This odd behaviour could be due to the non-ideal acquisition conditions of the realFor the fitting phase, the psychophysical-based life uncalibrated images and the embedded context Lut will be replaced by another resulted from the information in the data samples. analysis of Google data set images by the probaThe samples from the full Lut were gathered, dibilistic model of van de Weijer et al. mentioned earlier. The resulting Lut is considered the fitting vided into several lightness levels and plotted on a set on which the model will be fitted. As this fit- 3D plot (see figure 5). These samples are interpoting set is obtained from uncalibrated images in the lated into a smooth surface maintaining the same real-world, thus, it contains context-embedded in- characteristics. This was done to give an idea about the functions that will be needed to fit these data formation. samples. The modified Lut was provided to the TSE The analysis of the membership distribution of model in the fitting phase. Using the same number of intensity levels and the same ranges that the brown colour confirmed the feasibility of wellthose levels cover, the entire Lut was used in the fitting the data samples of brown colour using anfitting phase. The model was fitted successfully on other elliptical sigmoid function to be located in As it is illustrated in the TSE model of Benavente et al., a data set based on psychophysical experiments is utilized. These psychophysical experiments were commenced by Seaborn et al.[9] to model human perception of colour. A fuzzy colour category map is resulted from the analysis of these experiments. This map is sampled uniformly to be used in fitting the parametric model. The samples used in the fitting are gathered in what will be mentioned in the rest of the text as Lut (Look-up table).
49
New Trends and Challenges in Computer Vision
and modifying the fitting functions, the new BiElliptical Triple Sigmoid (BETS) model was developed. It is a modification to the original Triple Sigmoid model with two elliptical centres instead of one. One of the elliptical centres is used to define Brown while the other is used as before (a) (b) to define the achromatics. Figure 7 shows the Figure 5: Samples plotted according to their mem- new Bi-Elliptical Triple Sigmoid model and table berships in space, the X-Y axes are the a-b coor- 2 shows the fitting error resulted from testing the dinates and the Z axis is the membership value for new model. this data sample (from 0 to 1), right figure is 2D M ethod N um of M AE % of well prospective. name samples f itting f itted samples Original TSE T SEuncal BETS
1617 32768 32768
1.68% 3.94% 5.08%
96.60% 85.92% 88.97%
Table 2: Statistics on the Bi-Elliptical Triple Sigmoid model. (a)
(c)
(b)
(d)
Figure 6: Analysis and surfing of the brown and achromatics-sum, right figures are 2D prospective. Figure 7: The Bi-Elliptical Triple Sigmoid model the same vicinity of the achromatics-sum elliptical for an intensity level. sigmoid. These two elliptical sigmoids would be surrounded by the triple sigmoid functions representing the rest of the chromatic colours. The rest 4 Context-Based Colour Naming of the chromatics maintained their expected triple in Real-World Images sigmoid shape having the elliptic sigmoid of the achromatics to be the guiding centre. The work of Boynton[4] supports this hypothesis as well, and After developing the new Bi-Elliptical TSE model shows how the centroids of the colours are located and testing its fitting, it is needed to test it in reality in the perceptually uniform OSA space. This work as well. The fitting error is a good measure for the illustrates how the chromatics surround the Grey- accuracy of the model in representing the fitting data set but it is not enough to give a whole picture Black, White and Brown centroids uniformly. about the model. It is also needed to prove that the By applying this hypothesis on the data samples model produces good results upon testing against
50
4th CVC Research & Development Workshop
real-life images having different and unknown acquisition conditions. For these reasons the models were tested upon each step against the eBay images data set[10]. The eBay data set contains 4 categories (cars, dresses, pottery and shoes). Each category contains 10 images from each of the 11 basic colours. Along with each image there is a mask specifying the region in the image that is labelled with this colour. The testing takes place by applying the model to the pixels of each image within its mask and calculate the percentage of pixels correctly labelled with the expected colour (e.g. measuring the percentage of pixels labelled as red by the model to all the pixels inside the mask of an image containing a red car). Table 3 shows these results. M ethod Cars Dresses Pottery Shoes Total
T SE 53.34% 73.25% 61.5% 72.19% 65.07%
T SEuncal 48.79% 64.32% 62.49% 62.52% 59.53%
set it was tested against uncalibrated images. The new model achieved higher results than the original TSE model tested against the same data set separately. Thus, proving the hypothesis stated in the beginning of the possibility of creating an improved colour naming model by incorporating context-based real life data in the fitting set of a perceptual model. As for future work, a thorough analysis must be commenced for the areas between the elliptical centers and the other triple sigmoids and a search for a modification to the functions to provide better fitting should be established.
References [1] R. Benavente. A Parametric Model for Computational Colour Naming. PhD thesis, Universitat Aut`onoma de Barcelona, Bellaterra (Spain), Jun 2007.
Bi EllipticalT S 51.58% 78.18% 71.29% 70.61% 67.91%
[2] R. Benavente, M. Vanrell, and R. Baldrich. Parametric fuzzy sets for automatic color naming. Journal of the Optical Society of America A, 25(10):2582–2593, Oct 2008. [3] B. Berlin and P. Kay. Basic Color Terms: Their Universality and Evolution. Center for the Study of Language and Inf, March 1969.
Table 3: Results of testing against the eBay data set.
[4] R. M. Boynton and C. X. Olson. Locating basic colors in the osa space. Color Research & Application, 12(2):94– 105, 1987.
5
[5] L. MacDonald A. Tarrant H. Lin, M. Luo. A crosscultural colour-naming study. part iii–a colour-naming model. Color Research and Application, (26):270–277, 2001.
Discussion and Future Work
[6] E. S. Konak, U. Gudukbay, and O. Ulusoy. A content-
From the experiments and analysis done so far, based image retrieval system for texture and color several conclusions could be drawn. The data from queries, 2002. real-world uncalibrated images maintains a differ- [7] J. M. Lammens. A Computational Model of Color Perception and Color Naming. PhD thesis, University of ent shape, orientation and location from the data New York, 1994. of psychophysical experiments. The parametric model fits the data but with minor modifications. [8] P. Lennie. Single units and visual cortical organization. Perception, 27:889–935, 1998. After the analysis of this shifting and reformation, [9] M. Seaborn, L. Hepplewhite, and T. John Stonham. a conclusion was reached that the brown colour Fuzzy colour category map for the measurement of doesn’t maintain the same behaviour of the other colour similarity and dissimilarity. Pattern Recognition, chromatics and tends to follow the behaviour of 38(2):165–177, 2005. the achromatics in taking the shape of an elliptic [10] J. van de Weijer, C. Schmid, J. Verbeek, and D. Larlus. Learning color names for real-world applications. sigmoid situated next to the achromatics and surIEEE Transactions on Image Processing, 18(7):1512– rounded by the other chromatics. After success1523, jul 2009. fully fitting the model to the context-based data
51