Oct 5, 2011 - [10] Tinku A., Ajoy K., "Image Processing Principles and applications," John Wiley & Sons, Inc., Hoboken, New. Jersey, 2005. [11] Bernd J.," ...
IJCSNS International Journal of Computer Science and Network Security, VOL.11 No.10, October 2011
70
A Computer-Aided System for Classifying Computed Tomographic (CT) Lung Images Using Artificial Neural Network and Data Fusion Hanan M. Amer†, Fatma E.Z. Abou-Chadi††, and Marwa I. Obayya††† Faculty of Engineering, Mansoura University, Mansoura, Egypt Summary In this paper, computed tomographic (CT) chest images were investigated to develop a computer-aided system to discriminate different lung abnormalities. These were done by analyzing Data recorded for health issues, and also patients with lung asthma and emphysema diseases were taken in account. The techniques for utilized feature extraction included statistical, morphological features, as well as features derived from texture analysis, Fourier-based features and wavelet-based features. An artificial neural network (ANN) classifier was utilized and the results have shown that using wavelet domain features gives the highest rates to recognize lung abnormalities. Classification correct rate is up to 98.67%. Finally, the classification correct rate can be optimizing using two schemes of data fusion at the decision level, where it was found to reach the classification rate of 99.947%.
Key words: Computed tomographic, Computer-Aided Diagnosis, Fast Fourier Transform, and Discrete Wavelet Transform, Principal Component Analysis, Artificial Neural Network and Data fusion.
1. Introduction In recent years; great advances have been made in computer-aided systems for detecting disease from Computed Tomography (CT) scans, mainly due to the advances made in the scanning machines which allow a greater amount and quality of information to be extracted during a single breath of the patient. The use of feature extraction, textural analysis and pattern recognition techniques for classification is most suitable for the evaluation of global conditions (e.g. asthma, emphysema and normal) [1]. This recent progress in computer-aided systems for detecting disease in Chest Radiology has been discussed in [2]. Asthma is a chronic disease in which a patient suffers from repeatedly occurring attacks of difficulty in breathing and coughing. There seems to be an increase in the amount of asthma all over the world "especially among children". Emphysema begins with the destruction of air sacs (alveoli) in the lungs where oxygen extracted from the air
CO
2 ) in the blood. As is exchanged for carbon dioxide ( air sacs are destroyed, the lungs are able to transfer less
Manuscript received October 5, 2011 Manuscript revised October 20, 2011
and less oxygen to the bloodstream, causing shortness of breath. Air pollution, dust or chemicals and smoking can be considered the main factor that causes the previously mentioned lung diseases [3]. Previous work in this area have involved training machine learning algorithm using statistical, textural and/or morphological features of common patterns extracted from CT scans and documenting the success of classifying these patterns correctly. Uppaluri et al. [4] developed the Adaptive Multiple Feature Method (AMFM) to recognize honeycombing, ground glass, bronchovascular, nodular, emphysema like, and normal tissue patterns on the basis of their textures. This system produced an overall accuracy of 93.5%. More recently; Uchiyama et al. [5] selected regions in 315 high resolution computed topographic images from 105 patients, relating to six different patterns, ground-glass opacities, reticular and linear opacities, nodular opacities, honeycombing, emphysematous change, and consolidation, labeled by 3 radiologists the classifier used was artificial neural networks. The accuracy ranged from 88 to 100%, with specification in detecting a normal Region of Interest (ROI) of 88.1%. Recently, Sluimer et al. [6] reported a Computer-Aided Diagnosis (CAD) system to automatically distinguish normal tissue from abnormal tissue in chest scans of 116 patients, producing 657 ROIs labeled as containing normal or abnormal tissue. An accuracy of 86.2% was obtained, comparable to those of a radiologist when evaluating only the ROIs, i.e. without checking the whole scan. In this paper, a computer-aided system was developed to discriminate different lung diseases using CT images. Feature extraction techniques as well as artificial neural network classifiers were utilized. The paper is organized as follows: Section 2 data collection. Section 3 briefly explains the methodologies adopted. Section 4 presents the experimental results and Section 5 gives the concluding remarks.
2. Data Collection In the present study; 150 CT images of 512×512×8 bit were extracted from low-dose documented whole-lung CT
IJCSNS International Journal of Computer Science and Network Security, VOL.11 No.10, October 2011
scans (50 normal, 50 asthma and 50 emphysema). The CT scans were obtained in a single breath hold with a 1.25 mm slice thickness. They were obtained from the early lung cancer action project (ELCAP) association [8]. This database was made possible by collaboration between the ELCAP and VIA [8] research groups. It was created to make available common dataset that may be used for the performance evaluation of different computer-aided diagnosis systems. This database was first released in December 2003 and is a prototype for web-based image data archives. Three cases of human lung diseases (asthma, emphysema and normal) were considered in the present study. They have a resolution of 0.76×0.76×1.25. All images are available in Digital Images and Communication in Medicine (DICOM) format. An example of the images is shown in Fig.1.
Fig.1 Raw chest CT image
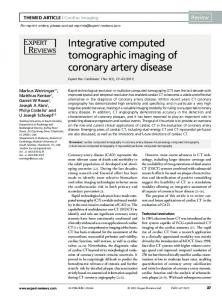
3. Methods The proposed system that processes and classifies automatically the digital CT images of the human lung consists of five main parts as shown in Fig.2. The first part is image enhancement to increase the quality of the input image. The second part is image segmentation to extract the lung. The third part is feature extraction and selection to extract the main features of the lung object using different techniques in spatial and transformed domain. The fourth part is the classifier to distinguish the aforementioned diseases. The last part is the data fusion at decision level to improve the correct classification rate.
3.1 Image Enhancement Due to low quality, low ability of distinguishing abnormalities from their surrounding, and artifacts which can be degrading the quality of CT images, sometimes to the point of making them diagnostically unusable; the first step in preprocessing is the image denoising. Therefore the current step in this work is to perform a comparative study of some famous image enhancement techniques; average filter [9], weighted average filter [9], Gaussian filter [9],
71
median filter [9], Wiener filter [10], and wavelet filter [10]. To compare and evaluate the performance of the previous types of filters using digital image simulation then applied the filter which has best result in the raw chest CT image.
Fig. 2 Block diagram of the proposed system
I. Digital Image Simulation In real data the term signal-to-noise ratio (SNR) is not defined, where the noise power and information power can not be computed separately [11]. Therefore, researchers use simulated data (information as well as different artifacts) in order to get quantitative measures for evaluating the performance of different image processing techniques. Generally, the simulated data must represent all salient information in both important data and different types of artifacts. A simulated image was a square image of dimension (128×128) with pixel values of "0" to represent the black background, and pixel values of “1” to represent the object information. Two concentric circles of different radii were generated inside the square image with pixel values of "1". During the imaging process all types of noises are present and affect the image quality; speckle noise, salt and pepper noise, and random (Gaussian) noise [10]. A simulated composition of all this types noises were blended to the previous simulated image with SNR equal of two. All mentioned types of filters are applied in the simulated noisy image and then calculated SNR of each resulted image to evaluate the performance of these filters by comparing the resulted images visually and comparing the values of SNR of each image that resulted from each filter type to get the most suitable filter that applied on the raw CT chest images. The simulated image and the simulated noisy image are shown in Fig.3, and the resulted images from all types of the previous filters are shown in Fig.4. The calculated SNR of each filtered image for all applied filters are shown in Table 1.
Fig.3 The simulated image and simulated noisy image.
72
IJCSNS International Journal of Computer Science and Network Security, VOL.11 No.10, October 2011
and surrounding tissues forms the basis for the majority of the segmentation schemes. A Canny edge detection algorithm was utilized using appropriated thresholds [10]. The result is shown in Fig. (6-a). Mathematical morphological operators were applied to the canny edge detection output; first dilate the lungs edges to get continuous lung edge [12-14]. Then the lungs area in the resulting image was filled Fig. (6-b, c). The next step was to erode the filled image using a diamond of size 1 so as to leave just the two lungs. An example of the final segmented lungs is illustrated in Fig. (6-d).
Fig.4 The digital simulation image process (a) the filtered image using average filter, (b) the filtered image using weighted average filter,(c) the filtered image using Gaussian filter, (d) the filtered image using median filter, (e) the filtered image using wiener filter, and (f) the filtered image using wavelet filter using (Daubchies-4).
Fig.5 The filtered CT chest image
Table 1 The calculated SNR of the filtered images using all types of filters Output SNR Filter Type Average Filter
7.3133
Weighted Average Filter
4.2478
Gaussian Filter
6.4443
Median Filter Wavelet Filter
8.5816 8.8732
Wiener Filter
13.3969
II. Application of Denoising Filters to CT Chest Images The performance of six denoising filter techniques has been compared as above. The results showed that the 7×7 Wiener filter mask gives the highest quality image compared to the other mentioned filtering techniques so it applied to the raw CT chest images. An example of the denoised raw CT chest image is shown in Fig.5.
Fig.6 The steps of lungs segmentation technique (a) The edge image, (b) The dilated image, (c) The filled image, (d) The segmented lungs image.
3.3 Feature Extraction and Selection 3.2 Lung Segmentation Any Computer-Aided system that analyzes the lungs and does not work on manually delineated regions of interest must incorporate automatic lung segmentation [10]. As the lung is essentially a bag of air in the body, it shows up as a dark region in CT scans. This contrast between lung
The third step is extracting the most salient features of digital CT images and reducing the dimensionality of acquired data [15]. Five sets of features were utilized and their performance was evaluated. The techniques used to calculate Features were: (1) statistical parameters, where six parameters were
IJCSNS International Journal of Computer Science and Network Security, VOL.11 No.10, October 2011
calculated (mean, variance, standard deviation, skewness, median, and kurtosis)[16], (2) morphological features, which give a set of features based on the object shape (area, centriod, Euler number, major-axis-length, minor-axis-length, bounding box, extreme, orientation, eccentricity, convex hull and solidity) [10],[16], (3) texture features that refers to the characterization of regions in an image by their texture content. These are entropy of grayscale image, contrast, correlation, energy and homogeneity of the create gray-level co-occurrence matrix from image [17], (4) Fourier descriptors [18] and (5) wavelet coefficients obtained by using (Daubchies-4) wavelet function and 9 resolution levels [10]. Feature selection is used to select those features that contain the most discriminatory information and to limit the number of features making; perhaps on grounds of cost or to remove redundant or irrelevant information [21]. This leads to obtain a less complex classifier. This was accomplished using the principal component analysis (PCA) technique [20-21]. The purpose of principal component analysis is to derive new features vectors that are linear combinations of the original features vectors (or matrixes), which are uncorrelated [19, 20]. This technique has three effects: (i) it orthogonalizes the components of the input vectors (so that they are uncorrelated with each other), (ii) it orders the resulting orthogonal components (principal components) so that those with the largest variation come first, (iii) and it eliminates those components that contribute the least to the variation in the data set. It has been found that for wavelet coefficients the number of features has been reduced from 512× 512 to 45 coefficients. Also, the number of features derived from Fourier has been reduced from 512× 512 to 85 coefficients.
3.4 Classifier using artificial neural network The fourth step in the suggested system is to design an artificial neural network (ANN) classifier [22-23] which discriminate correctly the different cases of human lung CT images. The input patterns to the classification stage are the resulting features vectors from the features extraction and selection stage. The classifiers were trained and their performance was evaluated using the dataset of CT lung images.
I. Network topology The ANN designed for classification consists of; input layer consists of nodes ( X 1 , X 2 ,... X n ) which vary by changing the feature vector. The subsequent hidden layers, process neurons with “Logsig” activation, and output layer with “tansig” activation function are used. The output layer (Y1 , Y2 ) has two neurons. Five networks were designed for the feature vectors derived from time domain
73
methods, frequency domain using Fast Fourier Transform (FFT), and Discrete Wavelet Transform (DWT) using (Daubchies-4) wavelet function, separately. Table 2 was illustrated the topology of each ANN classifier according to the input features vector.
II. Training the network The Back-Propagation Algorithm (BPA) is a supervised learning algorithm, in which a mean square error function is defined, and the learning process aims to reduce the overall system error to the minimum [23]. The connection weights are randomly assigned at the beginning and progressively modified to reduce the overall system error. The weight update is in the direction of negative descent to maximize the speed of error reduction [22]. The hold-out method was used with training and testing phase, where the training and testing data set size of each was 50% of total data size [24]. The target error was 0.0001, and learning rate of 0.9; based on trail and error approach. Table 2
The networks structure Networks Structure
Features Extraction Techniques
Input Layer Nodes
Hidden Layer Nodes
6
15
Texture Features
5
25
Morphological Features Frequency Domain Features Wavelet Domain Features
36
23
85
44
45
23
Statistical Parameters
3.5 Data Fusion at Decision Level The last step is to combine the results of individual classifiers using a suitable data fusion technique to improve the correct classification rate [25]. Data fusion is the process of combining data and knowledge from different sources with the aim of maximizing the useful information content. There are three possible levels of data fusion: fusion at the features level, fusion at the matching scores level and fusion at the decision level. The fusion at the decision level was utilized and the performance of two fusion techniques at decision level was examined. These techniques are Dumpster's rule and Bayesian formalism [25].
4. Results To evaluate the performance of the proposed system, the following accuracy measure was used [27]:
Accuracy(%) =
TP + TN × 100 TP + FN + TN + FP
(1)
IJCSNS International Journal of Computer Science and Network Security, VOL.11 No.10, October 2011
74
Where TP, TN, FN, FP stands for true positive, true negative, false positive and false negative respectively [28]. The results of classification obtained using the different sets of extracted features are depicted in Table 3. It can be noted that the DWT algorithms gives the best classification rate which reaches 98.67%. To improve the classification rate, the results of data fusion at the decision level for the classifiers using different five feature extraction techniques are shown in Table 4. It is shown that the non-linear combination of the classifier outputs of the multi-layer feed forward neural network using the Bayesian formula provides the highest correct classification rates. It reaches 100% for normal, 99.89% for asthma, and 99.95% for emphysema. Table 3 Performance Measures Features Extraction Techniques
Acknowledgment The author would like to express their cordial thanks to Prof. Fatma E.Z. Abou-Chadi and Dr. Marwa E. Obayya for their help and support.
Accuracy Normal
Asthma
Emphyse ma
80%
68%
76%
Statistical Parameters Texture Features Morphological Features Frequency domain Features Wavelet domain Features
96%
88%
92%
Avera ge 74.67 % 92%
92%
84%
88%
88%
76 %
88%
84%
100%
96%
100%
82.67 % 98.67 %
Table 4 Results of the classifiers co-operation Decision Fusion Techniques
network with back-propagation algorithm. It has been shown that the highest classification rate was obtained using the multiscale wavelet coefficients. A correct classification rate of 98.67% is achieved. An advantage of using the wavelet transform coefficients is that the processing time/cost needed in the feature extraction stage is the least due to the compacted representation of the wavelet transform. The results obtained from individual classifiers were then entered to a data fusion system for further improvement in the classification process. Using Bayesian formalism; it has been found that the correct classification rate reaches 99.947% which is much higher than the rates obtained using individual classifiers.
Cases Normal
Asthma
Emphysem a
Average
Dumpster's Rule
99.419 %
99.751%
99.814%
99.661%
Bayesian Formalism
100%
99.89%
99.95%
99.947%
5. Conclusion In this paper, a computer-aided system for detection of lung diseases has been developed. The system consists of five main parts: image enhancement, lung segmentation, feature extraction and selection, classification and data fusion at decision level. Image enhancement was carried out using Wiener filter. Lung segmentation was done using Canny edge detection technique and then performing morphological operations to the filtered images. Five sets of features were extracted using five different features extraction techniques. These are: statistical parameters, morphological features, Fourier and the usage of multiscale wavelet coefficients. Feature selection was achieved using the principal component analysis approach. The classifier consists of three-layer feed forward neural
References [1] Giger, M.L., N. Karssemeijer, and S.G. Armato, Guest editorial computer- aided diagnosis in medical imaging, pp. 1205-1208. [2] Guest Editorial in IEEE Transaction on Medical Imaging in 2001 Giger M.L. 2001. [3] Rhoades R.A., Tanner G.A. Medical Physiology, 2ndEdition, Lippincott Williams & Wilkins. 2003. [4] R.Uppaluri, E.A.Hoffman, M.Sonka, P.G.Hartley, G.W.Hunningshake and G. McLennan Computer recognition of regional lung disease patterns. Pp. 648-654. 1999. [5] Y.Uchiyama, S.Katsuragawa, H.Abe, J.Shiraishi, F.Li, Q.Li, C.-T.Zhang, K.Suzuki and K.Doi. Quantitive computerised analysis of diffuse lung disease in high-resolution computed tomography, Med. Phys., pp. 2440-2453, 30 (9) September 2003. [6] Sluimer IC, van Waes PF, Viergever MA, van Ginneken B. Computer-aided diagnosis in high resolution CT of the lungs, Med Phys. , pp. 3081-90, 30 (12) December 2003. [7] Eickeler,S., Kosmala, A., Rigoll, G., " Hidden Markov Model based online gesture recognition", Proc. Int. Conf. on Pattern Recognition (ICPR), PP.1755-1757,1998. [8] http://www.via.cornell.edu/lungdb.html. [9] Gonzales R.C. and Woods R.E., Digital Image Processing, 2nd Edition, New Jersey, Prentice Hall, 2004. [10] Tinku A., Ajoy K., "Image Processing Principles and applications," John Wiley & Sons, Inc., Hoboken, New Jersey, 2005. [11] Bernd J.," Digital Image Processing," 6th revised and extended edition, Springer-Verlag Berlin Heidelberg, Printed in The Netherlands, 2005. [12] Shi J., Malik J., "Normalizes Cuts and Image Segmentation," IEEE Trans., Pattern Anal. and Machine Intell., pp.888-905, 2000. [13] Mancas M., Gosselin B., Macq B., "Segmentation Using a Region Growing Thresholding," Circuit Theory and Signal processing Laboratory, 2004. [14] Haralick R.M., Sternberg S.R., Zhuang X., "Image Analysis Using Mathematical Morphology," IEEE Trans. On pattern
IJCSNS International Journal of Computer Science and Network Security, VOL.11 No.10, October 2011
[15]
[16] [17]
[18]
[19] [20]
[21] [22] [23] [24] [25]
[26] [27]
[28]
Analysis and Machine Intelligence, Vol. PAMI-9, No. 4. pp. 532-549, July, 1987. Randy Crane, A simplied approach to Image Processing: classical and modern technique in C. Prentice Hall, ISBN 0-13-226616-1, 1997. Sharma G. Digital color image handbook. CRC press LLC, New York, 2003. Haralein I., Ick R.M., Shanmugam K., Dinstein I., “Texture Features for Image Classification,” IEEE Trans., on system, Man and Cybernetics, pp. 610- 621, 1973. Akhloufi M.A., “A New Color-Texture Approach for Industrial Products Inspection,” Centre de Robotique et de Vision industrielles and Computer Vision Lab, laval university, Quebec, Canada, Journal of Multimedia, Vol.3, No.3, July 2008. Webb, A.R., "Statistical Pattern Recognition", John Wiley & Sons Ltd., 2002. Myoung Soo Park; Jin Hee Na; Jin Young Choi, "PCA-based feature extraction using class information", IEEE International Conference on Systems, Man and Cybernetics, pp.341-345, 2005. Chen, X., and A. Yuille, “Detecting and reading text in natural scenes”. CVPR. Volume: 2, pp. 366–373, 2004. Haykin s., "Neural Networks: A Comprehensive Foundition," Prentice Education, Inc, 2002. Theodoridis S. Koutroumbas K, Pattern Recognition, 2nd Edition, Boston, Academic Press, 2003. R. Duda, and P. Hat, "Patter Classification and Scene Analysis". New York, Wiley, 1973. Ross A., Jain A., "Information Fusion in Biometrics," Elsevier Science, Pattern Recognition Letters, Vol. 24, pp. 2115-2125, 2003. Dasarathy B.V., Decision Fusion, IEEE Computer Society Press, 1994. Ruiz F.V., Nasuto J.S., Biomedical-Image Classification Methods and Techniques In: Medical Image Analysis Methods, pp. 137- 183, edited by L. Costaridou (Taylor & Francis Group LCC, CRC Press: Boca Raton, FL, 2005), Papadopoulos N.A., Plissiti E.M., Fotiadis I.D., Medical-Image Processing and Analysis for CAD Systems In: Medical Image Analysis Methods, pp. 51-86, edited by L. Costaridou (Taylor & Francis Group LCC, CRC Press: Boca Raton, FL, 2005)
75
Hanan M. amer received the B.S. in Electronics and Communications Engineering from Faculty of Engineering, Mansoura University, Egypt in 2007. She is now preparing for M.S. degree in Electrical Engineering. Her interests include signal processing, image processing and information security. Fatma El-Zahraa Abou-Chadi is currently a professor and head of department of Electronics and Communications Engineering Department, Faculty of Engineering, Mansoura University, Egypt. Her research interests focus on digital signal processing, image processing and biomedical engineering. Marwa I. Obayya is doctor in Electronics and Communications Engineering Department, Faculty of Engineering, Mansoura University, Egypt.