www.rsc.org/pps | Photochemical & Photobiological Sciences. FRETView: ... Nathan Stevens, Joanne Dyer, Angel A. Martı, Marissa Solomon and Nicholas J. Turro*. Received ... using the FRET process for ratiometric-based molecular probes.3,4 .... 2 N. J. Turro, Modern Molecular Photochemistry, University Science. Books ...
TECHNICAL NOTE
www.rsc.org/pps | Photochemical & Photobiological Sciences
FRETView: a computer program to simplify the process of obtaining fluorescence resonance energy transfer parameters Nathan Stevens, Joanne Dyer, Angel A. Mart´ı, Marissa Solomon and Nicholas J. Turro* Received 20th February 2007, Accepted 11th April 2007 First published as an Advance Article on the web 24th April 2007 DOI: 10.1039/b702631e The process of modeling the fluorescence resonance energy transfer (FRET) process for a donor–acceptor pair can be rather challenging, yet few computer programs exist that allow such modeling to be done with relative ease. In order to address this, we have developed a Java-based program, FRETView, which allows numerous FRET parameters to be obtained with just a few mouse clicks. Being a Java-based program, it runs equally well on all the major operating systems such as Windows, Mac OS X, Linux, Solaris. The program allows the user to effortlessly input pertinent information about the donor–acceptor pair, including the absorption and/or emission spectra, and outputs the calculated FRET parameters in table format, as well as graphical plots.
Introduction The nonradiative process of fluorescence resonance energy transfer (FRET) between an excited state donor and a ground state acceptor has been extensively covered in the literature.1,2 The through-space nature of the FRET process has resulted in its utilization in numerous fields of research. For example, by attaching chromophores which form donor–acceptor pairs onto DNA segments this group has demonstrated the applicability of using the FRET process for ratiometric-based molecular probes.3,4 Light emitting materials capable of displaying a range of colors have also been developed by making use of FRET principles.5,6 Ultrafast optical switching is yet another area in which FRET has found applicability.7 The ability to probe the spatial relationship between a donor and acceptor species, as a result of the distance dependence on the energy transfer process, has often led to FRET being used as a molecular ruler. Given the donor–acceptor spectral data and a few photophysical parameters (e.g., quantum yield) about the system, an accurate value for the donor acceptor spacing ¨ can be obtained using the well known Forster equations.1 It is the application of these equations to model the FRET process that can prove challenging because of the integration and normalization steps involved. Naturally, computer programs have been written to largely automate these mathematical operations. Among the best known of these is probably the PhotochemCad program developed by Lindsey et al.8 The program works quite well, but is currently only available for computers running the Windows operating system. In this paper, a cross-platform Javabased program that is geared primarily towards the calculation and visualization of FRET parameters is described.
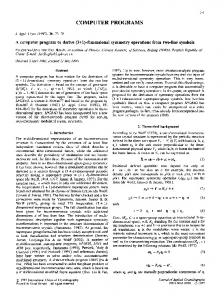
approach, rather than developing a stand alone application, provides several advantages. For one, since the parent program is Java-based, it is able to run on a variety of operating systems, not just the typical Windows and OS X as with many other scientific programs. Also, being written as a plugin significantly simplified the development process, because a substantial amount of program code was already written for the parent program, InstruView. The code for data storage, file reading, and graphing were all based on program code already in use. Another advantage of taking the plugin approach is that it allows data which have been transformed and indexed by the parent program to be seamlessly imported into the spectral database. The program consists of several interconnected modules which are outlined in Fig. 1. Since the program is distributed as an open source program, a modular design makes it easier for other developers to refine and extend it. The Spectral Database module stores the emission and absorption spectra of the desired chromophores along with other pertinent information such as extinction coefficient, quantum yield, and radiative lifetime. For testing purposes, a spectral database consisting primarily of spectroscopic data downloaded from Invitrogen’s website is provided. It should be noted that for most chromophores in the database, the quantum yield and lifetime values was not provided
Description The program was developed as a plugin for a Java-based custom data management and visualization program, InstruView.9 This Department of Chemistry and Department of Chemical Engineering Columbia University, New York, NY, 10027, USA. E-mail: njt3@columbia. edu; Fax: 1212-932-1289; Tel: 1212-854-2175
Fig. 1 Simplified flow diagram showing the program modules of the FRETView plugin.
This journal is © The Royal Society of Chemistry and Owner Societies 2007
Photochem. Photobiol. Sci., 2007, 6, 909–911 | 909
so dummy values are used instead. The User Interface module provides an intuitive graphical user interface (GUI) which allows the inputting of FRET parameters and viewing of calculation results in both a spreadsheet format as well as graphical plots. A GUI for the management of the spectral database is also provided by this module. All calculations are handled by the Math module which implements the equations for calculating the FRET parameters. Currently this module implements equations ¨ for calculating the Forster distance (R0 ), transfer efficiency (E), transfer rate (kt ), donor intensity (F d ), acceptor intensity (F a ), total intensity (F t ), and the acceptor’s lifetime (sa ) as a result of the energy transfer process. The Strickler–Berg formula10 is also included to allow lifetimes to be estimated from the spectroscopic data and quantum yield of a chromophore. Regardless of the capabilities of the program, without the ability to easily share spectral databases with others, its usefulness is inherently limited. As such, the Network module is added to allow access to spectral databases over the Internet.
Discussion In order to show the suitability of the program for obtaining FRET parameters, the output it generates has been compared to several literature sources11,12 as well as the output from the often used PhotochemCAD program. The R0 values for several of the Alexa fluor dyes in the database were found to be within 5% of those reported in ref. 11. However, without access to the spectral data and input parameters the author used to calculate the R0 values, it is not possible to say which calculation is more precise. The results for these calculations are presented in Table 1. Furthermore, the R0 calculations were compared with those found by using an
¨ Table 1 Comparison of Forster distance, R0 , calculated for a series of Alexa Fluor dyes using FRETView with those reported in ref. 11. Alexa Fluor 488 was chosen as the energy donor Acceptor
R0 (ref. 11)
R0 (FRETView)
Alexa 546 Alexa 555 Alexa 568 Alexa 594 Alexa 647
64 70 62 60 56
62 69 62 57 54
Deviation (%)a 3.1 1.4 0 5.0 3.6
a The differences in values are to be expected since the input values and spectroscopic data used in the calculations likely differs.
Excel spreadsheet provided by Invitrogen and the values matched exactly. The feature that allows the modeling of the lifetime and intensity variation of an acceptor due to energy transfer from a long-lived donor was also ascertained. Using ref. 12 as a guide, the values obtained are consistent with those published. This is not surprising considering that the equations used in the program are derived primarily from this source. Moreover, the ease of which the input parameters can be varied and calculation obtained, inherently allowed a wider range of simulations to be undertaken. To ascertain the validity of the Strickler–Berg formula (implemented to allow the fluorescence lifetime to be calculated using absorption and emission data) the values obtained using the PhotochemCAD program and this program were compared and are found to be within 1% of each other. Table 2 contains the results from a few of these calculations. This minor variation is likely due to differences in the method of integration and/or rounding procedures implemented by the programs. However, neither program appears to accurately estimate the fluorescence lifetime and point to the overall weakness of the Strickler–Berg formula. The calculated lifetime for fluorescein was also compared to that published by Strickler and Berg,10 and is found to be identical (4.37 ns) when the same input parameters was used. It is clear from these comparisons that the program is working as intended, but as with most other modeling programs, the quality of the obtained results are largely dependent on the quality of the input parameters.
Conclusions In summary, by making use of Java technology we have developed a cross platform, highly intuitive program for obtaining and visualizing FRET parameters. It can be used to model the energy transfer process between various donor and acceptor pairs, allowing the user to try many combinations in silico prior to any experimental work. Such an approach can result in savings in both time and resources. Also, the ease of which the input parameters can be varied and the results calculated, make it an excellent tool for teaching some of the fundamental aspects of the energy transfer process. The program and the accompanying source code can be freely downloaded from the following website: http://turmac13.chem.columbia.edu/fretview/index.html. It is the authors’ hope that by providing access to the source code, the overall functionality of the program will be extended by others.
Table 2 Calculated lifetimes in nanoseconds using PhotochemCAD and FRETView for a numerous chromophores. In each case the same input parameters and spectroscopic data were used
a
Dye
Lifetime (PhotochemCAD)/ns
Lifetime (FRETView)/ns
Fluorescein Sulforhodamine 101 Rhodamine 6G Cresyl Violet Merocyanine 540
4.74 3.87 3.85 2.42 1.35
4.70 3.84 3.81 2.40 1.34
Deviationa (%) 0.9 0.8 1.0 0.8 0.7
The differences in values are likely the result of differences in the integration and/or rounding procedures used.
910 | Photochem. Photobiol. Sci., 2007, 6, 909–911
This journal is © The Royal Society of Chemistry and Owner Societies 2007
Acknowledgements This work was supported by the Center of Excellence in Genomic Science Grant P50 HG002806 from the National Institutes of Health and NSF CHE-04-15516.
6
7
Notes and references 1 J. R. Lakowicz, Principles of Fluorescence Spectroscopy, Plenum Press, New York, 2nd edn, 1997. 2 N. J. Turro, Modern Molecular Photochemistry, University Science Books, California, 1991. 3 S. Jockusch, A. A. Mart´ı, N. J. Turro, Z. Li, X. Li, J. Ju, N. Stevens and D. L. Akins, Spectroscopic investigation of a FRET molecular beacon containing two fluorophores for probing DNA/RNA sequences, Photochem. Photobiol. Sci., 2006, 5, 493. 4 X. Li, Z. Li, A. A. Mart´ı, S. Jockusch, N. Stevens, D. L. Akins, N. J. Turro and J. Ju, Combinatorial fluorescence energy transfer molecular beacons for probing nucleic acid sequences, Photochem. Photobiol. Sci., 2006, 5, 896. 5 I. G. Scheblykina, L. S. Lepnev, A. G. Vitukhnovsky and M. Van der Auweraer, Electroluminescence and optical properties of
8
9 10 11 12
poly(phenylenevinylene)/J-aggregate composites, J. Lumin., 2001, 94– 95, 461. H. Xia, C. Zhang, X. Liu, S. Qiu, P. Lu, F. Shen, J. Zhang and Y. Ma, Ruthenium(II) Complex as Phosphorescent Dopant for Highly Efficient Red Polymers Light-Emitting Diodes, J. Phys. Chem. B, 2004, 108, 3185. N. Stevens, Nonlinear Optical Switching Properties of Dye-Doped Composite Films, PhD Thesis, The City University of New York, New York, NY, 2006. J. M. Dixon, M. Taniguchi and J. S. Lindsey, PhotochemCAD 2: A Refined Program with Accompanying Spectral Databases for Photochemical Calculations, Photochem. Photobiol., 2005, 81, 212. N. Stevens, InstruView, http://casilab10.sci.ccny.cuny.edu/∼nathan/ projects/instruview/index.html (accessed 01/05/07). S. J. Strickler and R. A. Berg, Relationship between Absorption Intensity and Fluorescence Lifetime of Molecules, J. Phys. Chem., 1962, 37, 814. ¨ M. Borsch, Single Molecule Detection, http://www.m-boersch.org/ single_molecule_detection/single_molecule_detection.html (accessed 01/05/07). B. P. Maliwal, Z. Gryczynski and J. R. Lakowicz, Long-Wavelength Long-Lifetime Luminophores, Anal. Chem., 2001, 73, 4277.
This journal is © The Royal Society of Chemistry and Owner Societies 2007
Photochem. Photobiol. Sci., 2007, 6, 909–911 | 911