AGILE 2011, April 18-22: Frank O. Ostermann, Laura Spinsanti. 2 ... increasing amount of bi-directional horizontal peer-to-peer information exchange also affects ...
A Conceptual Workflow For Automatically Assessing The Quality Of Volunteered Geographic Information For Crisis Management Frank O. Ostermann, Laura Spinsanti Joint Research Center, European Commission Via E. Fermi, 21027 Ispra, Italy {frank.ostermann, laura.spinsanti}@jrc.ec.europa.eu
INTRODUCTION In this paper, we aim to present a complete conceptual work flow for the assessment of user generated geographic content, or volunteered geographic information (VGI), for the use in a crisis management context. We provide an example on forest fires, but the modular workflow is adaptable to other types of crisis events. The rationale for the research is that new social media platforms change the way people create and use information during crisis events (Sutton, Palen, and Jeannette Shklovski 2008; Hughes et al. 2008). These social media platforms increasingly offer to include geographic information on the whereabouts of their users. These location-based mobile social networks are becoming increasingly popular with citizens, and have been already used in the context of managing crises caused by natural disasters (Jiang and McGill 2010; Starbird and Stamberger 2010). Potentially, the rich information made available by members of the public can contribute to a more effective response to natural disasters. On a broader scope, the research draws on the concept of citizens as sensors for a next generation digital earth (Craglia et al. 2008; De Longueville, Annoni, et al. 2010), which would consist of multiple connected infrastructures, addressing the needs of very heterogeneous audiences. There are two main approaches in engaging citizens in sensing: participatory and opportunistic (Jiang and McGill 2010). Our approach is the latter and aims to tap into the abundance of VGI offered without any institutional or organizational framework. However, there are three main challenges for using VGI: its sheer volume, its deficit of clear structure and its lack of quality control. The amount of VGI has increased tremendously over the past years, and with the introduction of GPS receivers in smartphones and digital cameras and widespread mobile internet access, we can expect this development to continue for the next years. The heterogeneous media formats and interface options of the various social media platforms lead to a wide variety of possible data structures. This problem is aggravated by the lack of syntactical control over the data entered by the users and by the ingenuity of users and software developers able to overcome device or interface limitations. Further, user generated content always contains a various proportion of disruptive or redundant content. Especially this issue has been a reason for skepticism from administrations and other official institutions. At the same time, it has been the focus of the research community (Bishr and Mantelas 2008; Flanagin and Metzger 2008). To these three challenges, the domain of crisis management adds the specific need for speed and reliability: a slow response based on erroneous data can lead to severe consequences, like the loss of life. So far, these tasks have been mainly carried out by human volunteers with great success (compare several contributions to (Corbane et al. 2010)). However, for an even larger volume of input VGI, the challenges clearly require an automated approach for the VGI retrieval and filtering tasks. We propose further that the integration with existing spatial data infrastructures (SDI) can greatly enhance the options for assessing the quality of VGI. To this end, the research project aims to automatically collect, filter, and analyze VGI, and integrate the assessed data into established “official” information and decision flows. In this paper, after giving brief background information on VGI and crisis management, we focus on the extension and refinement of a work flow proposed originally by deLongueville et al. (2010).
AGILE 2011, April 18-22: Frank O. Ostermann, Laura Spinsanti
VOLUNTEERED GEOGRAPHIC INFORMATION AND DISASTER MANAGEMENT In this section, we briefly describe in which phases of the disaster/hazard management cycle volunteered information can play an important role. The public has already been strongly involved in natural disasters and has often provided a substantial amount of information (Palen and Liu 2007). However, the recent and expected increase in VGI on natural disasters, coupled with the heterogeneous and unstructured form of data, is going to change the way information is collected, distributed and used. The web 2.0 has given the public the opportunity to share and learn from their experiences through texts (blogs), photos (Flickr, Picasa, Panoramio, …) and maps (GoogleMaps, GoogleEarth, …), not only seeking but also providing information. A further boost of this trend has been the additional possibility to reach an even larger number of people in near real-time through social media platforms like Twitter and Facebook. This increasing amount of bi-directional horizontal peer-to-peer information exchange also affects the traditional uni-directional vertical flow of information (Hughes et al. 2008). Traditional broadcasting media open up to micro journalism and several official administrative agencies already adapt and use third-party social media accounts for communicating information (Latonero and Irina Shklovski 2010). However, incorporation of VGI into the administrative established emergency protocols has not advanced significantly. It seems that public officials view such volunteered information mainly as a threat that could spread misinformation and rumor (Sutton et al. 2008). Examples of research on the role of VGI during concrete disasters are manifold (De Longueville, Luraschi, et al. 2010; De Longueville, Smith, and Luraschi 2009; Hudson-Smith et al. 2009; Liu and Palen 2010), still a lot of open question remain to be investigated. Among the others, we argue that that the increasing amount of information renders a manual filtering of incoming information infeasible. Our proposed workflow tries to automatize as many steps as feasible.
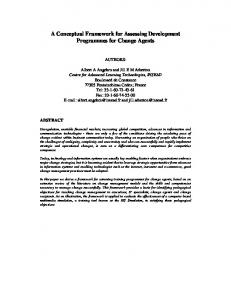
WORK FLOW CONCEPT: FROM COLLECTING VGI TO INTEGRATION WITH SDI To give a brief overview we propose the high level workflow in Figure 1. It starts with the retrieval of data from various social media sources on a specific topic, i.e. forest fires. Depending on the type of crisis event, several public institutions can provide additional input. Here, the European Forest Fire Information Service (EFFIS, effis.jrc.ec.europa.eu) is used as an example. Then, this data is validated syntactically and formatted according to the needs of later processing phases. The validated and formatted data is then enriched with additional information, mainly about the location, but also about the source. The main aim is to assess the quality of this enriched VGI: what is its overall credibility and what is its relevance for actual forest fire events. Once these metrics have been determined, the data is integrated with existing SDIs, before the dissemination phase makes the results available to the two intended target audiences of decision-makers and citizens. It is important to note that at the current exploratory stage of research, we have not yet defined on purpose any logical or physical aspects of the workflow, such as storage format, output formats, or service architecture. Each phase is explained in a subsection, with the focus on the processing phase.
Figure 1: Overview of work flow Retrieval The retrieval phase can have different levels of complexity. A very simple approach is to use keywords related to the disaster category. Thus, in the forest fire case, the words wildfire, fire, forest could be used. However, this simplistic approach has several limitations that ignore important
2
A Conceptual Workflow For Automatically Assessing The Quality Of Volunteered Geographic Information For Crisis Management
linguistic and semantic aspects: (i) some keywords can have several meanings (homonymy) depending on the context or be used figuratively (ii) the cross-referencing between different media platforms and (iii) complex geographic relations between message elements. For example, considering (i), fire is colloquially used instead of wildfire, but it has multiple other meanings. In this case, only the co-occurence of other semantically related words such as evacuation, alert, helicopter can give a high probability to fire to be the shorten version of wildfire. In (ii) we have observed users messaging on one media platform about updates of an event on another media platform. Concerning (iii), a single message may contain (several) geographical toponym(s) and qualifiers like near, some km from, etc. that can give a detailed fire location expressed in the message. There is a large body of established research on the linguistic and semantic aspects, coming from the research domains of semantic information retrieval, natural language processing and text mining. We intend to draw on this body of knowledge, and focus our research efforts on the second and third challenges by integrating the analysis of other social media platforms, and to devise a system that dynamically updates the retrieval keywords. Processing The core part of the work flow is the data processing phase. The geographic information plays a central role in each sub-steps of the processing phase. These are: (i) to enrich the single retrieved information with additional data, such as location and source profile data, (ii) to assess the information quality in terms of relevance and credibility, and (iii) to analyze patterns within the VGI. These three aspects are not disconnected since, for example, the extracted information on patterns can lead to new knowledge that feeds back into the assessment of the single information, and vice versa. Clearly, it is a complex iterative knowledge discovery process that involves several steps and cycles, especially for data sources that are continuously updated during the event. We briefly described each step sequentially, as follows: Enrich the information. a. Transform implicit geographic information into explicit coordinates that can be used in the subsequent spatio-temporal analysis. We define as implicit any geographic information without coordinates, such as place names (toponyms) mentioned in the text body, image caption or user profile information. While there are established methods for geocoding toponyms, many return only a pair of coordinates, i.e. a point. More advanced methods aim to derive a spatial footprint for a toponym using different sources (Smart, Jones, and Twaroch 2010). To complicate matters, each piece of geographic information can have different geographic granularity. b. Categorize the source, e.g. as newsfeed, person, or public agent. Based on some studies on Twitter user behavior (Krishnamurthy, Gill, and Arlitt 2008; Java et al. 2007), users can be classified as person using some parameters like the numbers of followers and friends. Moreover the presences of specific kinds of web link or symbols as “@” or “RT” are parameters to use in the classification purpose. Classification methods are well established data mining methods. Assess the quality using credibility and relevance as metrics a. the credibility or reputation of each source based on its categorization and previous behavior, or ratings from other users b. the relevance of the information itself based on semantic criteria, such as keywords occurrences c. the spatial information of the content and of the source with respect to an observed event. When two or three kinds of geographic information exist simultaneously they can reinforce each other or weaken the credibility of the geographic information. Consider the following Tweet: “Two very large forest fires in the mountains behind Funchal clouds of smoke covered the sun turn sunlight deep yellow ash coming down”1. Suppose the Tweet message itself has the coordinates C1={x1,y1} originating from the source device using GPS. The geocoded toponym “Funchal” from the text has different coordinates C2={x2,y2}. Finally, the user profile has a location (either in coordinates or a place name that can be geocoded), resulting in a third set of coordinates C3={x3,y3}. Depending on the granularity of the location, we can empirically derive threshold values for the distances D between coordinate pairs, i.e. D1(C1,C2), D2(C1,C3) and D3(C2,C3), that lead to increased or decreased assessment criteria value. Further, because local knowledge is an important quality criteria in a crisis context, a user's profile location, i. e. where s/he has his/her center of life, can be used to evaluate and rate the content based on the distance from the user location and the content location. d. cross-referencing with other information from the same source (including from other platforms), with other information that is spatially and or temporally close (see next section), and also with
1
Twitter posted by user “Kevin bulmer” on Fri Aug 13 2010 h20:21
3
AGILE 2011, April 18-22: Frank O. Ostermann, Laura Spinsanti
information from administrative or commercial datasets, e.g. land cover, population density, etc.. The combination of these strands will give a measure of the overall quality/fitness-for-purpose of the VGI analyzed. The cross reference it is also useful to further assess a cluster’s credibility. This process is bidirectional: assess one piece of information can be used to define or modify the cluster assessment and vice versa. Spatio-temporal clustering a. After having assessed the quality of a single piece of information, it is necessary to look at the bigger picture and determine possible relationships between the various pieces of information. We argue that VGI can be used to validate data from other sources (e.g. remote sensing), or provide timely information on events that would otherwise remain undetected, or be detected too late: Events are time and space located so spatio-temporal clustering methods should be used to determine whether some information relates to the same forest fire event as other pieces of information. The clustering can be based on the data alone, or use background population information, such as the population density, for fine-tuning. First attempts will try to detect know fire events in the VGI data. Integration During the integration phase, the results of the processing phase are integrated with data from official, authoritative SDIs. The exact type and extent of integration depends on the target SDI: its complexity, granularity, and data formats, as well as its physical storage structure. Further, there are important legal consequences to be considered. For some public administrations, it may even be prohibitive to combine user generated content and their own data in a common structure. It is also expected that administrations will be reluctant to agree on a close or tight integration of VGI and official data because of liability issues. A loose integration that keeps the data separate but allows the combined use and display of VGI and SDI seems a more promising approach. In this case, the VGI needs to be converted and adapted to specificities of the target SDI. Dissemination During the dissemination phase, the results are reported to the two main target audiences of general public and decision makers. For both target audiences, making informed decisions under time pressure and uncertainty is a crucial requirement. However, the expected interfaces and circumstances of use can be expected to be very different. Public decision makers might rely on displays the size of desktop monitors, or even employ large wall-projected visualizations in a synchronous collaborative effort. They can also be expected to have a sufficient level of domain knowledge to quickly assess implicit implications of the data presented. Their aim is to coordinate efforts of crisis management. Public citizens, on the contrary, are much more likely to be mobile, employing devices with a small screen. Their main objective is to find information on very concrete needs like evacuation routes and shelters. While they might have less detailed domain knowledge on disaster, they can be expected to have good locational knowledge. Both groups might also have very diverging requirements concerning the display of uncertainty inherent in the information. While decision-makers might want to deal with detailed information on different aspects of uncertainty (e.g. vagueness of locations) and need detailed levels of credibility and relevance, citizens might be overwhelmed by this information, and a simpler, binary classification such as “relevant/irrelevant” or “credible/dubious” might suffice. Clearly, these two target groups have very distinctive needs and requirements, which need to be addressed in a task- and user-driven design process of the visualizations.
CONCLUSION In this paper, we have argued that VGI has immense potential in the use of managing crisis events. This utility is yet largely untapped. However, with the expected increase of VGI, the potential usefulness increases, while at the same time the problems in making the large volumes of relatively unstructured data also increase. Consequently, we have explored and presented a conceptual workflow for an automatized retrieval, processing, analysis, quality assessment and dissemination of user generated geographic content or volunteered geographic information (VGI). While the research aims to provide a complete coverage of a potential workflow, we focus on the geographic aspects of the data, i.e. the value of location information for determining the credibility and relevance of the VGI, and detection and assessment of crisis events. We have presented an approach that is modular and can easily incorporate research advances from other scientific disciplines, e.g. improved information retrieval procedures, semantic analysis methods, or new technological options for disseminating and visualizing the resulting quality-assessed VGI.
4
A Conceptual Workflow For Automatically Assessing The Quality Of Volunteered Geographic Information For Crisis Management
REFERENCES Bishr, Mohamed, and Lefteris Mantelas. 2008. A trust and reputation model for filtering and classifying knowledge about urban growth. GeoJournal 72, no. 3: 229-237. Corbane, C., D. Carrion, M. Broglia, and M. Pesaresi, eds. 2010. Proceedings of the 2nd International Workshop on Valication of Geo-Information Products for Crisis Management. Ispra: European Commision, Joint Research Center. Craglia, Max, Michael F. Goodchild, Alessandro Annoni, Gilberto Camara, Michael Gould, Werner Kuhn, David M. Mark, et al. 2008. Next-Generation Digital Earth: A position paper from the Vespucci Initiative for the Advancement of Geographic Information Science. International Journal of Spatial Data Infrastructures Research 3: 146-167. De Longueville, Bertrand, Alessandro Annoni, Sven Schade, Nicole Ostlaender, and Ceri Whitmore. 2010. Digital Earth's Nervous System for crisis events: real-time Sensor Web Enablement of Volunteered Geographic Information. International Journal of Digital Earth 3, no. 3: 242 - 259. De Longueville, Bertrand de, Gianluca Luraschi, Paul Smits, Stephen Peedell, and Tom de Groeve. 2010. Citizens as Sensors for Natural Hazards: A VGI integration Workflow. Geomatica 64, no. 1: 355-363. De Longueville, Bertrand de, Robin S. Smith, and Gianluca Luraschi. 2009. "OMG, from here, I can see the flames!": a use case of mining location based social networks to acquire spatiotemporal data on forest fires. Proceedings of the 2009 International Workshop on Location Based Social Networks. doi:http://doi.acm.org/10.1145/1629890.1629907. Flanagin, Andrew, and Miriam Metzger. 2008. The credibility of volunteered geographic information. GeoJournal 72, no. 3: 137-148. Hudson-Smith, Andrew, Andrew Crooks, Maurizio Gibin, Richard Milton, and Michael Batty. 2009. NeoGeography and Web 2.0: concepts, tools and applications. Journal of Location Based Services 3, no. 2: 118 - 145. Hughes, Amanda L., Leysia Palen, Jeannette Sutton, Sophia B. Liu, and Sarah Vieweg. 2008. “SiteSeeing” in Disaster: An Examination of On-Line Social Convergence. In Proceedings of the 5th International ISCRAM Conference, 324-333. Washington DC. Java, Akshay, Xiaodan Song, Tim Finin, and Belle Tseng. 2007. Why we twitter. In Proceedings of the 9th WebKDD and 1st SNA-KDD 2007 workshop on Web mining and social network analysis - WebKDD/SNA-KDD '07, 56-65. San Jose, California. doi:10.1145/1348549.1348556. http://portal.acm.org/citation.cfm?doid=1348549.1348556. Jiang, Miao, and William L. McGill. 2010. Human-Centered Sensing for Crisis Response and Management Analysis Campaigns. In Proceedings of the 7th International ISCRAM Conference, ed. Simon French. Seattle. Krishnamurthy, Balachander, Phillipa Gill, and Martin Arlitt. 2008. A few chirps about twitter. In Proceedings of the first workshop on Online social networks, 19-24. Seattle, WA, USA: ACM. Latonero, Mark, and Irina Shklovski. 2010. "Respectfully Yours in Safety and Service”: Emergency Management & Social Media Evangelism. In Proceedings of the 7th International ISCRAM Conference, ed. Simon French. Seattle. Liu, Sophia B., and Leysia Palen. 2010. The New Cartographers: Crisis Map Mashups and the Emergence of Neogeographic Practice. Cartography and Geographic Information Science 37: 69-90. Palen, Leysia, and Sophia B. Liu. 2007. Citizen Communications in Crisis: Anticipating a Future of ICT-Supported Public Participation. In CHI 2007 Proceedings, 727-726. San Jose, USA. 5
AGILE 2011, April 18-22: Frank O. Ostermann, Laura Spinsanti
Smart, P., C. Jones, and F. Twaroch. 2010. Multi-source Toponym Data Integration and Mediation for a Meta-Gazetteer Service. Geographic Information Science: 234–248. Starbird, Kate, and Jeannie Stamberger. 2010. Tweak the Tweet: Leveraging Proliferation with a Prescriptive Syntax to support Citizen Reporting. In Proceedings of the 7th International ISCRAM Conference, ed. Simon French. Seattle.
Sutton, Jeannette, Leysia Palen, and Jeannette Shklovski. 2008. Backchannels on the Front Lines: Emergent Uses of Social Media in the 2007 Southern California Wildfires. In Proceedings of the 5th International ISCRAM Conference, ed. F. Fiedrich and B. Van de Walle, 624632. Washington DC.
6