A Constrained Regression Technique for COCOMO Calibration Vu Nguyen
Bert Steece
Barry Boehm
Computer Science Department University of Southern California 941 W. 37th Pl, SAL 332 Los Angeles, CA 90089, USA +1-323-481-1585
IOM Department University of Southern California 3670 Trousdale Pkwy Los Angeles, CA 90007, USA +1-213-740-4823
Computer Science Department University of Southern California 941 W. 37th Pl, SAL 326 Los Angeles, CA 90089, USA +1-213-740-8163
[email protected]
[email protected]
[email protected]
•
ABSTRACT Building cost estimation models is often considered a search problem in which the solver should return an optimal solution satisfying an objective function. This solution also needs to meet certain constraints. For example, a solution for the estimates coefficients of COCOMO models must be non-negative. In this research, we introduce a constrained regression technique that uses objective functions and constraints to estimate the coefficients of the COCOMO models. To access the performance of the proposed technique, we run a cross-validation procedure and compare the prediction accuracy from different approaches such as least squares, stepwise, Lasso, and Ridge regression. Our result suggests that the regression model that minimizes the sum of relative errors and imposes non-negative coefficients is a favorable technique for calibrating the COCOMO model parameters.
It is crucial that cost estimates be reliable. Inaccurate cost estimates can be disastrous for involved stakeholders. Unrealistic cost estimates lead to the rejection of potential projects, financial losses in investment, and project management problems such as unrealistic resources and schedule allocations. Thus, the software engineering community has put tremendous effort to develop models that can help estimators to generate the accurate cost estimate of a software project. In the last three decades, many software estimation models and methods have been proposed, evaluated, and used [3, 4]. Among these models and methods, COCOMO, SLIM, SEER-SEM (as effort and schedule estimation models) and Function Points Analysis (as a size measurement method) have been widely applied in practice, contributing to the success of software development practice. Achievements in the model development including introducing appropriate functional forms for estimation models and model calibration have potentially improved the accuracy of the cost estimate and impacted software development practice [23]. For example, the COCOMO models provide clear and consistent definitions of processes, inputs, outputs, and assumptions, thus help estimators reason their estimates and generate more accurate estimates than using their intuition.
Categories and Subject Descriptors D.2.9 [Software Engineering]: Cost Estimation; K.6.3 [Software Management]: Software Process
General Terms Measurement, Verification.
Experimentation,
Algorithms,
Economics,
Unfortunately, developing cost estimation models that yield high prediction accuracies is difficult. This reflects the complexity and variability of software development practice. First, software development is driven by a large number of factors such as product requirements and complexity, personnel capabilities, processes, technologies, and environment settings. For example, the COCOMO 81 model uses 16 cost drivers (including the size parameter); the COCOMO II model has 23 parameters to predict effort and time [1, 2]. The large number of parameters can lead to strong collinearity, heteroscedasticity, and highly variable prediction accuracy. The nature and amount of data make analysis difficult. Second, no single model can fit all environments without being adapted or calibrated. Software estimation models are commonly derived from empirical data that are usually collected from various sources. Although they are diversified, they are not generalized well for all types of environments. For example, software estimation research has found that a model calibrated with local data generates better estimation accuracy than does the generic model [2, 5, 24, 25]. Finally, collecting reliable and
Keywords Software cost estimation, COCOMO, calibration, linear regression with constraints, optimization, linear programming, quadratic programming.
1. INTRODUCTION Software cost estimation plays an important role in software engineering practice, often determining the success or failure of contract negotiation and project execution. Cost estimation’s deliverables such as effort, schedule, and staff requirements are valuable information for project formation and execution. They are used as key inputs for • • • • •
stakeholder negotiation and expectations management
project bidding and proposal budget and staff allocation project planning, progress monitoring and control investment decision tradeoff and risk analysis
1
sufficient data for model training and validation is still a challenging task in cost estimation research.
Table 1. COCOMO 81 cost driver values Cost Driver ACAP PCAP AEXP MODP TOOL VEXP LEXP DATA CPLX TURN VIRT STOR TIME RELY SCED
A wide range of modeling approaches has been proposed to overcome these challenges [3, 4]. These approaches may include multiple linear regression (least squares regression, robust regression, etc.), neutral networks, Bayesian analysis, systems dynamics, analogy-based approach, or a hybrid of these. For example in COCOMO II.2000, parameters are estimated using a composite of Bayesian and least squares regression techniques[2]. The performance of the estimation model is commonly evaluated using the mean magnitude of relative errors (MMRE) and prediction level (PRED) which is the percentage of estimates falling within a specified relative error. The main objective of a modeling approach is to find solutions that optimize the MMRE and/or PRED. While many techniques attempt to optimize these criteria, other constraints are often ignored. For example, a model that is reported PRED(0.3) = 80% may yield significantly high relative errors for the remaining 20% of the estimates. Thus, this model may not be reliable. This paper proposes a robust regression technique for calibrating COCOMO models’ parameters by imposing constraints on the model regression. The approach consists of two components: the objective function and the constraint. We use sum of squared errors, sum of absolute errors, and sum of magnitude of relative errors as objective functions; these objective functions have been widely used in the previous studies (e.g., [18, 19]). The constraints imposed include non-negative coefficients and an upper limit of the MRE.
Very Low Low Nominal 1.46 1.19 1.00 1.42 1.17 1.00 1.29 1.13 1.00 1.24 1.10 1.00 1.24 1.10 1.00 1.21 1.10 1.00 1.14 1.07 1.00 0.94 1.00 0.70 0.85 1.00 0.87 1.00 0.87 1.00 1.00 1.00 0.75 0.88 1.00 1.23 1.08 1.00
Very Extra High High High 0.86 0.71 0.86 0.70 0.91 0.82 0.91 0.82 0.91 0.83 0.90 0.95 1.08 1.16 1.15 1.30 1.65 1.07 1.15 1.15 1.30 1.06 1.21 1.56 1.11 1.30 1.66 1.15 1.40 1.04 1.10
Table 2. COCOMO II cost driver values Cost Driver PREC FLEX RESL TEAM PMAT RELY DATA CPLX RUSE DOCU TIME STOR PVOL ACAP PCAP PCON AEXP PEXP LTEX TOOL SITE SCED
We compare the performance of this approach with other regression techniques, including least squares, Lasso, Ridge, and Stepwise regression using a cross validation approach. We find that the proposed regression technique can improve COCOMO models’ performance while providing a way for fixing the problem of negative coefficients. The rest of the paper is organized as follows. Section 2 provides the background information. Section 3 gives an overview of related regression techniques. Sections 4 and 5 describe the proposed technique and research methods for validation. Results and a comparison of the techniques are discussed in Section 6.
2. Background 2.1 COCOMO The Constructive Cost Model (COCOMO 81), a well-known cost and schedule estimation model, was originally published in the text Software Engineering Economics [1]. The model was defined based on the analysis of 63 completed projects from different domains during the 1970s and the early 1980s. To address the issues emerging from changes in technologies and development processes, the USC Center for Systems and Software Engineering has developed and published COCOMO II, a major extension to COCOMO 81. Among the main upgrades are the introduction of new functional forms that use scale factors, new cost drivers, and a set of parameters’ values.
Very Low 6.20 5.07 7.07 5.48 7.80 0.82 0.73 0.81
1.42 1.34 1.29 1.22 1.19 1.20 1.17 1.22 1.43
Low Nominal High 4.96 3.72 2.48 4.05 3.04 2.03 5.65 4.24 2.83 4.38 3.29 2.19 6.24 4.68 3.12 0.92 1.00 1.10 0.90 1.00 1.14 0.87 1.00 1.17 0.95 1.00 1.07 0.91 1.00 1.11 1.00 1.11 1.00 1.05 0.87 1.00 1.15 1.19 1.00 0.85 1.15 1.00 0.88 1.12 1.00 0.90 1.10 1.00 0.88 1.09 1.00 0.91 1.09 1.00 0.91 1.09 1.00 0.90 1.09 1.00 0.93 1.14 1.00 1.00
Very Extra High High 1.24 0.00 1.01 0.00 1.41 0.00 1.10 0.00 1.56 0.00 1.26 1.28 1.34 1.74 1.15 1.24 1.23 1.29 1.63 1.17 1.46 1.30 0.71 0.76 0.81 0.81 0.85 0.84 0.78 0.86 0.80 1.00
In COCOMO 81 & II, the effort model can be written in the following general form p
PM = A * Size B * ∏ EM i
(Eq. 2.1)
i
Where, PM = effort estimate in person months A = multiplicative constant Size = estimated size of the software, measured in KSLOC
2
B = exponential constant (COCOMO I) or scale factors (COCOMO II)
2.3 Model Validation The most important criterion for rejection or acceptance of a cost estimation model is in its ability to predict using new data. Ideally the prediction error of a new cost model is calculated using data from future projects. This approach, however, is usually impossible in practice because new data is not always available at the time the model is developed. Instead, model developers have to use the data that is available to them for both constructing and validating the model. This strategy is usually referred to as crossvalidation.
EM = effort multipliers In COCOMO 81, the B term is an exponential constant which is usually greater than 1.0, indicating diseconomies of scale. In COCOMO II, B is defined as a function of scale factors, in form 5
of
B = β 0 + ∑ β i SFi i =1
The COCOMO 81 model identifies 15 effort multipliers while COCOMO II uses 17 in its Post-Architecture model (see Tables 1 and 2).
While many cross-validation approaches have been proposed, the most common are a simple holdout strategy and a computerintensive method called K-fold cross validation. The holdout approach splits the dataset into to two distinctive subsets: training and test sets. The training set is used to fit the model and the test set provides estimates of the prediction errors. K-fold cross validation divides the data into K subsets. Each time, one of the K subsets is used as the test set and the other K-1 subsets form a training set. Then the average error across all K trials is computed. To obtain the K subsets, we randomly divide the data into a test and training set K different times and repeat this procedure r times. K-fold cross validation avoids the issue of overly optimistic results for prediction accuracy. This technique enables the user to independently choose how large each test set is and how many trials to use average for averaging the results. The variance of the resulting estimate is reduced as K is increased. The disadvantage of this method is that the training algorithm has to be rerun K times resulting in computational effort.
We can transform the COCOMO models into a linear form by applying the log-transform of both sides of the equation (2.1): COCOMO 81: log(PM) = β0 + β1 log(Size) + β2 log(EM1) + … + β16 log(EM15) COCOMO II: log(PM) = β0 + β1 log(Size) + β2 SF1 log(Size) + … + β6 SF5 log(Size) + β7 log(EM1) + … + β23 log(EM17)
2.2 Model Accuracy Measures MMRE and PRED are the most widely used metrics for evaluation of the accuracy of cost estimation models. These metrics are calculated based on a number of actuals observed and estimates generated by the model. They are derived from the basic magnitude of the relative error MRE, which is defined as:
MREi =
yi − yˆi yi
3. Multiple Linear Regression 3.1 Ordinary Least Squares Regression Regression analysis is the most popular technique used to develop software cost estimation models. According to Jorgensen, the majority of software estimation studies use the regression as the major or complementary technique in their modeling process [4].
where yi and yˆ i are the actual and the estimate of the ith observation, respectively. Because yi is log-transformed, we calculate the MREi using
Suppose that a dataset has N observations where the response is effort and p predictors are (e.g., size and cost drivers), p = 23 and N = 161 in the COCOMO II dataset. Let xi = (xi1, xi2,…, xip), i = 1, 2, …, N, be the vector of p predictors, and yi be the response for the ith observation. The model for multiple linear regression is expressed as
MREi = 1 − e yˆi − yi The mean of MRE of N estimates is defined as
MMRE =
1 N
N
∑ MRE i =1
i
yi = β 0 + β1 xi1 + ... + β p xip + ε i
As every estimate is included in calculating MMRE, extreme values of MRE can significantly affect MMRE. To handle this problem, another important criterion used for model evaluation is PRED. PRED(l) is defined as the percentage of estimates where MRE is not greater than l, that is PRED(l) = k/n, where k is the number of estimates with MRE falling within l, and n is the total number of estimates. We can see that unlike MMRE, PRED(l) is insensitive to errors greater than l.
where
β 0 , β1 ,..., β p
(Eq. 3.1)
are the regression coefficients, and εi is the
error term for the ith observation. The corresponding prediction equation of (Eq. 3.1) is
yˆ i = βˆ0 + βˆ1 xi1 + ... + βˆ p xip where
In this research, we report results mainly using PRED(0.3). This measure is considered a standard in reporting COCOMO calibration and model improvement in the previous studies [5, 6, 7]. In addition, to compare the performance of the proposed approach with other investigated techniques in smaller prediction levels, we report PRED(0.1), PRED(0.2), and PRED(0.25). PRED(0.25) is the standard criterion proposed by Conte et al [8] and has been widely used for evaluating the software estimation model in literature (e.g., [9, 11, 19]).
βˆ0 , βˆ1 ,..., βˆ p
(Eq. 3.2)
are the estimates of coefficients, and
yˆi is
the estimate of response for the ith observation. The ordinary least squares (OLS) estimates for the regression coefficients are obtained by minimizing the sum of squared errors. Thus, the response estimated from regression line minimizes sum of squared distances between the regression line and the observed response.
3
size of coefficients. In terms of the equation form, the only difference between the OLS and ridge regression is the constraint
Although regression is a standard method for estimating software cost models, it faces major challenges. The model is frequently overfitted. This occurs when unnecessary predictors remain in the model. With software cost data, some of the predictors are highly correlated. Such collinearity may cause high variances and covariances in coefficients and result in poor predictive performance when one encounters new data. We can sometimes ameliorate these problems by reducing the number of predictor variables. By retaining only the most important variables, we increase the interpretability of the model and reduce the cost of the data collection process. As empirical evidence of this effectiveness, Chen et al. [6] report that the reduced-parameter COCOMO models can yield lower prediction errors and lower variance.
on the coefficients. If
βˆOLS
j
is the estimates of coefficients
produced by the OLS regression, the ridge coefficients are shrunk only when s < s = 0
p
∑ βˆ j =1
2 OLS j
. Thus, s does not affect the
coefficients if it is equal or greater than s0. The Lasso. Lasso regression, introduced by Tibshirani [14], provides a mechanism for the bias-variance tradeoff. As the tuning parameter becomes sufficiently small, some of the model coefficients become exactly zero. The Lasso extends OLS by constraining on the sum of the absolute coefficient estimates to a specified parameter. Let X = xij, i = 1, 2, …, N and j = 1, 2, …, p be the matrix of N observations (rows) on p predictor variables (columns), and y = (y1, y2, …, yN) the N responses.
3.2 Other Regression Techniques To understand the effect of eliminating coefficients from the model, we compare our techniques with standard subset selection and shrinkage techniques; these include forward stepwise selection, Lasso, and Ridge. We choose these techniques because they represent a set of techniques that are widely used for model selection and shrinkage in machine learning and cost estimation research community.
The Lasso estimates the regression coefficients β = (β1, β2,…, βp) by minimizing
S ( βˆ ) =
n
p
i =1
j =1
∑ ( yi − ∑ β j xij ) 2 subject to
p
∑β j =1
j
≤t
(Eq. 3.4)
Stepwise subset selection. Subset selection determines a set of predictor variables that are most relevant to predict the response variable. Assume that there are p predictor variables, the number of choices for selecting a subset is potentially 2p. For example because COCOMO II uses 23 parameters, there are 223 possible subsets to choose from. It is computationally inefficient to consider all choices in order to select the most relevant subset. Many strategies for choosing a subset without exploring all possible choices have been introduced. Of these, forward and backward stepwise selection, and leaps and bounds are the most widely applied ones [12].
where, t ≥ 0 is a tuning parameter that determines the amount of coefficients shrinkage. The smaller the value of t, the smaller the absolute values of coefficients. Decreasing the parameter t to a sufficiently small value shrinks the coefficients towards zero with some of the coefficients becoming zero. Unlike the subset selection technique where the predictors are either eliminated or retained – a discrete process, the Lasso performs the shrinkage and selection process continuously.
We choose forward selection strategy for our comparison purposes. In R we use step() function which uses Akaike Information Criterion (AIC) statistic as the criterion for selecting a relevant variable [21]. The following describes the forward selection procedure:
∑x
Note that the predictors are standardized to have unit standard deviation and mean zero, and the response has mean zero. n
i=1
p
i =1
i
− β 0 − ∑ xij β j ) 2 subject to j =1
p
∑β j =1
2 j
i=1
2 ij
=1, and
n
∑y = 0 , i=1
i
j = 1, 2, …, p.
(Eq. 3.5)
4. Constrained Multiple Regression As above-discussed, ordinary least squares regression, subset selection, and shrinkage methods attempt to minimize the sum of squared errors. While these techniques use the same objective function, they enforce different constraints. The OLS applies no constraints while estimating the coefficients. Subset selection techniques apply constraints on the order of addition of variables into the model and use various criteria such as AIC, F-test, or BIC to evaluate the goodness of the addition. The Lasso and ridge regression techniques impose a penalty on the size of the coefficients.
Ridge. Ridge regression, proposed by Hoerl and Kennard [14], seeks to address the issue of collinearity. In the ridge regression, the coefficients are shrunk by constraining their size. The model estimates coefficients by minimizing N
n
∑x
For each parameter t, a quadratic programming technique can be applied to compute the estimates of regression coefficients βj in the equation. Efron et al. [15] introduced an efficient technique called least angle regression (LARS) to generate a sequence of Lasso solutions for all values of t. We use the LARS algorithm that was implemented and delivered as a package in R.
Step 2. Sequentially add a variable to the subset selected in Step 1 if this variable produces the largest decrease in AIC. The procedure stops when all variables are selected, or when no variable produces a decrease in AIC. Instead of searching for 2p subsets, the procedure only considers a few subsets and when the addition of a new variable cannot decrease the value of AIC.
∑ (y
= 0,
To minimize the prediction error, Tibshirani [13] suggested three methods to choose the Lasso parameter t, including crossvalidation, generalized cross-validation, and an analytical unbiased estimate of risk. In this research, we apply crossvalidation to select t value at which the cross-validation error reaches the minimum.
Step 1. With the intercept included, find the first subset that is most highly correlated with the response variable. This search corresponds to choosing the variable that gives smallest AIC value.
S ( βˆ ) =
ij
≤ s (Eq. 3.3)
where, s is a tuning parameter that specifies the amount of shrinkage. A decrease in s results in a decrease in the absolute
4
We will now examine three selected constrained regression models. These models are based on MSE, MAE, and MRE techniques that have been well investigated and applied to building or evaluating cost estimation model. MSE is a technique minimizing the sum of squared errors, MAE minimizing the sum of absolute errors, and MRE minimizing the sum of relative errors. The models examined include:
The COCOMOII.2000 dataset consists of 161 data points that were used to calibrate the current constants and cost driver rating values. Each data point has 24 attributes including actual effort, actual size, and rating scales of 22 cost drivers (see Table 2). Each cost driver is a categorical variable which has values of VL – Very Low, L – Low, N – Nominal, HI – High, VH – Very High, or XH – Extra High. These symbolic values are stored in the dataset, and they are mapped to numeric scales when calibration is needed.
(1) Constrained Minimum Sum of Squared Errors (CMSE): Minimize
N
∑ ( y − yˆ ) i
i =1
i
2
(Eq. 4.1)
Both datasets were collected from multiple organizations in a variety of domains such as management of information system (MIS), command and control, operating systems, and process control.
subject to MREi ≤ c and βˆ j ≥ 0 , i = 1,…, N , j = 0,…, p (2) Constrained Minimum Sum of Absolute Errors (CMAE): Minimize
N
∑ y − yˆ i =1
i
i
As the paper proposed and validated a technique for calibrating the COCOMO model cost drivers and the constants, we did not consider introducing new drivers. We, therefore, validated and compared the investigated techniques using these datasets as a whole.
(Eq. 4.2)
subject to MREi ≤ c and βˆ j ≥ 0 , i = 1,…, N , j = 0,…, p
Table 3. Summary statistics of effort and size
(3) Constrained Minimum Sum of Relative Errors (CMRE): Minimize
N
∑ i =1
yi − yˆi yi
Dataset COCOMO 2000 (N = 161 data points)
(Eq. 4.3)
subject to MREi ≤ c and βˆ j ≥ 0 , i = 1,…, N , j = 0,…, p
βˆ0 , βˆ1 ,..., βˆ p
an optimization problem. The equation (Eq. 4.2) is a quadratic programming problem, and the equations (Eq. 4.1) and (Eq. 4.3) can be transformed to a form of the linear programming. A procedure for this transformation is discussed in Narula and Wellington [16]. In this study, we use quadratic and linear programming solvers (quadprog1 and lpSolve2) provided in R statistical packages to estimate the coefficients.
5.33
9.34
1.55
46.92 130.90 1292.80 236.23
0.96
3.85
3.98
98 683.32 4.58
6.53
25
77.20
3.22
4.35
7.16
1.28
11400 1821.58 9.34
7.51
1150 168.50 7.05
5.13
The experiment started with converting and linearizing the two datasets. To convert the symbolic values for cost drivers, we used the values in Table 1 (originally published in Boehm [1]) and Table 2 (originally published in Boehm et al. [2]). We linearized the COCOMO models by taking the log-transform of the actual effort, actual size, and cost driver numeric values.
Our motivation for constraining MRE and coefficients stemmed from two observations (1) a model is less reliable if it yields excessively high errors even if its overall MMRE is within an acceptable range (2) common regression techniques such as ordinary least squares may produce counter intuitive results for the estimated coefficients of some models [5]. For example in the COCOMO models, one or more estimates of coefficients may be negative (e.g. RUSE).
We used the R statistical packages for computation. CMSE coefficients were estimated using the quadratic programming solver, quadprog, CMAE and CMRE were transformed to a linear programming problem and solved using the lpSolve package. Although these models can be solved by a general optimization solver provided in R such as optim or constrOptim, the quadratic and linear programming techniques solve these models more efficiently.
We tested the technique using two datasets, COCOMO 81 and COCOMOII.2000. The COCOMO 81 dataset was used to define COCOMO 81 model; this dataset was also published along with the COCOMO 81 model definitions in Boehm [1]. The dataset has 63 data points, each capturing actual effort, actual size, and 15 cost factors or cost drivers (see Table 1).
http://cran.r-project.org/web/packages/lpSolve/index.html
Size (KSLOC) 2.60
5.27
5.2 Experimental Design
5.1 Datasets
http://cran.r-project.org/web/packages/quadprog/index.html
1.79
Max StDev 11400 1519.30
Table 3 summarizes the statistics of ratio-scale variables effort and size of the two datasets. A large ratio between the maximum and minimum values of the effort suggests that log transformation is reasonable.
5. Methods
2
Log Effort
COCOMO Effort (PM) 5.9 81 Log Effort 1.77 (N = 63 data points) Size (KSLOC) 1.98 Log Size 0.68
in (Eq. 4.1), (Eq. 4.2), and (Eq. 4.3) is
1
Min Median Mean 6 195 711
Log Size
Where, c ≥ 0, the turning parameter, controls the upper bound of MRE for each estimate. Estimating
Variable Effort (PM)
We used ten-fold cross validation procedure to compute MMRE, PRED, and standard deviations of these metrics. For COCOMO 81, the dataset of 63 observations is divided into 10 parts, each having 6 projects. Thus, the data was split into a 57-observation training set and a 6-observation test set. For COCOMOII.2000,
5
PRED(0.3) obtained by adjusting different values of the MRE constraint. The MRE and coefficients constraints were both present in the calculation.
which consists of 161 data points, the training size of 145 and test size of 16 were used. The ten-fold cross-validation procedure that we followed consists of three steps:
Table 4. Non-cross validation statistics for the techniques on COCOMOII.2000
Step 1. Randomly split the dataset into K subsets
CMSE
Step 2. For each i = 1, 2, …, K:
At Step 2, MMREi is calculated as
y j − yˆ* j 1 ∑ P j =1 yj P
Where, P is the number of observations in the ith subset,
CMRE
Max. MRE (c) MMRE PRED MMRE PRED MMRE PRED
• Build the model with the ith subset of the data removed • Predict effort for observations in the ith subset • Calculate MMREi and PRED(l)i for the ith subset. Step 3. Repeat the steps 1 and 2 for r times.
MMREi =
CMAE
+ infinity
0.23
0.78
0.22
0.81
0.21
0.78
1.2
0.23
0.78
0.21
0.81
0.21
0.80
1.0
0.23
0.76
0.21
0.77
0.21
0.77
0.8
0.23
0.72
0.22
0.73
0.21
0.75
0.6
0.24
0.68
0.25
0.65
0.23
0.70
0.5 Infeasible
yˆ* j
is
Table 5. Non-cross validation statistics for the techniques on COCOMO 81
the estimate of the jth observation in the ith subset, and l = 0.3, 0.25, 0.2, and 0.1.
CMSE
For r repetitions, we obtained r MMRE and PRED(l) values to calculate their means and standard deviations. Since we used R statistical language to automate the procedure above, r can be chosen large enough to produce a large sample of MMRE and PRED(l). By trying different r values, we found that the means and standard deviations of MMRE and PRED(l) are virtually unchanged when r = 15 or higher. With r = 15 and K = 10, the number of test subsets used was 150, which is equal to the number of models constructed using training subsets during the cross-validation process. This number is much larger than 15 test subsets used in [5] and 30 test subsets in [6].
CMAE
CMRE
Max. MRE (c) MMRE PRED MMRE PRED MMRE PRED + infinity
0.30
0.62
0.29
0.65
0.30
0.68
1.2
0.30
0.65
0.28
0.65
0.28
0.62
1.0
0.30
0.62
0.29
0.62
0.29
0.59
0.8
0.30
0.58
0.29
0.60
0.30
0.59
0.6 Infeasible The first columns in Tables 4 and 5 show the values of the MRE constraint in increasing order; it also specifies the upper bound of MRE errors that the resulted model may produce. The first row in each table shows the MMRE and PRED(0.3) results generated by the models when the c is set to positive infinity (e.g., the MRE constraint was omitted). The last row, which has c value of 0.5 (COCOMOII.2000) and 0.6 (COCOMO 81), indicates that all three techniques cannot find a solution for estimates of coefficients. A smaller c value causes the regression infeasible.
We generated cross-validated prediction accuracy of the techniques on the COCOMO 81 and COCOMOII.2000 datasets. For each of these techniques, we applied the cross-validation procedure to produce MMRE, PRED(0.3), PRED(0.25), PRED(0.2), and PRED(0.1). We employed different approaches to compare the accuracy of the techniques. First, we used the boxplot to show the distribution of mean and its variance of PRED(0.3) results produced by the different techniques. Using the boxplot for visualizing and comparing residuals is recommended by Pickard et al. [17]. They suggest that the boxplot is a useful technique to compare residuals from different models. Second, we ran multiple tests on MMRE to check the level of significance in differences between techniques. Given the data that is normally distributed, the test of statistically significant differences between techniques can be performed using t-test. MMRE values, however, are heavily skewed toward zero, causing the normality assumption irrelevant. Instead, we used Mann-Whitney U hypothesis test. The level of significance chosen was 0.05.
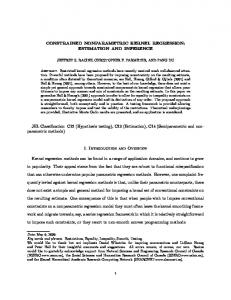
It is clear that deceases in c occur at the expense of PRED. In other words, a decrease in c generally results in a decrease PRED(0.3), but the MMRE value is virtually the same. In addition, the decreasing pace of PRED(0.3) is much slower than that of c. Considering CMSE on COCOMO II.2000, when c changed from 1.2 to 0.6 (50% decrease), the PRED(0.3) reduced from 0.78 to 0.68 or only 12.8%. This result can be seen that while the techniques attempt to fit the regression line to outliers, they generally do not increase the estimation errors of nonoutliers. When we increased c to positive infinity, however, the PRED(0.3) values did not increase accordingly. They are closely the same as those with c = 1.2. Furthermore, the PRED(0.3) values did not change if c is greater than 1.2, indicating the c value at which PRED(0.3) converged.
6. Results
In comparison with OLS, considering c = 1.0, CMAE returned relatively the same PRED(0.3) result (0.81) as did OLS (0.78) while keeping a smaller maximum of MRE (1.0) versus OLS (1.23). The similar improvement was also obtained on COCOMO 81: CMAE’s PRED(0.3) (0.62) versus OLS (0.62), and the maximum of MRE (1.0) versus OLS (2.13).
6.1 Non-cross Validation Results As we wanted to know how well CMSE, CMAE, and CMRE can fit the datasets, we generated MMRE and PRED results using all data points available in a dataset for both training and testing. Tables 4 and 5 summarize the accuracy measures MMRE and
6
the mean values of 0.68 – 0.70 for COCOMOII.2000 and 0.48, 0.49 for COCOMO 81. CMSE, CMAE, and CMRE generated the mean PRED(0.3) in a higher range, 0.72 – 0.75 for COCOMOII.2000, and 0.50 – 0.56 for COCOMO 81. There is no significant difference found in the standard deviation values among the techniques.
The imbalance of the change in PRED and c suggests an important point to consider. As PRED is more resistant to change when c decreases, we can give up some accuracy in PRED to fit the model that generates much lower estimation errors. Applying the MRE constraint gave an effective way to handle estimates whose MRE errors are outside the scope of PRED(0.3). It is worthy to analyze the mean and standard deviation of the large MRE values greater than 0.3. Considering the MRE constraint c = 0.8 on the COCOMO II.2000 dataset, CMSE, CMAE, and CMRE produced approximately the same mean and standard deviation, 0.5 and 0.16, respectively, noticing that none of the estimates having MRE errors over 0.8. These results indicate significant improvements in comparison with OLS where 0.60 and 0.24 yielded for the mean and standard deviation, and the number of estimates having MRE errors greater 0.8 is 7. Large estimation errors found in OLS were effectively reduced by the MRE constraint while the PRED(0.3) was comparable to that of OLS.
Table 6. PRED(0.3) statistics for the techniques COCOMOII.2000 Technique
COCOMO 81
Mean Median StDev
Mean Median StDev
Lasso
0.68
0.68
0.11
0.48
0.48
0.19
Ridge
0.70
0.70
0.10
0.49
0.49
0.21
Stepwise
0.69
0.69
0.11
0.48
0.48
0.19
OLS
0.70
0.70
0.10
0.49
0.48
0.19
CMSE
0.72
0.73
0.11
0.50
0.49
0.18
CMAE
0.74
0.75
0.11
0.53
0.54
0.18
CMRE
0.75
0.75
0.11
0.56
0.56
0.19
PRED(0.3)
0.8
Table 7. MMRE for the techniques
0.7
COCOMOII.2000 CMSE
0.6
0.5
Technique
0.6
0.8
1 c values
Median StDev
Mean Median StDev
CMAE
Lasso
0.29
0.19
0.33
0.43
0.29
0.52
CMRE
Ridge
0.28
0.18
0.29
0.44
0.30
0.53
Stepwise
0.29
0.19
0.29
0.46
0.30
0.58
OLS
0.28
0.18
0.28
0.43
0.29
0.53
CMSE
0.28
0.18
0.28
0.42
0.28
0.53
CMAE
0.27
0.17
0.27
0.42
0.28
0.56
CMRE
0.26
0.16
0.27
0.39
0.26
0.55
0.4 0.4
Mean
COCOMO 81
1.2
1.4
Figure 1. PRED(0.3) versus c values on COCOMOII.2000
6.2 Cross Validation Results If we consider the goodness of fit, the results obtained above indicate that c = 1.0 is a relevant value of the MRE constraint. As we consider the prediction capability of the models, however, this value may not be relevant because training and testing sets do not include all data points. To determine the best c value, we applied the cross-validation procedure on different c values and selected the value that produced the best and stable PRED(0.3) result. Figure 1 shows PRED(0.3) results obtained by CMSE, CMAE, and CMRE versus c on the COCOMO.2000 dataset. These techniques generated the best PRED(0.3) value when c ≥ 1.0, suggesting that c = 1.0 is an appropriate value. Similarly, c = 1.2 is the selected value that generates the highest PRED(0.3) on the COCOMO 81 dataset. These MRE constraint values were used to generate MMRE and PRED in the cross-validation procedure.
Table 8. PRED(0.1), PRED(0.2), and PRED(0.25) values COCOMOII.2000
Tables 6 and 7 summarize the performance measures MMRE and PRED(0.3) obtained on each technique using ten-fold crossvalidation. For each of the 15 repetitions, we divided the dataset into 10 parts, each returning one value of PRED(0.3). Therefore, the mean, median, and standard deviation of PRED(0.3) were calculated from a set of total 150 individual PRED(0.3) values. The MMRE statistics were obtained from 2415 estimates on the COCOMOII.2000 dataset and 915 estimates on the COCOMO 81 dataset.
COCOMO 81
Technique
10%
PRED 20%
25%
10%
PRED 20%
25%
Lasso
0.30
0.53
0.62
0.19
0.34
0.41
Ridge
0.31
0.55
0.63
0.16
0.32
0.41
Stepwise
0.31
0.54
0.63
0.15
0.31
0.40
OLS
0.33
0.56
0.63
0.18
0.33
0.41
CMSE
0.34
0.55
0.64
0.19
0.36
0.43
CMAE
0.36
0.59
0.69
0.16
0.33
0.41
CMRE
0.38
0.59
0.67
0.19
0.36
0.45
We observed similar performance patterns with PRED(0.1), PRED(0.2), and PRED(0.25) as CMSE, CMAE, and CMSE produced highest values except PRED(0.1) and PRED(0.2) generated by CMAE as shown in Table 8. CMAE and CMRE are best in all PRED values except PRED(0.1) and PRED(0.2) of CMAE. The performance of CMRE and CMAE is consistent across PRED measures.
The summary values of the mean PRED(0.3) obtained by Lasso, Ridge, Stepwise, and OLS are virtually the same on both datasets: 7
0.54 on COCOMO 81) while maintaining low variance (StDev ≤ 0.01 on COCOMOII.2000 and StDev ≤ 0.03 on COCOMO 81).
The MMRE results shown in Table 7 give another view on the performance of the techniques. While PRED(0.3) mean values can be seen in two distinctive ranges, there is no clear range of MMRE mean values seen on COCOMOII.2000. MMRE values are lowest across the CMRE row. All the techniques produced high variance in MMRE on the COCOMO 81 dataset (StDev ≥ 0.52).
6.3 Statistical Significance Although the results show differences in the mean values of MMRE, we cannot naively claim the superiority of one technique to another because MMRE and PRED(0.3) have high variance. Instead of just looking at the mean values, we used MannWhitney U hypothesis test to check the statistical significance of the differences. We tested the MMRE values obtained from the cross-validation procedure for each technique against the values generated by another technique. Multiple comparisons were made to test the general hypothesis that the MMRE values are different between techniques (0.05 confidence level used).
As shown in Table 6, on the COCOMOII.2000 dataset, the lowest and highest mean values of PRED(0.3) are 0.68 and 0.75, respectively; this range falls well within one standard deviation (±0.11). To provide a clearer view of the differences in the mean between techniques, we computed the mean value of PRED(0.3) for each of the 15 iterations and visualized these mean values using the boxplot.
Table 9 summarizes test results on the two datasets. The first column shows the pairs of techniques under comparison, and the other columns show the range of p-values of the corresponding comparisons. Although there is one p-value obtained for each comparison, the table only shows the lowest p-value (if p-value > 0.05) or the highest p-value (if p-value ≤ 0.05). For example, the second row has two pairs of comparison, CMSE versus Ridge and CMSE versus OLS, and these pairs have the lowest p-value of 0.10. The first row indicates that there is no significant difference found in MMRE among Lasso, Ridge, Stepwise, and OLS techniques (p > 0.11). The next two rows show the mixed results on the performance of CMSE: CMSE does not perform better than Ridge and OLS on the datasets (p > 0.10), and it does not outperform Lasso and Stepwise on COCOMO 81 (p > 0.05) but on COCOMOII.2000 (p < 0.02). This inconsistent performance of CMSE implies that MSE as an objective function appears to be more dependent on data used than MRE and MAE.
Figure 2. Boxplot of mean of PRED(0.3) on COCOMOII.2000
Table 9. Statistical significance of the differences between techniques using MMRE Test
COCOMOII.2000 COCOMO 81
Among Lasso, Ridge, OLS, Stepwise.
p > 0.11
p > 0.15
CMSE and {Ridge, OLS} p > 0.10
p > 0.10
CMSE and {Lasso, Stepwise}
p < 0.02
p > 0.05
CMAE and {Lasso, Ridge, OLS, Stepwise}
p < 10-3
p < 0.02
CMRE and {Lasso, Ridge, p < 10-4 OLS, Stepwise}
p < 10-4
It is clear that CMAE and CMRE outperform the other techniques as shown in the last two rows of Table 9. CMRE is the best performer on both datasets (p < 10-4). An explanation for this difference may be on the different objective functions used. CMAE and CMRE use MAE and MRE as objective functions, respectively, while the other techniques use MSE. Among these objective functions, MSE gives greatest weight to large projects because squared errors of large projects are often larger than those of small projects. By using MRE as the objective weight, MRE gives the same weight to small and large projects. The weight given by MAE is somewhere between those of MSE and MRE as
Figure 3. Boxplot of mean of PRED(0.3) on COCOMO 81 Figures 2 and 3 show 1st quartile, median, 3rd quartile, and outliers of the mean values of PRED(0.3). As the boxplots in Figures 2 and 3 indicate, the mean values of PRED(0.3) have low variance overall: on COCOMOII.2000, StDev ≤ 0.02; on COCOMO 81, StDev ≤ 0.05. On both datasets, OLS gave highest variance in the mean values of PRED(0.3): on COCOMOII.2000, StDev = 0.05; on COCOMO 81, StDev = 0.02. CMRE had highest means (≥ 0.74 on COCOMOII.2000 and ≥
8
evidenced in the study by Shepperd and Kadoda [20] and also in our study. As shown in Table 10, CMRE outperforms MRE on the COCOMO 81 dataset but not on the COCOMOII.2000 dataset.
MAE gives less weight to large projects and relatively more weight to small projects. How do these techniques perform if the constraints are dropped? To answer this question, we tested the hypothesis that CMSE, CMAE, and CMRE do not affect the results if the constraints are abstained. When the constraints are dropped, CMSE, CMAE, and CMRE become MSE, MAE, and MRE respectively. Dropping the MRE constraint corresponds to using a large value of c or c = +infinity. We ran the cross-validation procedure to obtain MMRE values. These values were tested against the MMRE values generated by the techniques with the constraints. Table 10 summarizes the p-values of every comparison using the datasets.
The idea of constraining parameters in the multiple linear regression is not new. The technique of imposing a penalty on coefficients has been proposed and applied in statistics literature such as the Ridge and Lasso regression techniques. Unlike subset selection where variables are either retained or discarded, shrinkage techniques are a continuous process in which coefficients associated with variables are all together adjusted to search for an optimum while maintaining specified constraints. This process potentially does not suffer much variability as does the subset selection process.
Table 10. p-values for the statistical difference between the constrained and unconstrained techniques Test
COCOMOII.2000
COCOMO 81
CMSE and MSE
0.16
0.10
CMAE and MAE
0.25
10-7
CMRE and MRE
0.26
10-7
Many previous studies have proposed techniques for calibrating the COCOMO models. Among these techniques, Chulani et al. [5], Chen et al. [6], and Menzies et al. [7] use either COCOMOII.2000 or COCOMO 81 datasets or both. Chulani et al. proposed the use of a combination of Bayesian analysis and least squares regression to calibrate the COCOMO II model. Their cross-validation prediction error is PRED(0.3) = 0.69, which is close to the OLS value but lower than CMSE, CMAE, and CMRE values found in our cross-validation results shown in Table 6. Chen et al. and Menzies et al. employed techniques such as subset selection using WRAPPER [22] to select the best subsets for each dataset; they use the holdout estimate as a procedure to validate the model. They report improvements in PRED(0.3): 0.76 on COCOMOII.2000 and 0.50 on COCOMO 81 as compared to our results of 0.75 and 0.55 respectively. Unlike our constrained regression technique, their approaches use OLS to estimate the coefficients of the retained variables; some coefficient estimates may be negative, and thus special treatments (such as using the Bayesian analysis [5]) are needed to handle this problem.
As Table 10 shows, there is no evidence to differentiate the results from CMSE and MSE techniques on the datasets (p > 0.05). For COCOMOII.2000, the similar result can also be observed: there was no sufficient evidence to indicate the affect of the constraints on the results. However, for COCOMO 81, a significant difference between constrained and un-constrained techniques (CMAE versus MAE and CMRE versus MRE) was verified (p < 10-7). CMAE and CMRE outperformed MAE and MRE respectively on one-sided Mann-Whitney U test (p < 10-4).
7. Discussion and Conclusion This paper has described a regression technique for developing cost prediction models. We also validated and compared the approach with other regression techniques including OLS, stepwise, Lasso, and Ridge regression. By imposing the coefficient constraint on the regression function, problems associated with counter-intuitive coefficients (such as nonnegative coefficients in the COCOMO models) can be resolved directly. Moreover, for the investigated datasets, the approach provides realizable improvements in prediction accuracy over the other techniques compared.
The COCOMO II.2000 is a generic model, and its rating values and constants were calibrated using the Bayesian analysis approach [5] on the COCOMO II.2000 dataset. The model is relevant to the general software engineering industry as the dataset was collected from projects of various domains in many industries and from multiple organizations. As stated in [2], a dataset should have at least 110 data points to calibrate the coefficients for the five scale factors and the seventeen effort multipliers of the COCOMO II model. Collecting reliable data has been and continues to be one of the most challenging tasks of the modeling process. Thus, few organizations collect sufficient data and locally calibrate the coefficients and the constants of the COCOMO models. In addition, although organizations have their own local version of the COCOMO models, it can be helpful to use the generic model for comparing and verifying the cost estimates.
An advantage of this approach in addition to its favorable estimation accuracy and its ability to eliminate counter-intuitive rating values is that it is simpler and easier to apply than the sophisticated Bayesian analysis approach used in COCOMO II.2000. The equations (Eq. 4.1, Eq. 4.2, and Eq. 4.3) can be resolved easily using optimization solvers available in standard statistical packages and software such as R, SAS, S-PLUS, and MATLAB.
The approach can be used to calibrate both generic COCOMO models using the general dataset and local COCOMO models using the organization-specific or domain-specific dataset. For practitioners, it is an alternative to the calibration techniques suggested by COCOMO II text [2] to build a COCOMO-like model in their organizations using local datasets. This locally calibrated COCOMO model can better fit their unique situations.
The result indicates that CMRE and CMAE are two favored techniques for calibrating the COCOMO models using two COCOMO datasets. It is worthy noting that OLS (or MSE) technique did not perform well as it is observed in Lokan’s study [19]. In his study, he notes that MSE outperforms MRE as they are used as objective functions. A possible explanation is that different datasets have different influence in prediction models. The impact of dataset characteristics on prediction accuracies is
Although we validated the approach using the COCOMO models, the approach can be easily implemented to other models that may
9
[10] C.F. Kemerer, “An Empirical Validation of Software Cost Estimation Models,” Comm. ACM, vol. 30, no. 5, pp. 416 – 429, May 1987. DOI = http://doi.acm.org/10.1145/22899.22906
have a different linear-regression form. It provides a solution to the problem of building models where constraints are required. Although the results show improvements in the estimation accuracy, this approach must be treated as preliminary. It has some limitations. First, the approach involved using linear and quadratic programming techniques to solve the constrained optimization problem. As searching through the feasible solution space, these techniques may be trapped in a local optimum and return a sub-optimal solution. Second, multiple global solutions exist to satisfy objective functions and constraints. Thus, multiple estimates of coefficients exist; this causes inconsistent effects of model parameters on the effort. Finally, even if our results have shown that the proposed approach is preferred on the COCOMOII.2000 and COCOMO 81 datasets, it might not perform well on other datasets.
[11] A.R. Gray and S.G. MacDonell, “A comparison of techniques for developing predictive models of software metrics,” Information and Software Technology 39 (1997), pp. 425–437 [12] A. Miller, “Subset Selection in Regression,” 2nd ed., Chapman Hall, 2002. [13] R. Tibshirani. “Regression shrinkage and selection via the lasso,” Journal of the Royal Statistical Society: B, 58 (1996), pp. 267-288. [14] A.E. Hoerl and R.W. Kennard, "Ridge Regression: Biased Estimation of Non-orthogonal Problems," Technometrics, Vol. 12, No. 1 (1970), pp. 55-67.
Several directions for our future work can be seen. We would like to validate the approach using publicly available datasets (e.g., in Menzies [7]) and compare with other techniques such as neutral networks and other robust regression techniques. We would also like to use other search algorithms such as genetic programming [9] and apply constraints on other objective functions including MdMRE (Median MRE) and Z measure [26].
[15] B. Efron, T. Hastie, I. Johnston & R. Tibshirani. “Least angle regression,” Annals of Statistics, 32 (2004), pp. 407-499. [16] S.C. Narula, J. F. Wellington, “Prediction, Linear Regression and the Minimum Sum of Relative Errors,” Technometrics, Vol. 19, No. 2, 1977 [17] L. Pickard, B. Kitchenham, and S. Linkman, “An Investigation Analysis Techniques for Software Datasets,” Proc. Sixth IEEE Int'l Software Metrics Symp., 1999, pp. 130-142.
8. ACKNOWLEDGMENTS We would like to thank Julie Sanchez for review and providing comments on the early versions of this paper.
[18] C. Burgess and M. Lefley. “Can genetic programming improve software effort estimation? A comparative evaluation,” Information and Software Technology, 43(14):863–873, December 2001.
9. REFERENCES [1] B.W. Boehm, “Software Engineering Economics,” Prentice Hall, 1981. [2] B.W. Boehm, E. Horowitz, R. Madachy, D. Reifer, B. K. Clark, B. Steece, A. W. Brown, S. Chulani, and C. Abts, “Software Cost Estimation with COCOMO II,” Prentice Hall, 2000.
[19] C. Lokan, “What Should You Optimize When Building an Estimation Model?” Proc. 11th IEEE Int'l Software Metrics Symp., 2005, pp. 34-.
[3] B.W. Boehm, C. Abts, S. Chulani, “Software development cost estimation approaches: A survey,” Annals of Software Engineering, 2000.
[20] M. Shepperd, G. Kadoda, “Using Simulation to Evaluate Prediction Techniques,” Proc. 7th IEEE Int'l Software Metrics Symp., 2001, pp. 987-998.
[4] M. Jorgensen , M. Shepperd, “A Systematic Review of Software Development Cost Estimation Studies,” IEEE Transactions on Software Engineering, v.33 n.1, p.33-53, January 2007
[21] S. Weisberg, “Applied Linear Regression,” 3rd ed., John Wiley & Sons, 2005 [22] R. Kohavi and G.H John, “Wrappers for Feature Subset Selection,” Artificial Intelligence, Vol. 97, No. 1-2, pp. 273324, 1997
[5] S. Chulani, B. Boehm, and B. Steece, “Bayesian analysis of empirical software engineering cost models,” IEEE Transactions on Software Engineering, vol. 25 n.4, pp. 573583, July/August 1999.
[23] B.W. Boehm, R. Valerdi, “Achievements and Challenges in Software Resource Estimation”, USC CSSE Technical Report, No.USC-CSE-2005-513, 2005. http://sunset.usc.edu/csse/TECHRPTS/2005/usccse2005513/usccse2005-513.pdf
[6] Z. Chen, T. Menzies, D. Port, and B. Boehm. “Finding the right data for software cost modeling,” IEEE Software, Nov 2005, pp. 38-46. [7] Menzies, T., Chen, Z., Hihn, J., Lum, K., “Selecting Best Practices for Effort Estimation,” IEEE Transactions on Software Engineering, 2006
[24] D. Ferens and D. Christensen. Calibrating software cost models to Department of Defense Database: A review of ten studies. Journal of Parametrics, 18(1):55–74, November 1998.
[8] S.D. Conte, H.E. Dunsmore, V.Y. Shen, “Software Engineering Metrics and Models,” Menlo Park, Calif.: Benjamin/Cummings, 1986.
[25] M. Shepperd and C. Schofield, “Estimating software project effort using analogies,” IEEE Transactions on Software Engineering, Vol. 23, No. 12, pp. 736-743, November 1997.
[9] J.J. Dolado, “On the problem of the software cost function,” Information and Software Technology 43 (2001), pp. 61 – 72
[26] B. Kitchenham, L. Pickard, and S. MacDonell. “What accuracy statistics really measure.” IEE Proceedings – Software, 148(3), pp. 81–85, June 2001.
10