versatile traffic monitoring software such as protocol analyzers, protocol dissectors, traffic sniffers, traffic characterizers and IDSs. (Intrusion Detection Systems).
A cooperative PC/Network-Processor architecture for multi gigabit traffic analysis D. Ficara, S. Giordano, F. Oppedisano, G. Procissi, F. Vitucci Department of Information Engineering, University of Pisa via G. Caruso, 16 - 56122 Pisa, Italy (d.ficara, s.giordano, f.oppedisano, g.procissi, f.vitucci)@netserv.iet.unipi.it
Abstract— The extensive availability of cost effective commodity PC hardware pushed the development of flexible and versatile traffic monitoring software such as protocol analyzers, protocol dissectors, traffic sniffers, traffic characterizers and IDSs (Intrusion Detection Systems). The largest part of these pieces of software is based on the well known libpcap API, which in the last few years has become a de facto standard for PC based packet capturing. Many improvements have been applied to this library but it still suffers from several performance flaws that are due not to the software itself but rather to the underlying hardware bottlenecks. In this paper we present a new traffic monitoring device, implemented by an Intel IXP2400 Network Processor PCI-X card connected to a gigabit ethernet LAN hosting a cluster of common personal computers running any libpcap based application. This architecture outperforms the previous solutions in terms of packet capturing power and timestamp accuracy.
I. I NTRODUCTION AND M OTIVATIONS In the last few years, the availability of flexible, easy to use and easy to customize network monitoring software, has proposed the PC as a suitable platform for network monitoring and testing. Application such as tcpdump [3], wireshark [1], ntop [2] etc., prove to be very effective and flexible for large a variety of monitoring tasks. Most of these pieces of software are based on the well known libpcap API [3], which in the last few years became a de facto standard for PC based packet capturing. Many improvements have been applied to this library [5] [6] but it still suffers from performance flaws; these flaws are not generated by the software itself but by underlying hardware bottlenecks [7] [8]. All theapplications we mentioned are often used together with high-end PCs to capture, analyze and characterize traffic from high-speed links; in all these cases, their main weakness is evident: low performance. Traffic traces produced by such a combination of hardware and software suffer from two types of uncertainty: 1) Packet timestamps: to sustain a high packet rate, the PC must drive interface cards by polling and this results into poor timestamp accuracy; 2) Packet loss: packet loss can be experienced if either the packet rate is too high and the host CPU cannot allocate/release memory for packets or if the system bus cannot keep the pace of the incoming data. Moreover, only off-line computing often can be performed on packets since no extra CPU power is left for on-line analysis (all the CPU time is used for capturing) [7] [8].
This poor performance is mainly due to the lack of packet computing capabilities on the network interface cards which commonly equip commodity PCs: these interface cards are uncapable of either timestamping the arrival of a packet (avoiding interrupt latency) or to filter out unwanted packets (avoiding memory allocation/release for unwanted packets) or to feed the host PC with only a fragment of the packet instead of the entire one (avoiding system bus saturation). The research described in this paper proposes an architecture to combine the flexibility of general purpose PCs (equipped with libpcap based applications) with the power of Network Processors (NPs) of the Intel IXP2XXX family (see section III). The target is a powerful system capable of capturing packets on GigaEthernet links with good timestamp accuracy. Other research efforts recognize the effectiveness of exploiting Network Processor based devices in aid to common hardware for monitoring purposes. Xinidis et al. [9] propose an active splitter based on Intel IXP1200 for filtering traffic directed to the sensors of a Network Intrusion Detection or Prevention System (NIDS/NIPS). In their scheme, the NP applies Early Filtering techniques and then it forwards traffic to different sensors, according to Locality Buffers or hash load balancing. In [10], Wolf et al. propose to use a distributed architecture, called Distributed Online Measurement Environment (DOME), of passive measurement nodes equipped with Intel IXP2400 NP. Their work includes header anonymization schemes and is compared with Endace DAG 4.3 cards. Both the previous systems achieve, for small packets (64 bytes), a transmission rate of around 500 Mbit/s, while our solution is able to manage up to 1 Gbit/s. Moreover, our system carefully addresses the issue of an accurate packet timestamping. Compared to hardware solutions (e.g. DAG cards), our traffic monitor provides a major number of functionalities and a larger flexibility. For instance the packet classifier we implemented supports 50000 rules, while a DAG card with an integrated 7-rule filter costs more than twice. II. T HE BASIC I DEA AND I SSUES Figure 1 depicts a scenario where the two flow directions of a Gigabit Ethernet optical fiber are both split into two optical signals: the first signal is scattered to an output fiber while the second passes through the splitter. Hence, there are two output fibers, one for each direction. This is the best available way to
1) Timestamping accuracy, in that it is performed by the NP card without the interrupt latency typical of a PC; 2) Heavy CPU offload, as unwanted packets are dropped at the NP level and are not delivered to any PC and since a pre-classification is performed on packets, bringing even more CPU offload (for example in flow identification). At this stage, the main issue of this architecture would be the incompatibility between the proposed batch frame and all the available libpcap-based applications. Next sections describe the implementation design of the entire architecture made up of an NP-side timestamping and classification application and a PC-side kernel space abstraction layer which guarantees the compatibility with any libpcap-based application. III. T HE I MPLEMENTATION D ESIGN
Fig. 1.
Conceptual scheme of the monitoring system.
“copy” network traffic though some others are possible (e.g. configuring port mirroring on layer 2 network devices). The output fibers of the splitter are connected to two of the three optical interfaces (see section III) of a Radisys ENP2611 Network Processor card, while a cluster of PCbased Linux boxes is connected to the third interface via a gigabit ethernet switch. PCs and NP are also connected via a standard 100BaseT Ethernet LAN (the control interface on the NP) supporting a standard TCP/IP connection used to issue configuration commands from user interfaces; therefore every PC on the LAN can issue configuration commands to the NP via a client/server application (the server resides on the NP, while each PC runs an instance of the client). Referring to this scenario, the basic idea behind the proposed architecture is to make the NP board performing at the wire speed (1Gbps: only up or down-stream) the following operations: 1) Packet timestamping: recording the arrival time of each packet in the standard UTC format; 2) Packet classification and filtering: selecting only those packets useful for the user and assigning each packet a unique flow identifier based on a rule set; 3) Header striping: getting only the necessary information (e.g. the first n bytes); 4) Batch frame crafting: collecting data in batch frames, each containing information of several packets; 5) Sending batch frames to commodity PCs belonging to the cluster: using the third port fiber of the NP board. On the PC side, the batch frame is received, dissected, and delivered towards any monitoring application. The main advantages of this architecture are:
The IXP2400 is a fully programmable NP, which implements a high-performance parallel processing architecture on a single chip suitable for processing complex algorithms, detailed packet inspection and traffic management at the wire speed. It combines a high-performance Intel XScale core with eight 32-bit MEv2 microengines (µ-es) which cumulatively provide more than 5.4 giga-operations per second (capable of processing, namely, up to 3.6M packets per second). Each µ-e has eight hardware-assisted (i.e.: zero-overhead context switch) threads of execution. The Intel XScale core is a general-purpose 32-bit RISC processor (ARM Version 5 Architecture compliant) used to manage the NP and to perform slow data path. The XScale processor and the whole set of µ-es run at 600 MHz. Microengines provide the processing power necessary to perform fast data path tasks that would require very expensive high-speed ASICs. The IXP2400 NP is hosted by a third-party board. We adopt the RadiSys ENP-2611 board, equipped with 8 MB of (very fast) SRAM and 256 MB of (less fast) DRAM. This board provides three Gigabit Ethernet optical interfaces and one Fast Ethernet interface for remote control. Moreover it supports MontaVista Linux operating system running on the XScale CPU. The board is plugged into a PCI-X slot of a host PC; this PCI connector is currently used only for power supply (no data communication takes place through it). The main goal of the entire application is to accurately timestamp packets and to classify and extract a configurable portion of them within our IXP2400 NP. The application is made up of an NP-side module and a PC-side module. A complete description of the whole application and its components will be elaborated upon in the next sections. IV. N ETWORK P ROCESSOR SIDE The NP side of our traffic monitor application reflects the IXP processor hierarchy: µ-es are in charge of packet timestamping and classification and batch frame crafting, while the XScale deals with timestamp calibration, classification table setup and update and parameter reconfiguration. The entire NP-side application is depicted in fig. 2: the circles represent rings, which are on-chip circular FIFO queues (used for inter-µ-e communication), the external rectangles
Fig. 2.
Functional scheme of the entire NP-side application.
represent processors, the internal ones represent the pieces of code that implement specific functions. In a µ-e, these pieces are named µ-blocks, while at the XScale level they are called “core components”. White µ-es contain the driver-blocks, directly provided by Intel and strictly hardware-dependent, dealing with low level functionalities. A. Microengines Application Scheme The whole application can be summarized as follows. The RX µ-e (0x00) retrieves packets from interface and puts them in Ring 1. For each packet, the arrival time (actually the arrival time of the first mpacket, cfr. section VI), the entire length and the first n bytes of the packet are recorded. The second µ-e (0x01) classifies the packets it receives from Ring 1 (by assigning them a flow identifier (flowID) between 0 and 216 −1 or by simply dropping them) and sends them to the next µ-e (0x10) which copy all data buffers (each containing flowID, length, timestamp and the first n bytes of a packet) together to create a batch frame (the batch frame format is depicted in fig. 3). Finally, the batch frame is passed to the TX µ-e (0x02) to be sent to one of the PCs belonging to the cluster. The batch frame header has the source address set as the MAC address of the outgoing interface, the destination address set as the MAC address of the correspondent cluster’s PC and the type field set to an unused value (0x9000). As depicted in fig. 3, the payload is built with a variable number of packet digests each made up of all the packet information. The length of the fragment can be different among different flowIDs. The code running on the 0x10 µ-e (batch frame crafting) contains a table with the correspondence between flowID and the MAC address of the PC in charge of processing that flow. At a given time, the application maintains up to one batch frames for each PC of the cluster and each packet digest is copied onto the batch frame correspondent to its flowID. We will not deal with the details of the classification application here, since it has already been published; readers interested in some classifier internals can look at [4]. B. Xscale Application Scheme The XScale processor handles the functionalities concerning timestamp calibration, classification table setup and update and parameters reconfiguration. Moreover, it cares of interfacing
Fig. 3.
Batch frame and packet digest specification.
to the user-side by means of an instance of a client/server application for each PC of the cluster. Timestamp calibration is the operation of resolving the correspondence between the µ-e timestamp, which is a relative time, with the UTC time, which is an absolute time. This correspondence (initial value plus counter frequency) is passed to the PC-side application in order to allow a correct UTC timestamping. Indeed the timestamps provided in the batch frame are 64-bit values of an integrated counter of the NP and must be interpreted correctly by the PC. As far as the classifier configuration concerns, a proper file is generated and passed to module Class table ([4]), which builds the decision-making data structure. The XScale also manages the dynamic reconfiguration of the rule set: this is done through a message exchange between its core components and µ-es [4]. The XScale application is also responsible of setting the desired number n of bytes to be captured for each packet belonging to a given flow and managing the flowID spaces which have to be assigned to the various PCs without collisions. V. PC SIDE The PC-side application is composed by two components. The first is a Linux kernel module which implements a compatibility abstraction layer, while the second is a user space application built by a front-end (user interface) and a back-end which passes user’s configuration commands to the kernel module (via ioctl system calls) and to the NP (via the above mentioned TCP/IP connection established on the Fast Ethernet control interface). A. Kernel space – the compatibility abstraction layer This module acts as a compatibility layer between the NPPC communication protocol (which is simply the batch frame format), and the standard packet processing chain of the Linux kernel on which the libpcap API is based. The module registers itself as a virtual “network layer” capable of processing ethernet frames with the type field equal to 0x9000. The module also creates up to 216 virtual interface cards mon0 to mon65535 (one for each flowID), then implementing an abstraction layer toward the system. Every time a batch frame is received by the kernel, it is steered to this
layer which, in turn, extracts from its payload all the packets together with their timestamp and flowID. For every extracted packet digest, a new correctly timestamped packet is generated and transmitted on the virtual interface indexed by flowID. Hence, a libpcap based application configured to monitor the interface e.g. mon5 (e.g. with the command tcpdump -i mon5) will see all (and only) those packets with flowID 5, as if it was connected directly to the fiber (to which actually the NP is connected). Therefore, this layer makes it possible to instruct the NP to mark an arbitrary micro-flow with a specific flowID, and to analyze this flow by simply connecting an application, such as wireshark, to the corresponding virtual interface. As experimentally showed in section VII, the computational overhead introduced by this piece of code is very low since it is implemented in a zero-copy fashion. Probably, the most important advantage of this abstraction layer is the full compatibility with existent software: packets arrive to the kernel as they were captured on the wire, making unnecessary any modification to applications and libraries. B. User Space – the user interface The user interface is made up of a back-end capable of • configuring the NP classifier via a TCP connection whose peer is the Xscale application; • instructing the NP to capture the desired number n of bytes from every packet (via the TCP connection); • reading the association timestamp-UTC; • configuring the abstraction layer via ioctl system calls. The front-end module simply implements a user-interface from which the user can configure the entire system. VI. T IMESTAMPING The timestamping operation consists of recording the arrival time of each packet. The arrival time is intended as the time ta at which the first bit of the packet reaches the network interface. Unfortunately, packet reception (the action of retrieving packets from the wire to the CPU, which is the first place where timestamping can be performed) is a compound operation: to derive the timestamping accuracy of the system, we need to accurately examine what actually happens whenever a packet arrives at the board. The Gigabit Ethernet interfaces of ENP2611 are controlled by a Sierra PM3386 and a PM3387 Gigabit MAC device (see figure 4). Those devices forward received frames to a FPGA Bridge connected to the Media Switch Fabric (MSF) interface of the IXP2400. The MSF operates in POS-PHY Level 3 (aka SPI-3, aka PL3) mode and splits packets in fixed-sized chunks called mpackets (whose size is configurable as 64, 128 or 256 bytes). To avoid contention on the PM3386, in our application one of the two interfaces connected to this chip is used for transmission, while the remaining one, together with the one connected to the PM3387 chip, is used for packet capturing. At start-up time, all the RX µ-e threads place themselves on a freelist (RX FREELIST), thus stating they are ready to handle a new mpacket. Each time the MSF receives an mpacket, it
Fig. 4.
Hardware packet receiving chain.
awakes the first thread in the list and delivers the data to it. Then RX threads gather the set of incoming mpackets from MSF and merge them, thus reassembling original packets. A. Time Budget When dealing with timestamp operation, the main concern is the jitter of the delay each stage introduces (a fixed and known amount of delay between the real and measured time can be simply subtracted to the measure). In the following, we will show that the delay between the arrival time and the timestamp operation is almost constant on the ENP2611. Both the PM3386 controller and the SPI-3 bridge forward incoming frames as soon as a certain amount of bytes (hereafter we will call it the “forwarding threshold”) is received. This threshold can be configured to 64, 128 or 256 bytes. Since the minimum packet size on Ethernet is 64 bytes, in order to avoid timestamp jitter due to different packet lengths, we set the threshold and the mpacket size to 64 bytes. This way, the first thread in the RX FREELIST is awaken at time tx with a fixed delay from the arrival time ta . The delay tx − ta consists of the sum of three latencies corresponding to the three interfaces that data has to cross: 1) the time to reach the ”forwarding threshold” within the PM3386, given by d0 = 512bits/1Gbps = 0.512µs; 2) the time required by the PM3386 to transfer data across the second interface toward SPI-3 bridge, given by d1 = (512bits/32bits)/104M hz ∼ = 0.154µs; 3) the time required by the SPI-3 to transfer data across the third interface, which operates at the same speed as the second one, thus adding an equal delay d2 = d1 . Therefore, provided there is an available thread ready to timestamp the packet as soon as it arrives, the time lag tx − ta = d0 + d1 + d2 ∼ = 0.820µs is fixed and known. B. The Accuracy of Timestamp We now have to prove that there is always such a thread. The operations performed by a thread of the RX µ-e when a packet arrived are timestamping (i.e., reads a timestamp counter and stores its value into an internal register), copying packet data and timestamp into the DRAM and context switching. The first two steps together are very fast and take about 80 clock cycles (cc) to be executed. In the third step the µe puts itself in an idle state until the memory executes the
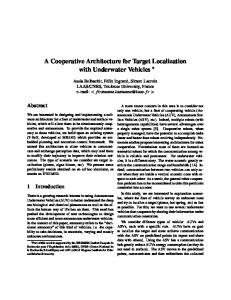
Fig. 5. Histogram of measured Tproc . Inequality (1) is satisfied for 4 threads (Tproc < 816cc) and 8 threads (Tproc < 1632cc).
requested operations and switches to the first ready thread in the RX FREELIST; when all the memory operations are completed, the thread is signaled by the memory hardware itself and can restart its operation. Clearly, while the memory controller is executing the requested operations, the µ-e can be used to perform other tasks by means of other threads. The worst case occurs whenever all packets are 65 bytes long: in this case, we have a 64 bytes long mpacket plus one extra 1 byte long mpacket. The total amount of time it takes to process this packet is twice the time needed for one mpacket (i.e. 2 × Tproc ), while the interarrival time is slightly higher than the single-mpacket case: 408cc instead of 364cc. As reported in the IXP2400 data sheet, the signaling delay to awake a RX thread is constant and very small. Thus, by using Nth threads per port, we make sure that the RX µ-e threads can receive and timestamp the first mpacket of a packet with a fixed delay from the real arrival time if the following inequality hold: Tproc ≤ 204cc × Nth
(1)
Since Tproc depends on a very large number of factors (accesses in memory, number of threads, instantaneous conditions, etc.), it has been experimentally measured. As shown in fig. 5, either for 4 and 8 threads it largely satisfies (1). As for packet batch creation, both the amount of data taken from each packet and the packet batch total size are configurable. Once the amount of data in the packet batch reaches the configured size, it is sent to the TX µ-e. Moreover, a timeout is provided to make sure that non-full packet batches are transmitted if no more packets arrive. Timestamp is provided by the use of 64-bit timestamp registers within the RX µ-e. Such registers are increased by one every 16cc (we shall call it ”NP-tick” or simply “tick”). Then each packet is timestamped with a value given by tx − d0 − d1 − d2 = tx − 492cc = tx − 31 ticks. Related to the accuracy of timestamp, note that the timestamp counter increases every 16 cc, thus each “tick” represents a time of (16/600)µs ∼ = 0.0267µs. To quantify the goodness
of such granularity, it is worth reminding that the most error sensitive application is traffic characterization; in this application the measure that has to be very accurate is the inter-arrival time of packets. Since the minimum inter-arrival time on a Gigabit Ethernet link is 0.68µs, we obtain a very good maximum error of 4%. If packets are concurrently captured from two interfaces, we have a timestamp error when two mpackets are presented to the SPI-3 chip by PM3386 and PM3387. An upper bound of the timestamping error is obtained in the worst case which takes place when two mpacket arrive exactly at the same time to the SPI-3. In this case one of the two mpackets has to wait Emax = d1 ∼ = 0.154µs before being timestamped. Comparing this error with the minimum inter-arrival time, we obtain a maximum error of 22.6% which is much larger than the 4% due to the clock granularity. VII. E XPERIMENTAL R ESULTS A. Experimental setup In the experimental testbed, the NP-based capturing device is connected to a high-end personal computer equipped by two Intel Xeon 2.8GHz CPUs (with hyper threading activated), 1 GByte of rambus RAM and a 3COM Gigabit Ethernet optical fiber network interface using the tg3 driver. The installed Operating System is Ubuntu Linux 7.04 OS with a 2.6.18 vanilla kernel. Unfortunately, the tg3 driver, along with the majority of the drivers for gigabit interfaces available for Linux, does not support the polling working mode (NAPI). Nonetheless, the interrupt mitigation mechanism supported in hardware by this 3COM interface proved to be sufficient to avoid the PC livelock. In order to perform packet capturing, a standard tcpdump and libpcap distribution is used. Data streams are generated by Spirent ADTECH AX/4000 hardware packet generator and analyzer. B. Performed experiments In the first experiment, a bulk traffic stream is generated and fed to the personal computer either directly or through the NP. The main purpose of this experiment is, on one hand, the evaluation of the processing overhead introduced by the abstraction layer and, on the other hand, the evaluation of the benefits introduced by the packet batching operation performed in the NP (due to the lower packet rate which means a lower rate of calls to the driver function). The NP has been set up to mark all the traffic with the flowID 3, thus making it available through the mon3 virtual network interface on the receiving PC. The stream is captured in both cases using the tcpdump raw capturing features. Hence, for the first experiment the command line is: user@hostname# tcpdump -i eth4 -w file1 while for the NP-driven one the command line is: user@hostname# tcpdump -i mon3 -w file2 The second experiment aims to show the capabilities of the system in extracting and process a mouse flow in presence of
Fig. 6. (a): Packets rawly saved to trace file. (b): Packets captured from the mouse flow.
an elephant one. Therefore two flows are involved: one (the mouse) from IP host 100.3.3.3 to 10.3.3.3 with TCP source port 100 and destination port 3357, the second (the elephant) with a different source port (3). The first flow is generated at a rate of 50kpps, while the second one is generated at increasing packet rates. The compound flow is once again captured by the PC alone and through the NP. The NP is configured to mark the mouse with flowID 4 (available through mon4 at the receiving PC). In both cases tcpdump is simply asked to decode each packet and write it in a trace file (in a real context, this is the minimum real-time packet processing). The issued command lines is the following: user@hostname# tcpdump -nttv -i eth4 -w file1 src host 10.3.3.3 and dst host 100.3.3.4 and src port 100 and dst port 3357 while, in the NP-driven experiment: user@hostname# tcpdump -nttv -i mon4 -w file1. In both experiments, packets are minimum sized. C. Results Fig. 6.a shows that for the bulk stream capturing the NPbased system outperforms the PC alone, meaning that the benefit of a lower number of calls to the driver is greater than the processing overhead introduced by the abstraction layer. Fig. 6.b shows the full advantage obtained using the NP in the flow extraction. In this context the PC shows all its architectural flaws loosing a huge amount of packets, while the NP-based system performs this operation with no loss. VIII. C ONCLUSIONS AND F UTURE W ORK This paper proposes a packet capturing system architecture which combines the power of a Network Processor card with the flexibility of software based solutions; this brings wire speed capturing capacity to applications such as traffic monitors, intrusion detection systems, protocol analyzers.
The system has been tested and proved to overcome or alleviate a number of limitations of standard PC traffic monitoring schemes. Moreover, it looks to be scalable towards multi gigabit environments by simply adopting a more powerful NP. The timestamping accuracy will be validated in a future paper, through a comparison with other solutions (e.g. DAG cards). Some refinements are planned for this architecture to overcome some design limitations. The first limitation is the use of a batch packet regardless of the fragment length configured by the user. Hence, if a user asks the system to capture the entire length of the packets, the resulting batch packet is longer then the maximum ethernet frame every time a full size packet is captured. To overcome this problem, we plan to use oversized ethernet frames handled by modern Gigabit Ethernet NICs. A second limitation is the use of a gigabit ethernet interface of the NP-board to send batch frames to the cluster; as a matter of fact, the number of interfaces on an NP board is one of the most important sources of cost and hence an interface is a resource to be saved. Therefore, a less expensive choice would be to use the PCI-X bus (which currently only gives power supply to the board) to transmit batch frames to the host PC and make it forward them to the cluster via a standard gigabit ethernet PCI-X NIC. Finally, another limitation of the system is that it cannot currently classify and duplicate packets to more than one flow in order to send a given packet to more than one processing PC or application. A possible solution involves the upgrade of the classification application (which must be able of handling rules with multiple target flowIDs), of the batch frame format (and hence the PC side abstraction layer) to bring multiple flowIDs per packet digest and of the batch frame crafting application to make it capable of copying a fragment across many packet digests (possibly with different fragment lengths). ACKNOWLEDGMENT This work has been sponsored by the Italian MIUR research program MIMOSA. R EFERENCES [1] Wireshark protocol analyzer (was Ethereal), http://www.wireshark.org. [2] Ntop network traffic probe, http://www.ntop.org. [3] Lawrence Berkeley National Labs, tcpdump/libpcap, Network Research Group, http://www.tcpdump.org/. [4] D. Ficara S. Giordano, F. Vitucci. Design and Implementation of a MultiDimensional Packet Classifier for Network Processor - technical report. http://wwwtlc.iet.unipi.it/research/classifier.pdf. [5] P. Wood, libpcap-mmap, Los Alamos National Labs, http://public.lanl.gov/cpw/. [6] J. Mogul and K. Ramakrisnan, Eliminating Receive Livelock in an Interrupt-Driven Kernel, Proc. of Usenix Technical Conference, 1996. [7] Luca Deri, Improving Passive Packet Capture:Beyond Device Polling Proceedings of SANE 2004. [8] Luca Deri, Passively Monitoring Networks at Gigabit Speeds Using Commodity Hardware and Open Source Software, Proc. of PAM 2003. [9] K. Xinidis, I. Charitakis, S. Antonatos, K. G. Anagnostakis, E. P. Markatos, An Active Splitter Architecture for Intrusion Detection and Prevention, IEEE Transactions on Dependable And Secure Computing, vol. 3, No. 1, January-March 2006. [10] T. Wolf, R. Ramaswamy, S. Bunga, and N. Yang, An architecture for distributed real-time passive network measurement, in Proc. of 14th Annual Meeting of MASCOTS, Monterey, CA, Sept. 2006, pp. 335-344.